Embed Size (px)
DESCRIPTION
2004-12-10
Citation preview

1Paris - October 12, 2004 – Investor Relati ons Directi on
UBS EUROPEAN UTILITIES SEMINAREnergy Services on a deregulating market
Olivier BarbarouxChief Executive Officer of Dalkia
Investor PresentationParis - October 12, 2004

2Paris - October 12, 2004 – Investor Relati ons Directi on
DisclaimerVeolia Environnement is a corporation listed on the NYSE and Euronext Paris. This document contains "forward-looking statements" within the meaning of the provisions of the U.S. Private Securities Litigation Reform Act of 1995. Such forward-looking statements are not guarantees of future performance. Actual results may differ materially from the forward-looking statements as a result of a number of risks and uncertainties, many of which are outside our control, including but not limited to: the risk of suffering reduced profits or losses as a result of intense competition, the risks associated with conducting business in some countries outside of Western Europe, the United States and Canada, the risk that changes in energy prices and taxes may reduce VeoliaEnvironnement's profits, the risk that we may make investments in projects without being able to obtain the required approvals for the project, the risk that governmental authorities could terminate or modify some of Veolia Environnement's contracts, the risk that our long-term contracts may limit our capacity to quickly and effectively react to general economic changes affecting our performance under those contracts, the risk that Veolia Environnement's compliance with environmental laws may become more costly in the future, the risk that currency exchange rate fluctuations may negatively affect Veolia Environnement's financial results and the price of its shares, the risk that Veolia Environnement may incur environmental liability in connection with its past, present and future operations, as well as the risks described in the documents Veolia Environnement has filed with the U.S. Securities and Exchange Commission. Veolia Environnement does not undertake, nor does it have, any obligation to provide updates or to revise any forward-looking statements. Investors and security holders may obtain a free copy of documents filed by Veolia Environnementwith the U.S. Securities and Exchange Commission from Veolia Environnement.
This document contains "non-GAAP financial measures" within the meaning of Regulation G adopted by the U.S. Securities and Exchange Commission under the U.S. Sarbanes-Oxley Act of 2002. These "non-GAAP financial measures" are being communicated and made public in accordance with the exemption provided by Rule 100(c) of Regulation G.

3Paris - October 12, 2004 – Investor Relati ons Directi on
Present in 35 countries in 2003
Managedturnover (Million €)
Staff Managed
FranceNorthern Atlantic Zone Central Europe Zone Southern Zone
Geographic zone
Europe :European leader in Energy Services with a
presence in 24 countries
Rest of the World :Present in 11 countries
Others*Northern Europe Zone
At 31/12/03
677435
98
603
459
2,929 19,161
4,8988,2393,702516
5,226
41,7425,201
* Development Zone and specialisation companies with international activity

4Paris - October 12, 2004 – Investor Relati ons Directi on
Business ActivitiesThe « guaranteed performance » contract
Guaranteed results
Long-term contract
Dalkia’score offer
Ene
rgy
Ups
trea
m
• Coal• Fuel oil• Gas oil• Gas• Electricity• Biomass O
utpu
ts li
sted
in
per
form
ance
co
ntra
ct
• Temperature• Heat• Steam• Compressed air• Lighting• ……etc…….
Process of Energy
Transformation
Dalkia purchases energy upstream of customer site
Dalkia operates and maintains its customers’ energy-transforming equipment (boiler, turbine, air conditioning system, compressor, lighting system, etc.)
Dalkia sells the finished product with a guarantee of results (quantity, quality, rate, availability)
Dalkia: a purchaser and transformer of energy
Customers: Industry, Tertiary Sector, Public Sector

5Paris - October 12, 2004 – Investor Relati ons Directi on
2003 turnover segmentation
Customer Type
Business Activity
Local Authorities28.0%
Residential Building Managers
16.0%
Individual Housing2.0%
Industrials29.0%
Tertiary (Private Sector)
7.5%
Tertiary (Public Sector)
17.5%
Industrial Maintenance8.0%
Installation8.0%
Heating Systems & Muti-technical
Services33.0% Facilities Management
8.0%
Industrial Utilities14.0%
Public Lighting & Other
5.0%
Heating & Cooling Networks
24.0%

6Paris - October 12, 2004 – Investor Relati ons Directi on
Cogeneration
Heating
Heating Networks
BuildingMgt
Multi-technical
Air Con
Other
Steam
Residential Local Authorities Tertiary IndustryOther
Works0
20
40
60
80
100%
Cogeneration
Heating
Heating Networks
Building Mgt
Multitechnical
Air Con
P1 electric
Clean Rooms
Cogeneration
Bui lding MgtMultitechnicalCompressed Air
Air ConCold (process)
Steam
Maintenance (process)
BuildingMgt
Air ConOther
ResidentialLocal Authorities Tertiary Industry
OtherWorks
0
20
40
60
80
100%
Strategy & developmentVision for Dalkia France
Strategy :• growth• a more diversified
portfolio of services and customers
Turnover segmentation of the conventional businesses of Dalkia France by activity and client
2010
2004

7Paris - October 12, 2004 – Investor Relati ons Directi on
Strategy & developmentThe role of cogeneration
• A sizeable electricity generation solution : 7000 MW in France• A good efficiency in terms of GHG emissions• An answer to diversify electricity supply sources• The interest of a decentralised generation source : RTE’s support in PACA
⇒⇒ Cogeneration has an important role to play in the future.Cogeneration has an important role to play in the future.
Enhanced by increasing tension on the electricity market during Enhanced by increasing tension on the electricity market during next 20 years.next 20 years.
CogeneratorsCogenerators like DALKIA will have to manage the like DALKIA will have to manage the
equation gas/electricity/CO²/flexibility on the open marketequation gas/electricity/CO²/flexibility on the open market

8Paris - October 12, 2004 – Investor Relati ons Directi on
Strategy & developmentDalkia’s Value Chain
Processload
delivery
Energy &environmentalperformance
Short term (P2)Long term (P3)Maintenance
Technicalenergy
efficiency
Optimisation of site energy
assets
Energy purchasing
Energy Markets
Competence
Sophisticatedtechnical &R&D skills
Processunderstanding
Quotamonitoring,
forecasting &trading skills
Client Needs(steam, hot water,compressed air…)
EnergyTransformation
Process
UpstreamEnergies
(gas, coal, HFO,electricity…)
Dalkia’s commitment : to attain excellence at each component of the value-chain
Electricity
Global outsourcing of engineering skills
Dalkia ’s Added Value

9Paris - October 12, 2004 – Investor Relati ons Directi on
Dalkia Energy Market Portfolio
Growth
Growth
2002 2003 2004 Proforma*
70
8287
0
20
40
60
80
100 TWh (pci) of energy consumed
An important & growing portfolio with an increasingly diversified rangeof energy purchasing ………..… of energies and geographic origin
Gas Coal Others0
20
40
60
80
100%Segmentation of 2004 Proforma volumes
FranceUKCzech RHungaryPolandLithuania
Iberia& Italy
EstoniaSlovakiaRomaniaOthers**
* 2004 proforma : includes cogeneration at Ploiesti & Poznan** Others include : petroleum products, renewables, electricity, heat….
Other Key Dalkia figures• 10.3 TWh’s of decentralised electricity produced from a park of 4800 MW• Gas consumption represents ~1.2% of the total gas consumed in the EU25 • CO2 emissions caught within the EU Emissions Trading Scheme will be 1% - 2% of the total

10Paris - October 12, 2004 – Investor Relati ons Directi on
Dalkia Energy MarketProficiency
Strategy : A unique positioning to maximise competitiveness :
⇒ complete independence towards all energy suppliers ⇒ capture the best opportunities when they arise ⇒ leverage our portfolio (energies and countries)⇒ optimise our positions and flexibility
Means : A highly skilled specialist team⇒ centrally-based expertise plus network of regional
specialists⇒ experience in all of the key EU25 countries⇒ capabilities across all markets (gas, electricity, coal,
petroleum products, renewables, CO2)
Examples :⇒ mutualisation of gas portfolio in France
based on experience gained in the UK⇒ electricity network services in Eastern Europe⇒ CO2 trading in the UK ETS⇒ renewable re-powering in the Baltics
2002 2003 2004 Estimated0
20
40
60
80
100%
Non Daily Metered Sites on historical tariff «No competition »
Daily Metered (DM) Sites on historical tariff
DM Sites on « eligible » contract with incumbent supplier
DM Sites on « eligible » contract with new entrant
Dalkia has a faster switching rate (30%) than the French market (25%) despite its cogeneration position :
⇒ globalisation of Take-or-Pay and Balancing risks
⇒ hedging & optimisation of market risks ⇒ partnership agreements with key suppliers⇒ customer benefits from switch, with limited risk
Example : French gas portfolio
30 %

11Paris - October 12, 2004 – Investor Relati ons Directi on
Strategy & developmentEuropean Emissions Trading Scheme
Non-CO2
CO2
Excludedsectors
ETS 5 sectors
Other 4 sect ors
Power & Heat
All GHG's CO2 EU ETS0
1,000
2,000
3,000
4,000
5,000Million tonnes
Analysis of EU25 emissions in 2001 Estimation of Baseline emissions & Quotas
> Preliminary analysis of EU National Allocation Plans (NAP’s) suggests that :-– historical emissions from facilities within the EU ETS are around 2 000 million tonnes– the quota allocations will generate a system-wide position which is either marginally short or long (+/- 1-2%)– the quota supply-side will be heavily influenced by the power sector (fuel switching between coal & gas)
> Dalkia’s allocations will be heavily influenced by final NAP’s in France, Czech Republic, Poland and Lithuania -none of which have yet been verified by the EU Commission
> Dalkia anticipates :– a quota allocation of between 1% and 2% of the EU25 total for around 250 sites – a net long position, thanks mostly to its cogeneration portfolio (note customer positions and heat regulator positions)
> Dalkia will leverage its UK experience & Centralised Energy Team to manage & optimise its important positions across the EU25
LithuaniaEstoniaSwedenIrelandHungaryDenmarkSlovakiaAustriaPortugalFinlandBelgiumGreeceCzech RHollandFranceSpainItalyUKPolandGermany
0 200 400 600
Million tonnesBaselineQuota
12Paris - October 12, 2004 – Investor Relati ons Directi on
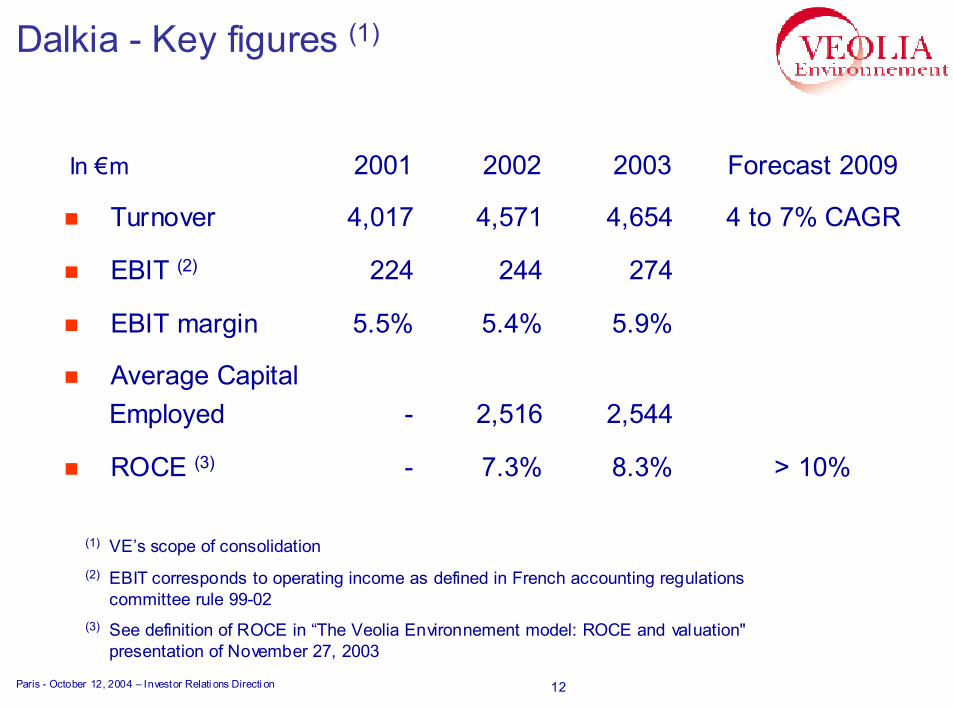
(1) VE’s scope of consolidation (2) EBIT corresponds to operating income as defined in French accounting regulations
committee rule 99-02(3) See definition of ROCE in “The Veolia Environnement model: ROCE and valuation"
presentation of November 27, 2003
Dalkia - Key figures (1)
2001 2002 2003 Forecast 2009
Turnover 4,017 4,571 4,654 4 to 7% CAGR
EBIT (2) 224 244 274
EBIT margin 5.5% 5.4% 5.9%
Average CapitalEmployed - 2,516 2,544
ROCE (3) - 7.3% 8.3% > 10%
In €m


![European Utilities Basics Electricity Gas Industry Overview[1]](https://img.dokumen.tips/doc/110x75/54fdcb854a7959055e8b480c/european-utilities-basics-electricity-gas-industry-overview1.jpg)

