Embed Size (px)
Citation preview
DISENTANGLING THE ANTECEDENTS OF AMBIDEXTERITY:EXPLORATION AND EXPLOITATION
11 February 2015
Andy Lockett, James Hayton, Oksana
Koryak, Deniz Ucbasaran & Kevin Mole
Warwick Business School
Enterprise Research Centre
Motivation
Ambidexterity is important for a number of organizational outcomes, including growth, both in the short run and long run.
Ambidexterity, however, is a difficult capability for firms to develop because its components (exploration and exploitation) require substantially different structures, processes, strategies and capabilities (Benner & Tushman, 2003; Katila & Ahuja, 2002; McGrath, 2001; Siggelkow & Levinthal, 2003). Exploration is associated with organic structures, improvisation and
autonomy (Katila & Ahuja, 2002; Rosenkopf & Nerkar, 2001); whereas
Exploitation is associated with mechanistic structures, path dependence and routinization (Beckman et al., 2004; Benner & Tushman, 2003; March, 1991).
Motivation
A major stream of research on ambidexterity has focused its antecedents, however, this work has taken ambidexterity as an aggregate construct. The position is surprising given that exploration and exploitation may
require substantially different structures, processes, strategies and capabilities
Following the lead of Beckman (2006) we disaggregate ambidexterity and examine whether or not its antecedents have differential effects on the exploration and exploitation, and in doing so identify some of the fundamental tensions in becoming an ambidextrous firm.
Research question: How do antecedents of Exploration and Exploitation capabilities differ?
Modelling strategy Drawing on the attention based view (Ocasio, 1997; 2011) and
cognitive approaches to strategic management (Gavetti & Levinthal, 2000) we view the development of explorative and exploitative capacity to be a consequence of the focus of managerial attention.
We examine three antecedent factors that reflect the three key principles of the attention-based view (Ocasio, 1997): Attention is selective – different factors drive attention to different targets
Attention is situated – the social context and organizational communications are important channels for steering attention
Attention is distributed – culture and behavioural controls impact attention throughout the organization
Modelling strategy
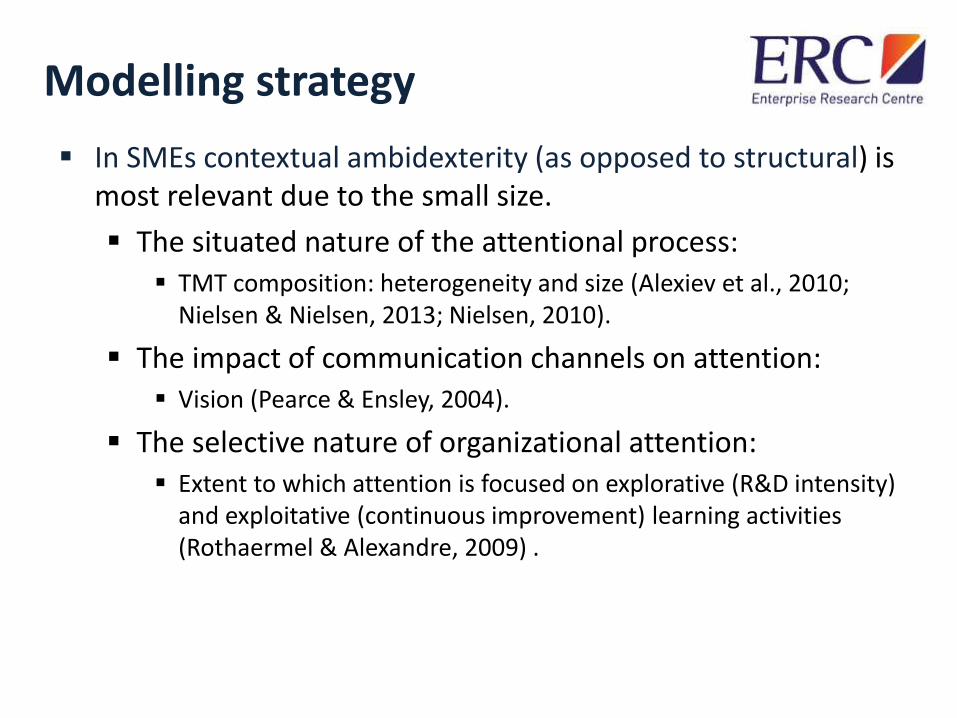
In SMEs contextual ambidexterity (as opposed to structural) is most relevant due to the small size.
The situated nature of the attentional process: TMT composition: heterogeneity and size (Alexiev et al., 2010;
Nielsen & Nielsen, 2013; Nielsen, 2010).
The impact of communication channels on attention: Vision (Pearce & Ensley, 2004).
The selective nature of organizational attention: Extent to which attention is focused on explorative (R&D intensity)
and exploitative (continuous improvement) learning activities (Rothaermel & Alexandre, 2009) .
TMT composition
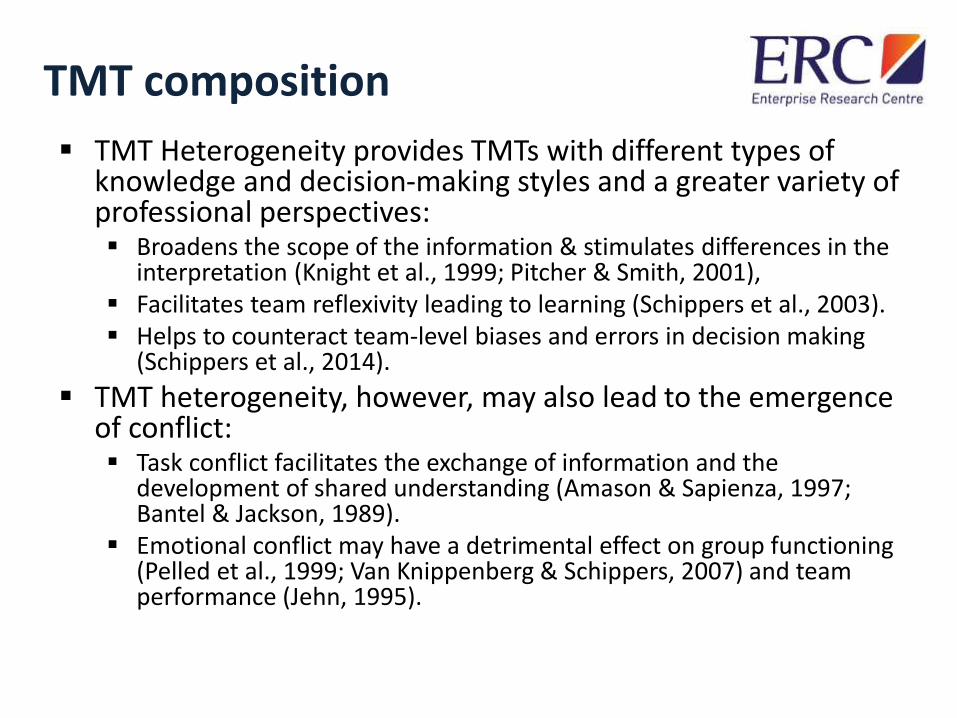
TMT Heterogeneity provides TMTs with different types of knowledge and decision-making styles and a greater variety of professional perspectives: Broadens the scope of the information & stimulates differences in the
interpretation (Knight et al., 1999; Pitcher & Smith, 2001), Facilitates team reflexivity leading to learning (Schippers et al., 2003). Helps to counteract team-level biases and errors in decision making
(Schippers et al., 2014).
TMT heterogeneity, however, may also lead to the emergence of conflict: Task conflict facilitates the exchange of information and the
development of shared understanding (Amason & Sapienza, 1997; Bantel & Jackson, 1989).
Emotional conflict may have a detrimental effect on group functioning (Pelled et al., 1999; Van Knippenberg & Schippers, 2007) and team performance (Jehn, 1995).
TMT composition and exploration
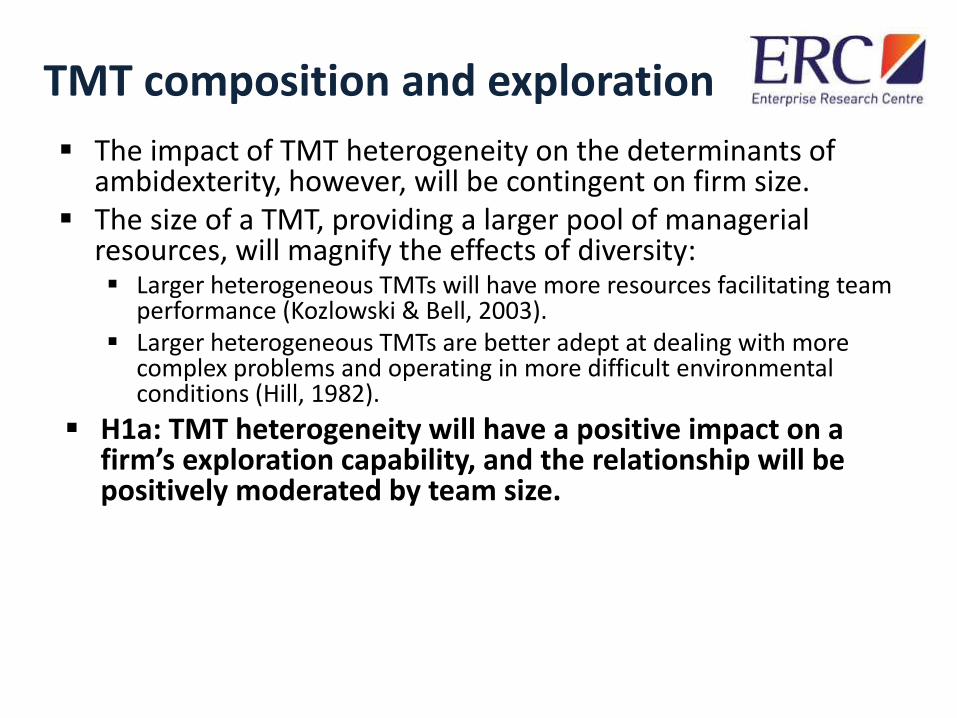
The impact of TMT heterogeneity on the determinants of ambidexterity, however, will be contingent on firm size.
The size of a TMT, providing a larger pool of managerial resources, will magnify the effects of diversity: Larger heterogeneous TMTs will have more resources facilitating team
performance (Kozlowski & Bell, 2003). Larger heterogeneous TMTs are better adept at dealing with more
complex problems and operating in more difficult environmental conditions (Hill, 1982).
H1a: TMT heterogeneity will have a positive impact on a firm’s exploration capability, and the relationship will be positively moderated by team size.
TMT composition and exploitation
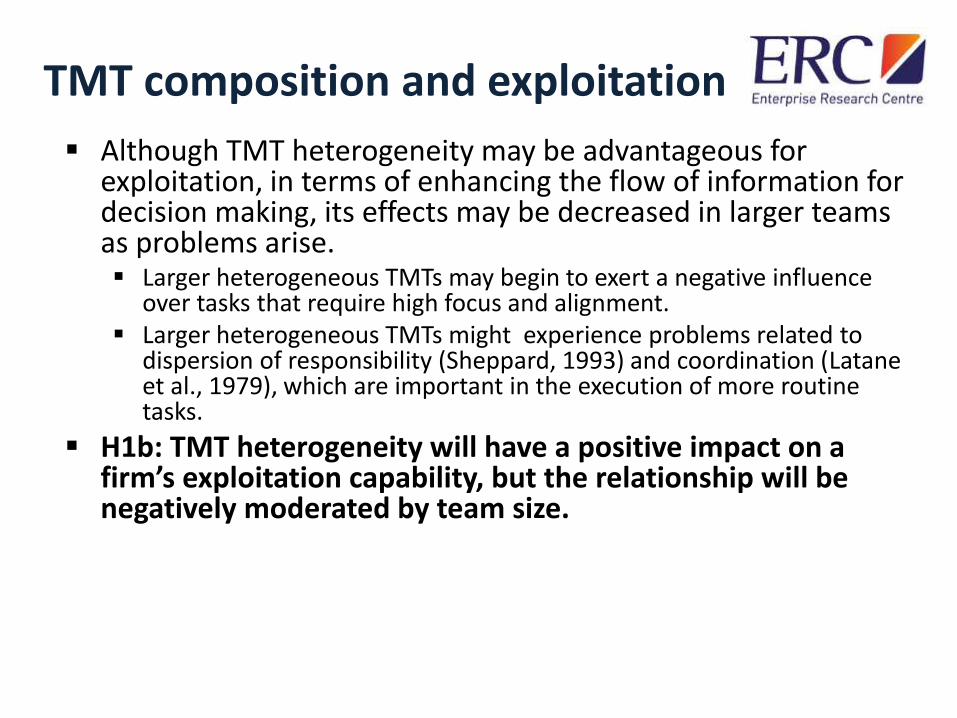
Although TMT heterogeneity may be advantageous for exploitation, in terms of enhancing the flow of information for decision making, its effects may be decreased in larger teams as problems arise. Larger heterogeneous TMTs may begin to exert a negative influence
over tasks that require high focus and alignment. Larger heterogeneous TMTs might experience problems related to
dispersion of responsibility (Sheppard, 1993) and coordination (Lataneet al., 1979), which are important in the execution of more routine tasks.
H1b: TMT heterogeneity will have a positive impact on a firm’s exploitation capability, but the relationship will be negatively moderated by team size.
Vision and exploration/exploitation
Vision has been identified as an important antecedent of ambidexterity (O'Reilly & Tushman, 2008; O Reilly & Tushman, 2004), and has been identified as important for firm growth (Baum & Locke, 2004; Baum et al., 1998; Naffziger et al., 1994).
Articulating a clear vision for an organization inspires action (Avolio & Bass, 1995; Pieterse et al., 2010).
Vision is an important component of entrepreneurial leadership (Gupta et al., 2004).
Vision reflects a communications channel, which is an important mechanism through which attention is focused and control exerted throughout the organization (Ocasio & Wohlgezogen, 2010).
Vision and exploration/exploitation
Vision communicates the rules of the game, influencing attention by shaping the situation in terms of defining context, participants, and resources (Ocasio & Wohlgezogen, 2010). Vision is likely to be particularly relevant for activities that focus on
promoting efficiency by regularizing decision making (Ocasio & Wohlgezogen, 2010).
In contrast, a focus on clearly defined actions might hamper exploration activities reliant on creativity and experimentation
H2a: Written vision will be negatively related to exploration.
H2b: Written vision will be positively related to exploitation.
R&D intensity and exploration R&D intensity is positively related to innovation activity
(Cardinal & Hatfield, 2000; Hall et al., 1986; Pakes & Griliches, 1984) through enhanced internal development of new discoveries as well as the flow of new information into the firm.
However, there are diminishing returns from R&D in terms of performance and firm value (Ho et al., 2004; Mank & Nystrom, 2001; Zenger, 1994). May be related to the fact that firms switch from exploration to
exploitation and vice versa (Mudambi & Swift, 2001, 2014).
H3a: R&D intensity will be positively related to exploration capability, however, the relationship will be subject to diminishing returns
R&D intensity and exploration
The systematic and deliberate investment in R&D will raise the cost base of the firm, and restrict firms’ ability to raise debt and increases the cost thereof (Williamson, 1988).
Firms with high levels of R&D intensity run the risk of overly engaging in the exploration of new opportunities at the expense of being able to generate complementary assets and processes to exploit them. May reduce the value that can be extracted from the strategic assets
created through already-funded R&D projects (Dierickx & Cool, 1989).
In addition to financial investment, higher levels of R&D intensity may reflect TMT members selective decisions about the focus of attention in terms of their cognitive investments.
H3b: R&D intensity will be negatively related to exploitation
Continuous improvement exploration
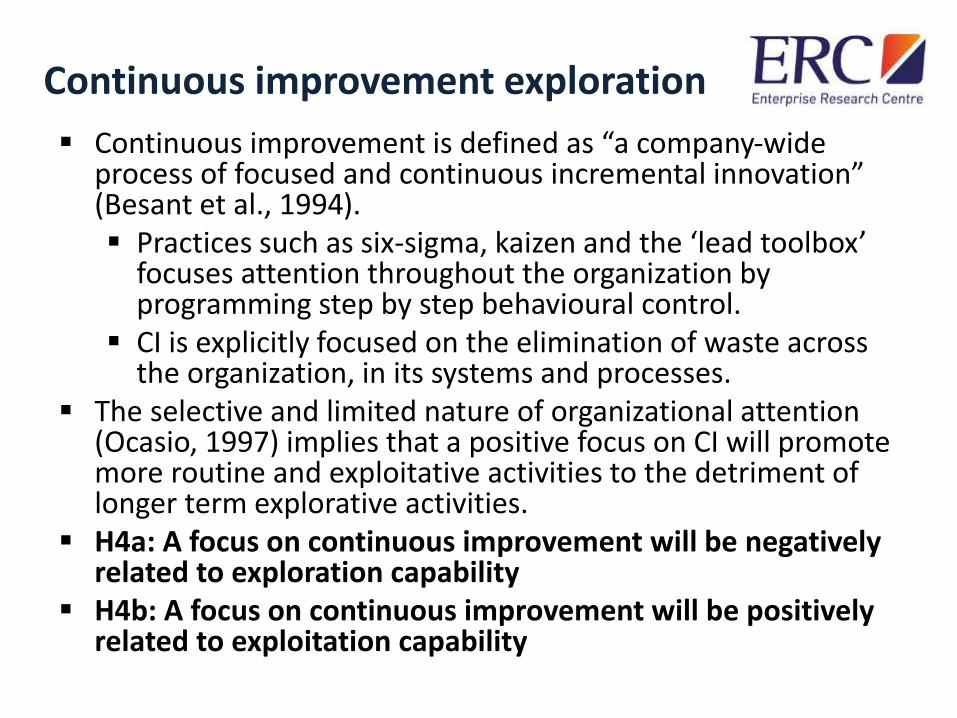
Continuous improvement is defined as “a company-wide process of focused and continuous incremental innovation” (Besant et al., 1994). Practices such as six-sigma, kaizen and the ‘lead toolbox’
focuses attention throughout the organization by programming step by step behavioural control.
CI is explicitly focused on the elimination of waste across the organization, in its systems and processes.
The selective and limited nature of organizational attention (Ocasio, 1997) implies that a positive focus on CI will promote more routine and exploitative activities to the detriment of longer term explorative activities.
H4a: A focus on continuous improvement will be negatively related to exploration capability
H4b: A focus on continuous improvement will be positively related to exploitation capability
Data and analysis
Sample frame based on Fame database to link survey data to financial information.
Main data collected using phone survey data, complemented by objective information from Fame.
Initial questionnaire was pre-tested on 25 firms.
Scales are based on existing literature with minor modifications where necessary to suit the context.
Current analysis is based on cross-sectional data.
Regression analysis is based on a sample of 378 firms.
Data and analysis
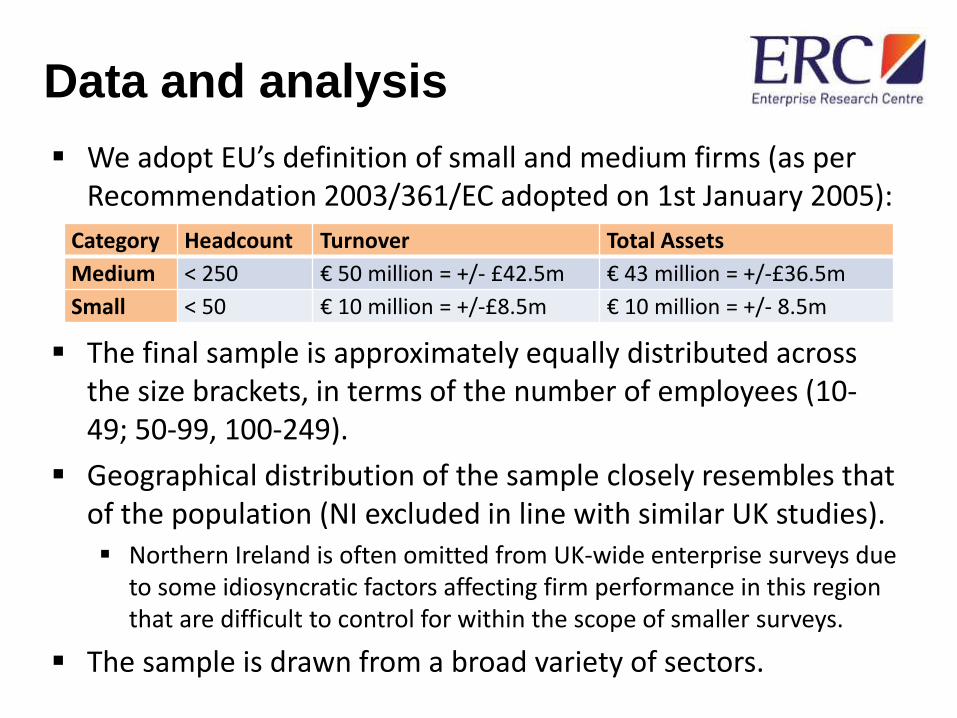
We adopt EU’s definition of small and medium firms (as per Recommendation 2003/361/EC adopted on 1st January 2005):
The final sample is approximately equally distributed across the size brackets, in terms of the number of employees (10-49; 50-99, 100-249).
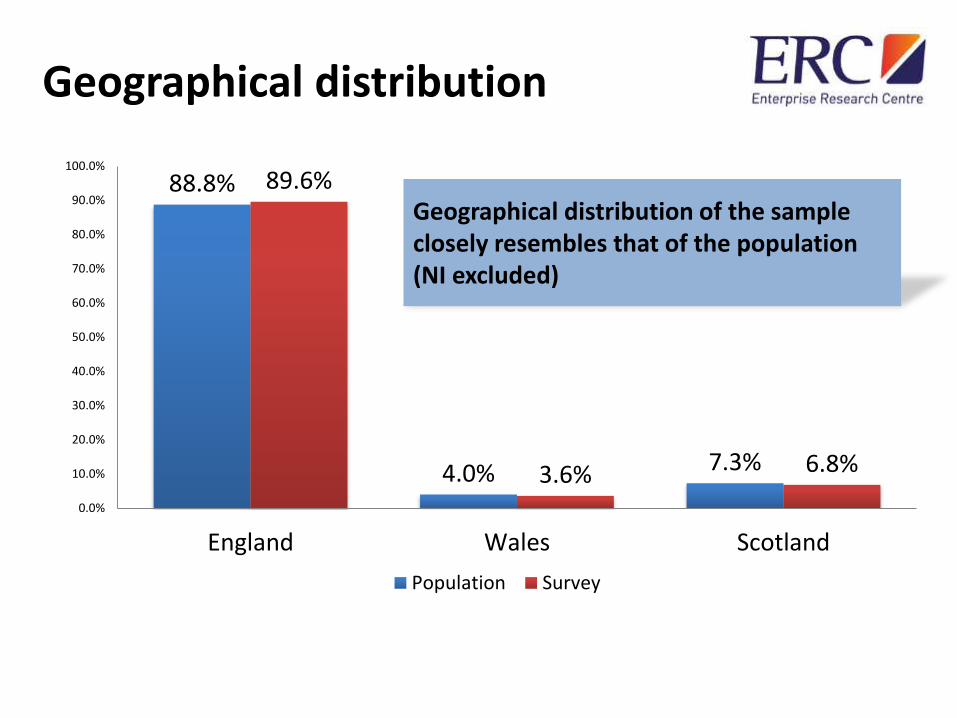
Geographical distribution of the sample closely resembles that of the population (NI excluded in line with similar UK studies). Northern Ireland is often omitted from UK-wide enterprise surveys due
to some idiosyncratic factors affecting firm performance in this region that are difficult to control for within the scope of smaller surveys.
The sample is drawn from a broad variety of sectors.
Category Headcount Turnover Total Assets
Medium < 250 € 50 million = +/- £42.5m € 43 million = +/-£36.5m
Small < 50 € 10 million = +/-£8.5m € 10 million = +/- 8.5m
Measures
Dependent variables: Exploration & exploitation (Lubatkin et al., 2006).
Independent variables: TMT heterogeneity (Van Doorn et al., 2013) and TMT size. Vision (based on: Baum & Locke, 2004). R&D intensity (Rothaermel & Alexandre, 2009). Continuous improvement (Peng et al., 2008).
Controls: Firm age, firm size and substantive capabilities (Marketing, HR and
Financial management capabilities based on (Vorhies and Morgan (2005) measure of marketing implementation scale).
Industry: industry category dummies (manufacturing, high tech services and other) as well as environmental dynamism, munificence, the latter two as per Castrogiovanni (2002), calculated over 5-year interval (2008-2012) on the basis of Annual Business Survey 2012 (Office for National Statistics).
Measures
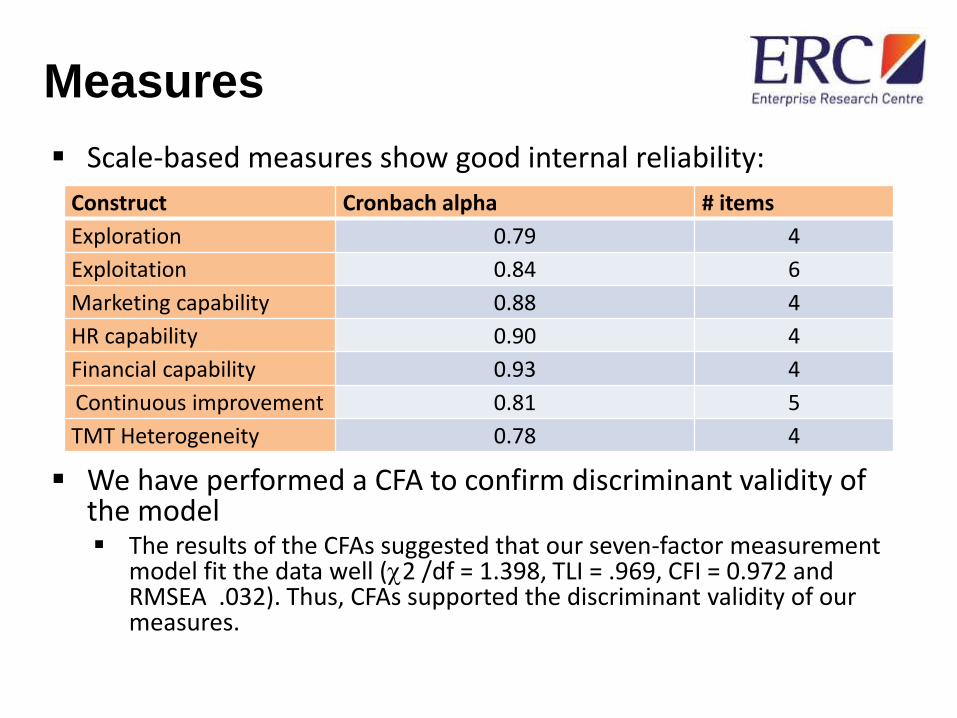
Scale-based measures show good internal reliability:
We have performed a CFA to confirm discriminant validity of the model The results of the CFAs suggested that our seven-factor measurement
model fit the data well (2 /df = 1.398, TLI = .969, CFI = 0.972 and RMSEA .032). Thus, CFAs supported the discriminant validity of our measures.
Construct Cronbach alpha # items
Exploration 0.79 4
Exploitation 0.84 6
Marketing capability 0.88 4
HR capability 0.90 4
Financial capability 0.93 4
Continuous improvement 0.81 5
TMT Heterogeneity 0.78 4
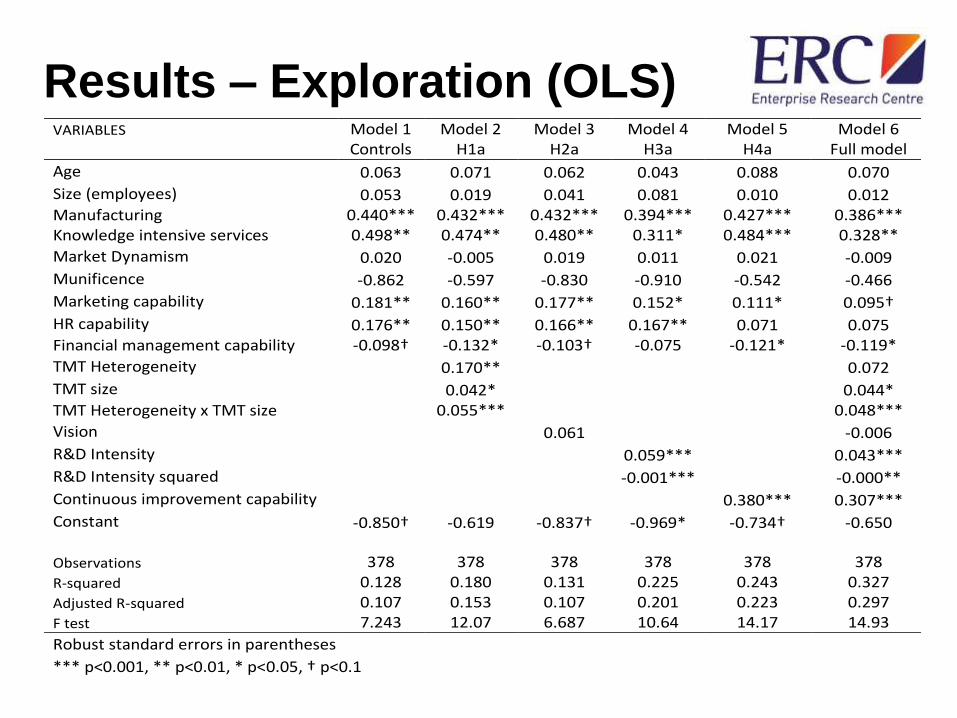
Results – Exploration (OLS)VARIABLES Model 1 Model 2 Model 3 Model 4 Model 5 Model 6
Controls H1a H2a H3a H4a Full model
Age 0.063 0.071 0.062 0.043 0.088 0.070
Size (employees) 0.053 0.019 0.041 0.081 0.010 0.012 Manufacturing 0.440*** 0.432*** 0.432*** 0.394*** 0.427*** 0.386*** Knowledge intensive services 0.498** 0.474** 0.480** 0.311* 0.484*** 0.328**
Market Dynamism 0.020 -0.005 0.019 0.011 0.021 -0.009
Munificence -0.862 -0.597 -0.830 -0.910 -0.542 -0.466
Marketing capability 0.181** 0.160** 0.177** 0.152* 0.111* 0.095†
HR capability 0.176** 0.150** 0.166** 0.167** 0.071 0.075 Financial management capability -0.098† -0.132* -0.103† -0.075 -0.121* -0.119*
TMT Heterogeneity
0.170**
0.072
TMT size
0.042*
0.044*
TMT Heterogeneity x TMT size
0.055***
0.048***
Vision
0.061
-0.006
R&D Intensity
0.059***
0.043***
R&D Intensity squared
-0.001***
-0.000**
Continuous improvement capability
0.380*** 0.307***
Constant -0.850† -0.619 -0.837† -0.969* -0.734† -0.650
Observations 378 378 378 378 378 378
R-squared 0.128 0.180 0.131 0.225 0.243 0.327
Adjusted R-squared 0.107 0.153 0.107 0.201 0.223 0.297
F test 7.243 12.07 6.687 10.64 14.17 14.93
Robust standard errors in parentheses
*** p<0.001, ** p<0.01, * p<0.05, † p<0.1
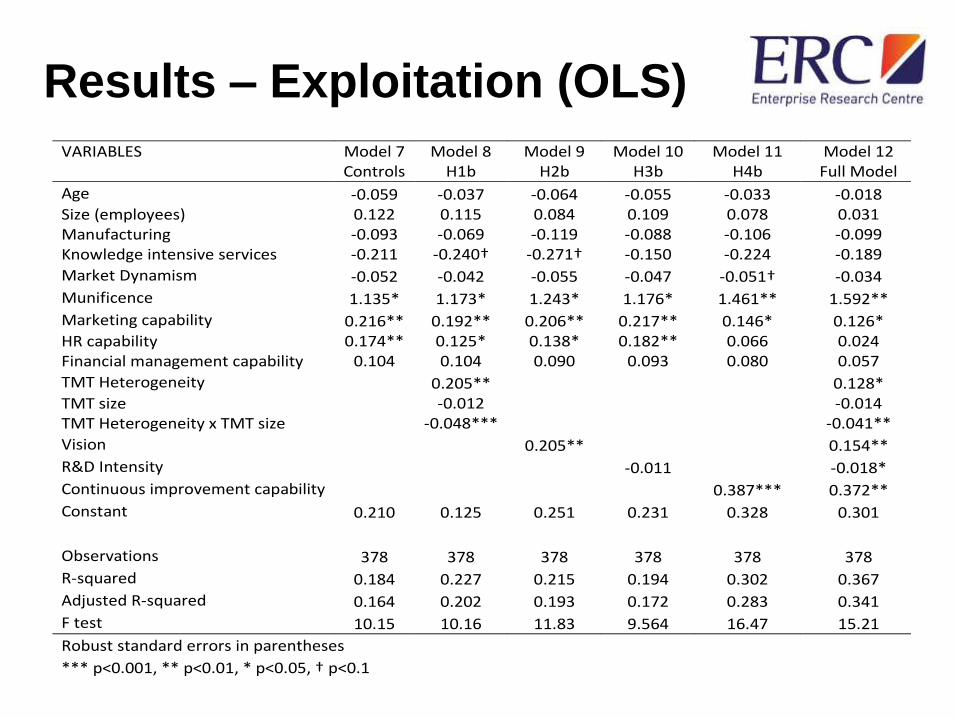
Results – Exploitation (OLS)
VARIABLES Model 7 Model 8 Model 9 Model 10 Model 11 Model 12 Controls H1b H2b H3b H4b Full Model
Age -0.059 -0.037 -0.064 -0.055 -0.033 -0.018 Size (employees) 0.122 0.115 0.084 0.109 0.078 0.031 Manufacturing -0.093 -0.069 -0.119 -0.088 -0.106 -0.099 Knowledge intensive services -0.211 -0.240† -0.271† -0.150 -0.224 -0.189
Market Dynamism -0.052 -0.042 -0.055 -0.047 -0.051† -0.034
Munificence 1.135* 1.173* 1.243* 1.176* 1.461** 1.592**
Marketing capability 0.216** 0.192** 0.206** 0.217** 0.146* 0.126* HR capability 0.174** 0.125* 0.138* 0.182** 0.066 0.024 Financial management capability 0.104 0.104 0.090 0.093 0.080 0.057
TMT Heterogeneity
0.205**
0.128*
TMT size
-0.012
-0.014 TMT Heterogeneity x TMT size
-0.048***
-0.041**
Vision
0.205**
0.154**
R&D Intensity
-0.011
-0.018*
Continuous improvement capability
0.387*** 0.372**
Constant 0.210 0.125 0.251 0.231 0.328 0.301
Observations 378 378 378 378 378 378
R-squared 0.184 0.227 0.215 0.194 0.302 0.367
Adjusted R-squared 0.164 0.202 0.193 0.172 0.283 0.341
F test 10.15 10.16 11.83 9.564 16.47 15.21
Robust standard errors in parentheses
*** p<0.001, ** p<0.01, * p<0.05, † p<0.1
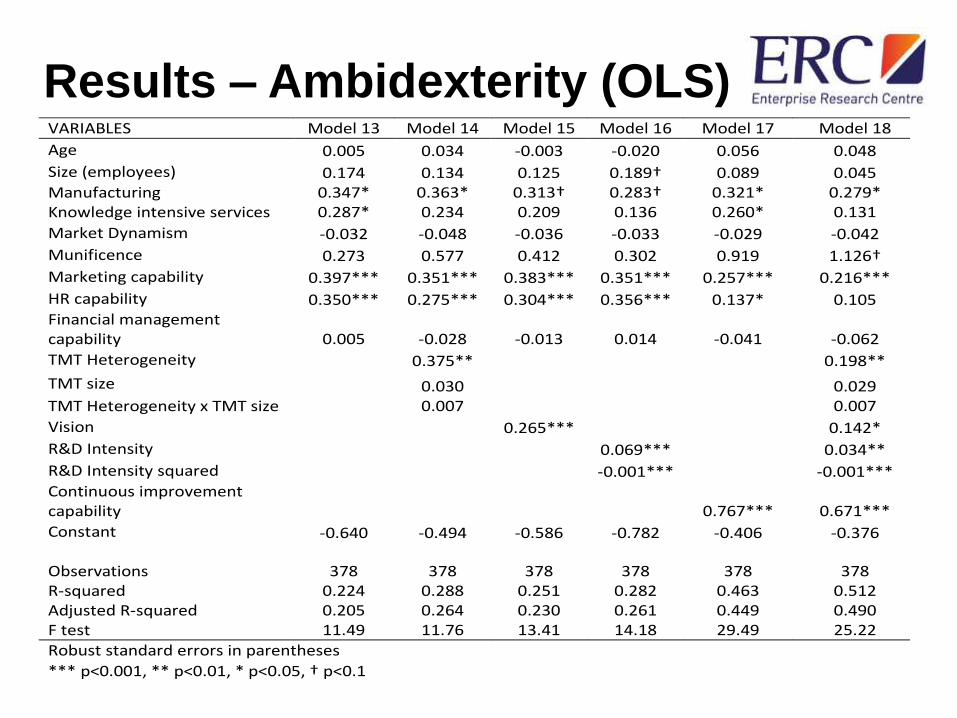
Results – Ambidexterity (OLS)VARIABLES Model 13 Model 14 Model 15 Model 16 Model 17 Model 18
Age 0.005 0.034 -0.003 -0.020 0.056 0.048
Size (employees) 0.174 0.134 0.125 0.189† 0.089 0.045 Manufacturing 0.347* 0.363* 0.313† 0.283† 0.321* 0.279* Knowledge intensive services 0.287* 0.234 0.209 0.136 0.260* 0.131
Market Dynamism -0.032 -0.048 -0.036 -0.033 -0.029 -0.042
Munificence 0.273 0.577 0.412 0.302 0.919 1.126†
Marketing capability 0.397*** 0.351*** 0.383*** 0.351*** 0.257*** 0.216***
HR capability 0.350*** 0.275*** 0.304*** 0.356*** 0.137* 0.105 Financial management capability 0.005 -0.028 -0.013 0.014 -0.041 -0.062
TMT Heterogeneity
0.375**
0.198**
TMT size
0.030
0.029
TMT Heterogeneity x TMT size
0.007
0.007
Vision
0.265***
0.142*
R&D Intensity
0.069***
0.034**
R&D Intensity squared
-0.001***
-0.001***
Continuous improvement capability
0.767*** 0.671***
Constant -0.640 -0.494 -0.586 -0.782 -0.406 -0.376
Observations 378 378 378 378 378 378 R-squared 0.224 0.288 0.251 0.282 0.463 0.512 Adjusted R-squared 0.205 0.264 0.230 0.261 0.449 0.490 F test 11.49 11.76 13.41 14.18 29.49 25.22
Robust standard errors in parentheses *** p<0.001, ** p<0.01, * p<0.05, † p<0.1
Summary of the results
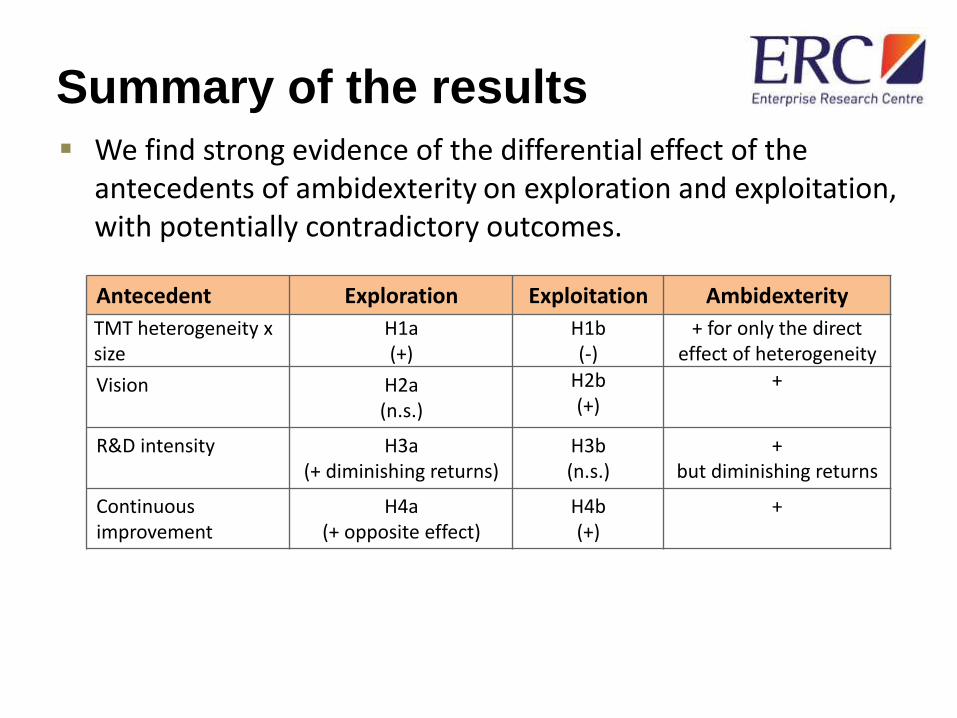
We find strong evidence of the differential effect of the antecedents of ambidexterity on exploration and exploitation, with potentially contradictory outcomes.
Antecedent Exploration Exploitation Ambidexterity
TMT heterogeneity xsize
H1a(+)
H1b(-)
+ for only the direct effect of heterogeneity
Vision H2a(n.s.)
H2b(+)
+
R&D intensity H3a(+ diminishing returns)
H3b(n.s.)
+but diminishing returns
Continuous improvement
H4a(+ opposite effect)
H4b(+)
+
Discussion
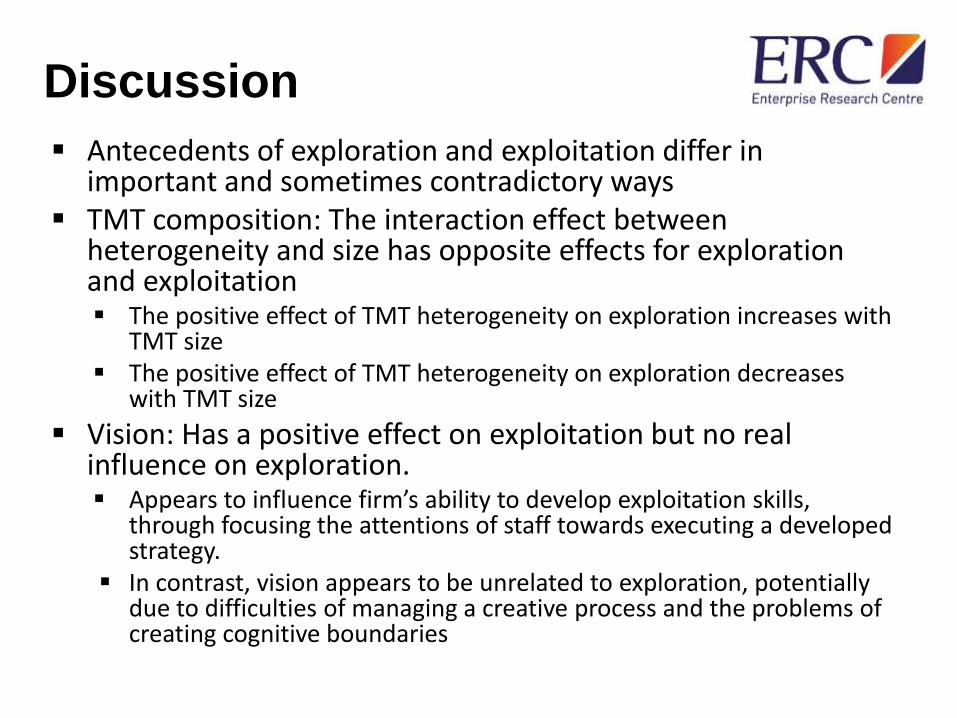
Antecedents of exploration and exploitation differ in important and sometimes contradictory ways
TMT composition: The interaction effect between heterogeneity and size has opposite effects for exploration and exploitation The positive effect of TMT heterogeneity on exploration increases with
TMT size The positive effect of TMT heterogeneity on exploration decreases
with TMT size
Vision: Has a positive effect on exploitation but no real influence on exploration. Appears to influence firm’s ability to develop exploitation skills,
through focusing the attentions of staff towards executing a developed strategy.
In contrast, vision appears to be unrelated to exploration, potentially due to difficulties of managing a creative process and the problems of creating cognitive boundaries
Discussion
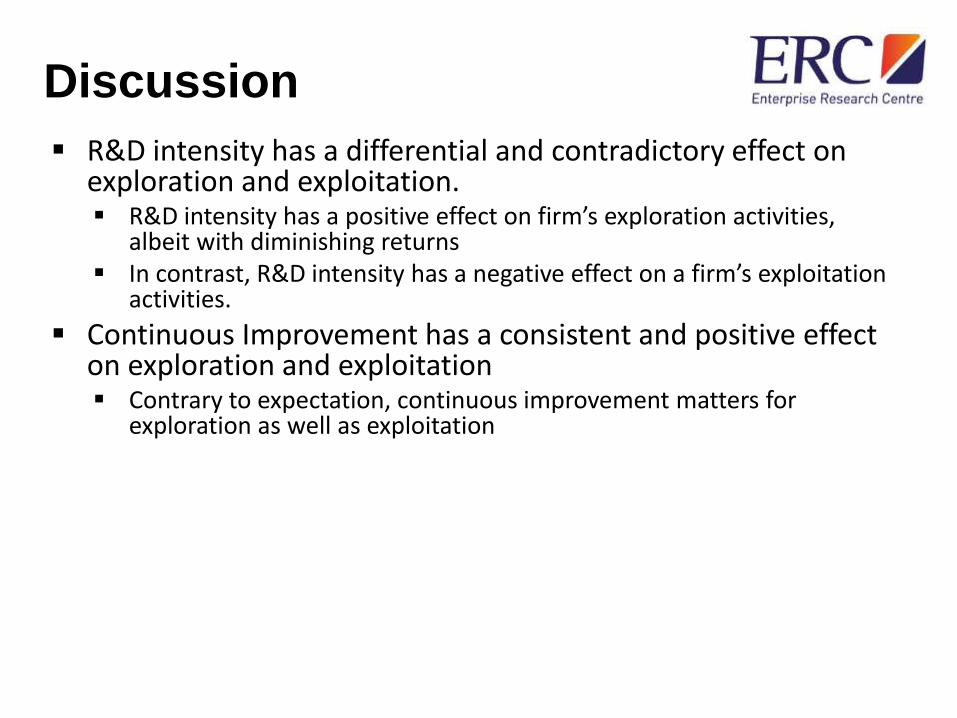
R&D intensity has a differential and contradictory effect on exploration and exploitation. R&D intensity has a positive effect on firm’s exploration activities,
albeit with diminishing returns In contrast, R&D intensity has a negative effect on a firm’s exploitation
activities.
Continuous Improvement has a consistent and positive effect on exploration and exploitation Contrary to expectation, continuous improvement matters for
exploration as well as exploitation
Discussion
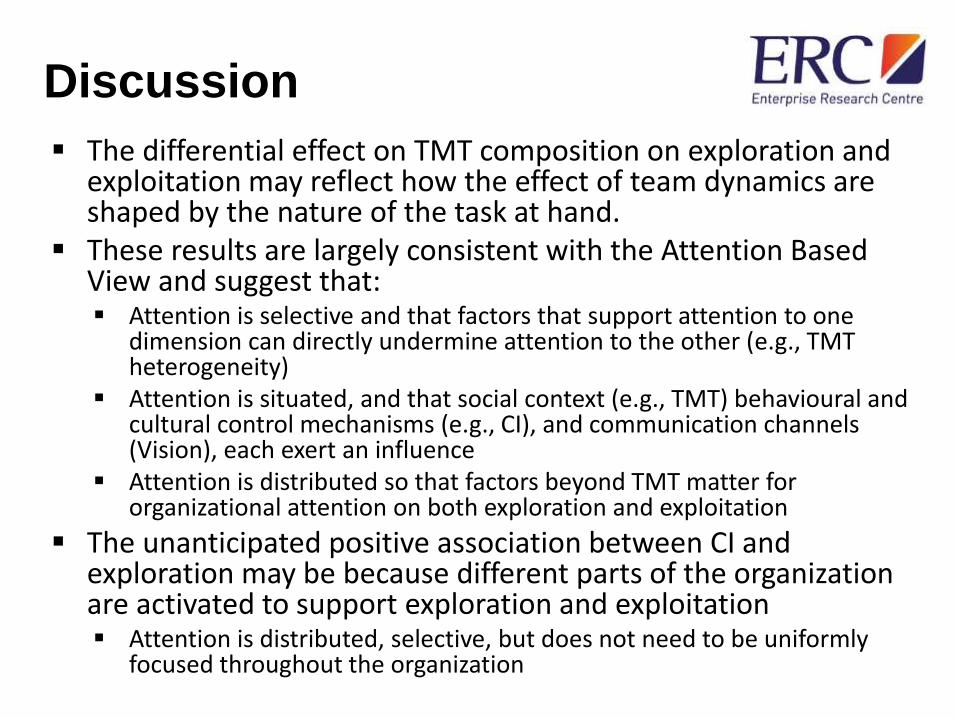
The differential effect on TMT composition on exploration and exploitation may reflect how the effect of team dynamics are shaped by the nature of the task at hand.
These results are largely consistent with the Attention Based View and suggest that: Attention is selective and that factors that support attention to one
dimension can directly undermine attention to the other (e.g., TMT heterogeneity)
Attention is situated, and that social context (e.g., TMT) behavioural and cultural control mechanisms (e.g., CI), and communication channels (Vision), each exert an influence
Attention is distributed so that factors beyond TMT matter for organizational attention on both exploration and exploitation
The unanticipated positive association between CI and exploration may be because different parts of the organization are activated to support exploration and exploitation Attention is distributed, selective, but does not need to be uniformly
focused throughout the organization
Limitations and future research
At present our work is cross sectional, which we need to link into Fame data to track the performance of our companies over time.
To avoid the practical “so what question”, however, we can link the determinants of ambidexterity into specific types of firm growth, albeit in a cross sectional manner.
Running path models with different growth outcomes as the final variable we find: Exploration is positively related to the % of sales generated from new
products and services and the % of sales generated from exports Exploitation is positively related to turnover growth (as measured by
CAGR).
Contributions and Conclusion
Our research demonstrates that decisions taken about achieving ambidexterity may simultaneously enhance one dimension of it whilst diminishing the other. Hence, firms need to be clear about the nature of the balance they
wish to achieve at any given point in time and given their particular internal and environmental conditions.
Optimal combination of exploration and exploitation will depend on the firms chosen growth path.
There is a need to balance investment in dynamic and substantive capabilities (Winter, 2003). Firms might not dedicate enough attention to further developing the
opportunities they have identified and explored.
Overall, problems in achieving ambidexterity may relate to different antecedents of its key components. These are difficult to resolve in the context of SMEs.

THANK YOU – QUESTONS?
27
DATA AND METHOD APPENDIX
28
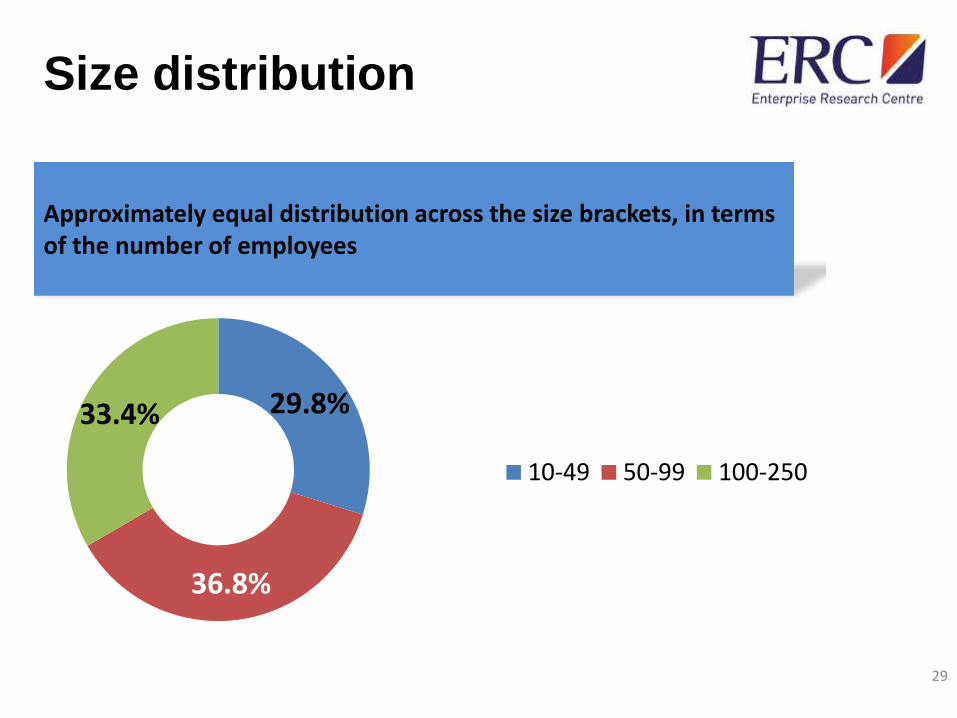
Size distribution
29
29.8%
36.8%
33.4%
10-49 50-99 100-250
Approximately equal distribution across the size brackets, in terms of the number of employees
Geographical distribution
88.8%
4.0% 7.3%
89.6%
3.6% 6.8%
0.0%
10.0%
20.0%
30.0%
40.0%
50.0%
60.0%
70.0%
80.0%
90.0%
100.0%
England Wales Scotland
Population Survey
Geographical distribution of the sample closely resembles that of the population (NI excluded)
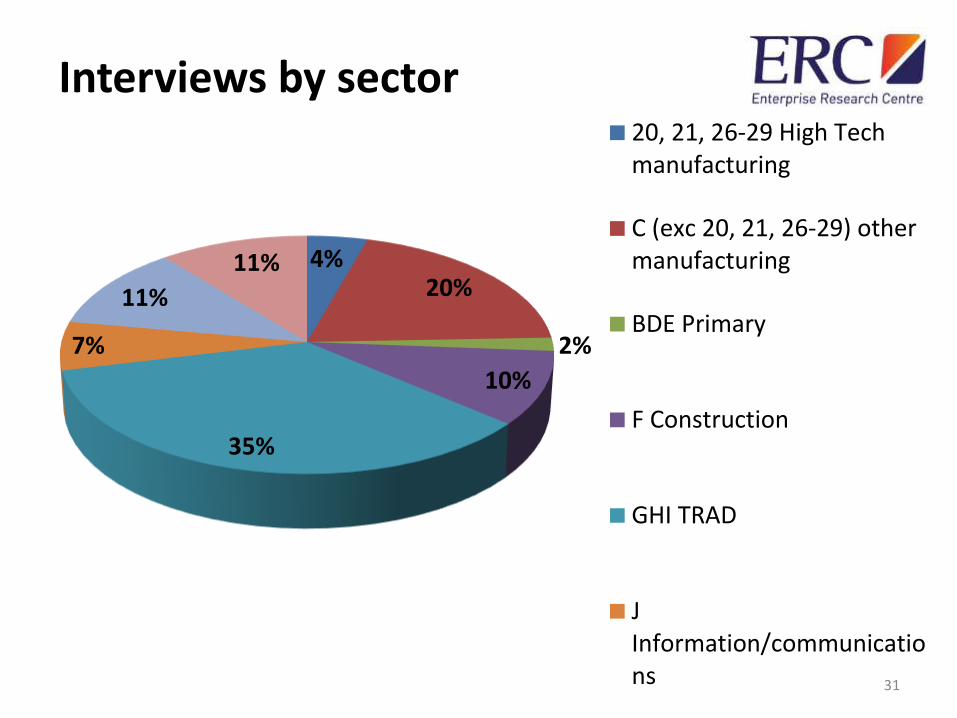
Interviews by sector
31
4%20%
2%
10%
35%
7%
11%
11%
20, 21, 26-29 High Techmanufacturing
C (exc 20, 21, 26-29) othermanufacturing
BDE Primary
F Construction
GHI TRAD
JInformation/communications
3%
1%
6%
19%
11%
13%4%
2%
25%
6%
10%
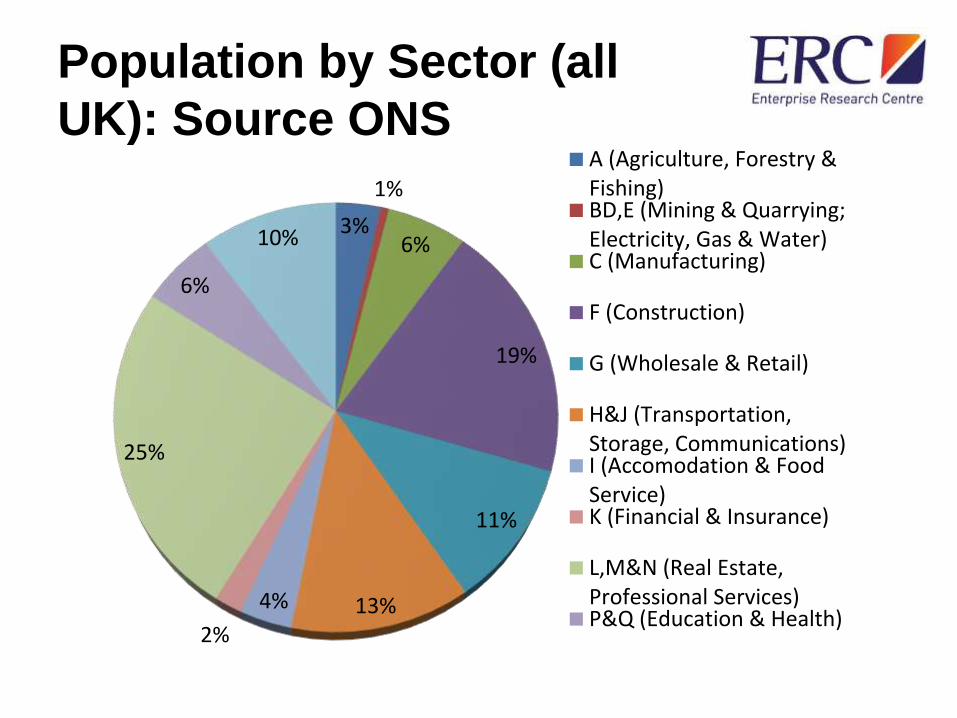
A (Agriculture, Forestry &Fishing)BD,E (Mining & Quarrying;Electricity, Gas & Water)C (Manufacturing)
F (Construction)
G (Wholesale & Retail)
H&J (Transportation,Storage, Communications)I (Accomodation & FoodService)K (Financial & Insurance)
L,M&N (Real Estate,Professional Services)P&Q (Education & Health)
Population by Sector (all
UK): Source ONS
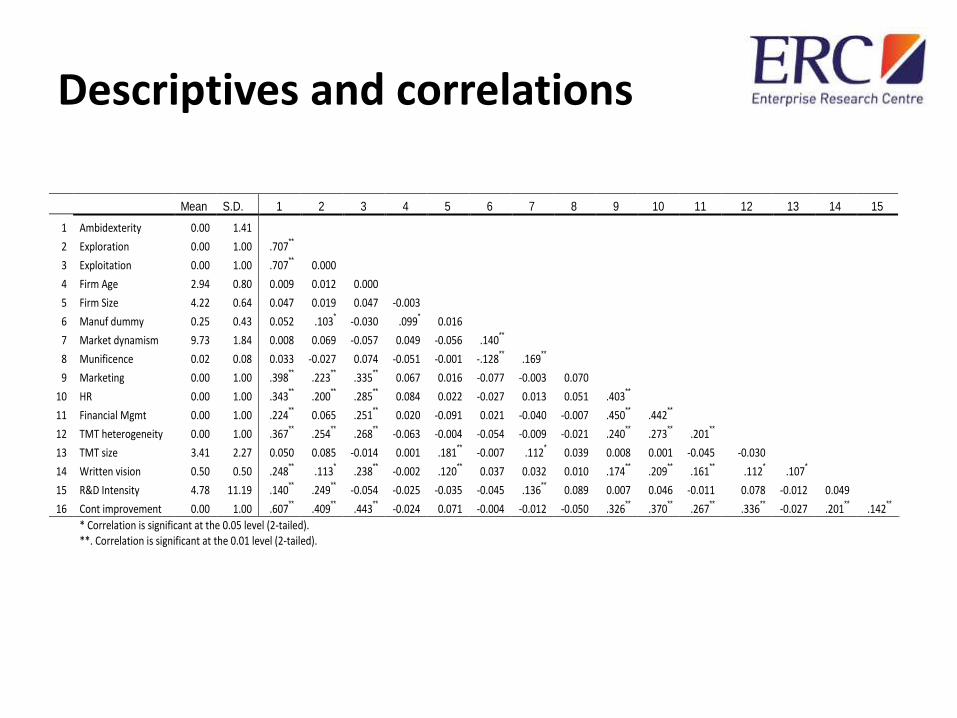
Descriptives and correlations
Mean S.D. 1 2 3 4 5 6 7 8 9 10 11 12 13 14 15
1 Ambidexterity 0.00 1.41
2 Exploration 0.00 1.00 .707**
3 Exploitation 0.00 1.00 .707**
0.000
4 Firm Age 2.94 0.80 0.009 0.012 0.000
5 Firm Size 4.22 0.64 0.047 0.019 0.047 -0.003
6 Manuf dummy 0.25 0.43 0.052 .103* -0.030 .099
* 0.016
7 Market dynamism 9.73 1.84 0.008 0.069 -0.057 0.049 -0.056 .140**
8 Munificence 0.02 0.08 0.033 -0.027 0.074 -0.051 -0.001 -.128**
.169**
9 Marketing 0.00 1.00 .398**
.223**
.335**
0.067 0.016 -0.077 -0.003 0.070
10 HR 0.00 1.00 .343**
.200**
.285**
0.084 0.022 -0.027 0.013 0.051 .403**
11 Financial Mgmt 0.00 1.00 .224**
0.065 .251**
0.020 -0.091 0.021 -0.040 -0.007 .450**
.442**
12 TMT heterogeneity 0.00 1.00 .367**
.254**
.268**
-0.063 -0.004 -0.054 -0.009 -0.021 .240**
.273**
.201**
13 TMT size 3.41 2.27 0.050 0.085 -0.014 0.001 .181**
-0.007 .112* 0.039 0.008 0.001 -0.045 -0.030
14 Written vision 0.50 0.50 .248**
.113* .238
** -0.002 .120
** 0.037 0.032 0.010 .174
** .209
** .161
** .112
* .107
*
15 R&D Intensity 4.78 11.19 .140**
.249**
-0.054 -0.025 -0.035 -0.045 .136**
0.089 0.007 0.046 -0.011 0.078 -0.012 0.049
16 Cont improvement 0.00 1.00 .607**
.409**
.443**
-0.024 0.071 -0.004 -0.012 -0.050 .326**
.370**
.267**
.336**
-0.027 .201**
.142**
* Correlation is significant at the 0.05 level (2-tailed). **. Correlation is significant at the 0.01 level (2-tailed).


![Koryak Texts - Bogoras, Waldemar [1917]](https://img.dokumen.tips/doc/110x75/544e17e9b1af9fe86e8b4c76/koryak-texts-bogoras-waldemar-1917.jpg)