Embed Size (px)
Citation preview

LIVINGSTON COLLEGE BOOKSTORELIVINGSTON COLLEGE BOOKSTORE
CUSTOMER SATISFACTION SURVEYCUSTOMER SATISFACTION SURVEY

STATEMENT of the PROBLEMSTATEMENT of the PROBLEM
❂ In order to better serve the needs of our MBA In order to better serve the needs of our MBA students, we have asked them to rate their students, we have asked them to rate their satisfaction with the Livingston College satisfaction with the Livingston College bookstore. Their feedback will help us make a bookstore. Their feedback will help us make a visit to this bookstore a more satisfying visit to this bookstore a more satisfying experience.experience.

CATEGORIZATION of CRITICAL INCIDENTSCATEGORIZATION of CRITICAL INCIDENTS
The hours of the Livingston Bookstore are accommodating. There is enough staff on hand to assist in locating books.The bookstore is easy to locate. The staff is knowledgeable in the locations of the books.There is ample parking for the bookstore. The line at the register moved quickly.The textbooks are easy to locate. Enough registers were open to accommodate the number of customers.My books are always in stock. I was pleased with my overall Livingston Bookstore experience.
The new textbooks are reasonably priced.The used textbooks are reasonably priced.The used textbooks are in good condition.The used book buyback price is fair.The book prices are competitive with other stores / online retailors.
Service - the degree to which the bookstore staff
reacts promptly to the customer.
Convenience - degree to which the bookstore is
accessible to the students.
Pricing - degree to which the pricing of the books meet the expectations of the customer.
Quality Dimension of Overall Student Satisfaction of the
Livingston Bookstore

SURVEY RESULTSSURVEY RESULTS
Part II. A.Data Collection
Respondent # #1 #2 #3 #4 #5 #6 #7 #8 #9 #10 #11 #12 #13 #14 #15Mean 2.48 4.13 2.78 3.05 3.10 1.50 1.92 3.64 2.25 2.00 3.33 4.28 3.75 3.50 3.21
Median 2.00 4.00 3.00 3.00 3.00 1.00 2.00 4.00 2.50 2.00 3.00 5.00 4.00 3.00 3.00Mode 2.00 4.00 2.00 4.00 4.00 1.00 1.00 4.00 3.00 2.00 4.00 5.00 4.00 3.00 3.00
St. Dev. 1.11 0.72 1.07 1.13 1.03 0.68 0.96 1.18 1.14 0.79 1.14 0.92 0.93 1.04 0.96C. V. 44.81 17.52 38.70 37.09 33.32 45.29 49.74 32.43 50.49 39.74 34.32 21.40 24.71 29.65 30.00
Minimum 1.00 2.00 1.00 1.00 1.00 1.00 1.00 1.00 1.00 1.00 1.00 2.00 1.00 1.00 1.00Maximum 4.00 5.00 5.00 5.00 5.00 4.00 4.00 5.00 5.00 3.00 5.00 5.00 5.00 5.00 5.00
Summary Template for Satisfaction (Aggregation) Items

GRAPH of AVERAGES for the CRITICAL GRAPH of AVERAGES for the CRITICAL INCIDENTSINCIDENTS
MEAN of the CRITICAL INCIDENTS
0.00
0.50
1.00
1.50
2.00
2.50
3.00
3.50
4.00
4.50
1 2 3 4 5 6 7 8 9 10 11 12 13 14 15
Questions
Me
an

CORRELATION MATRIXCORRELATION MATRIX
#1 #2 #3 #4 #5 #6 #7 #8 #9 #10 #11 #12 #13 #14 #15#1 1.000#2 -0.044 1.000#3 0.178 0.268 1.000#4 -0.101 0.149 0.284 1.000#5 -0.043 0.189 0.067 0.237 1.000#6 0.391 0.026 0.158 0.100 0.402 1.000#7 0.257 -0.061 -0.148 -0.140 0.245 0.465 1.000#8 -0.143 -0.098 -0.033 0.002 0.222 0.234 -0.025 1.000#9 0.082 -0.100 -0.265 -0.070 0.204 0.198 0.107 0.274 1.000#10 0.325 -0.226 0.031 0.087 0.032 0.097 0.173 -0.028 0.095 1.000#11 0.159 -0.019 0.145 0.504 0.015 0.149 -0.168 -0.019 -0.317 0.230 1.000#12 0.005 0.115 -0.059 0.207 -0.051 -0.183 -0.457 0.066 -0.260 0.137 0.330 1.000#13 -0.156 0.010 0.071 0.110 -0.268 -0.326 -0.358 0.053 -0.056 0.106 -0.212 0.523 1.000#14 -0.056 -0.051 0.081 0.371 0.096 0.036 0.070 -0.054 0.329 0.253 -0.054 0.065 0.427 1.000#15 0.365 0.277 0.302 0.227 0.403 0.318 0.159 0.222 0.218 0.139 -0.008 0.212 0.110 0.318 1.000

HYPOTHESIS TESTHYPOTHESIS TESTQuestions 12 and 13Questions 12 and 13
Ho: Correlation between questions 12 ("The staff is knowledgeable in the locations of thebooks") and 13 ("The line at the register moved quickly") is equal to zero.HA: Correlation between questions 12 ("The staff is knowledgeable in the locations of the books") and 13 ("The line at the register moved quickly") is not equal to zero.
alpha = 0.05df = 38
t = 3.78tcrit = 2.02
If t > 2.02 or t < -2.02, Reject Ho.
Decision: Reject Ho. There is evidence of a linear relationship at the 5% level of significance.

ONE VARIABLE REGRESSION ANALYSISONE VARIABLE REGRESSION ANALYSISOverall Satisfaction StatementOverall Satisfaction Statement
Regression Analysis
Regression StatisticsMultiple R 0.40R Square 0.16Adjusted R Square 0.14Standard Error 0.89Observations 38.00
ANOVAdf SS MS F Significance F
Regression 1 5.56 5.56 6.96 0.01Residual 36 28.75 0.80Total 37 34.32
Coefficients Standard Error t Stat P-value Lower 95% Upper 95%Intercept 2.02 0.47 4.26 0.00 1.06 2.98#5 - "My books are in stock" 0.38 0.14 2.64 0.01 0.09 0.67
ONE VARIABLE REGRESSION ANALYSISONE VARIABLE REGRESSION ANALYSISOverall Satisfaction Statement (cont.)Overall Satisfaction Statement (cont.)
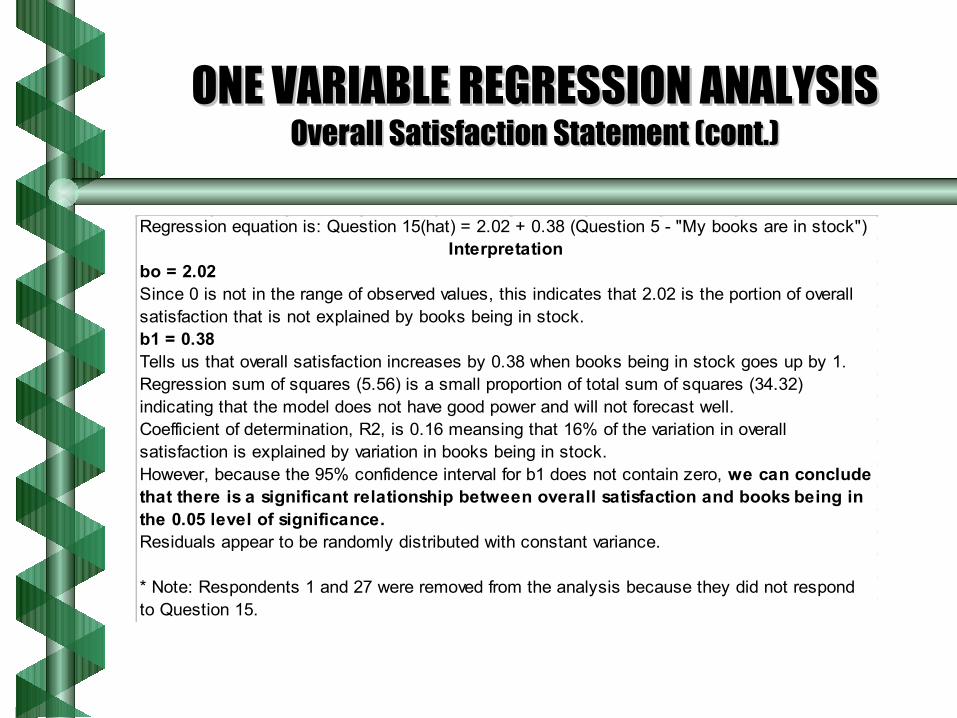
* Note: Respondents 1 and 27 were removed from the analysis because they did not respond to Question 15.
Coefficient of determination, R2, is 0.16 meansing that 16% of the variation in overall
Regression equation is: Question 15(hat) = 2.02 + 0.38 (Question 5 - "My books are in stock")
bo = 2.02Since 0 is not in the range of observed values, this indicates that 2.02 is the portion of overall
Tells us that overall satisfaction increases by 0.38 when books being in stock goes up by 1.b1 = 0.38
Interpretation
Residuals appear to be randomly distributed with constant variance.
satisfaction is explained by variation in books being in stock.However, because the 95% confidence interval for b1 does not contain zero, we can conclude
the 0.05 level of significance.
satisfaction that is not explained by books being in stock.
indicating that the model does not have good power and will not forecast well.
that there is a significant relationship between overall satisfaction and books being in
Regression sum of squares (5.56) is a small proportion of total sum of squares (34.32)

ANOVAANOVAPrices of new textbooks and genderPrices of new textbooks and gender
Ho: μF = μMFemale Male HA: μF ≠ μM
1.00 1.002.00 1.00 alpha = 0.051.00 1.002.00 2.00 Anova: Single Factor2.00 1.001.00 2.00 SUMMARY1.00 1.00 Groups Count Sum Average Variance1.00 2.00 Female 16 25 1.56 0.661.00 1.00 Male 24 35 1.46 0.352.00 1.002.00 2.001.00 3.00 ANOVA4.00 1.00 Source of Variation SS df MS F P-value F crit1.00 1.00 Between Groups 0.10 1 0.10 0.22 0.64 4.101.00 1.00 Within Groups 17.90 38 0.472.00 1.00
1.00 Total 18.00 392.001.00 Decision: Because F < Fcrit, we do not reject Ho.1.00 There is not a significant difference between population means at the 0.05 2.00 level of significance.2.00 Men and women both feel that the new textbooks are not reasonably 2.00 priced.2.00
Question 6: The new textbooks are reasonably priced.
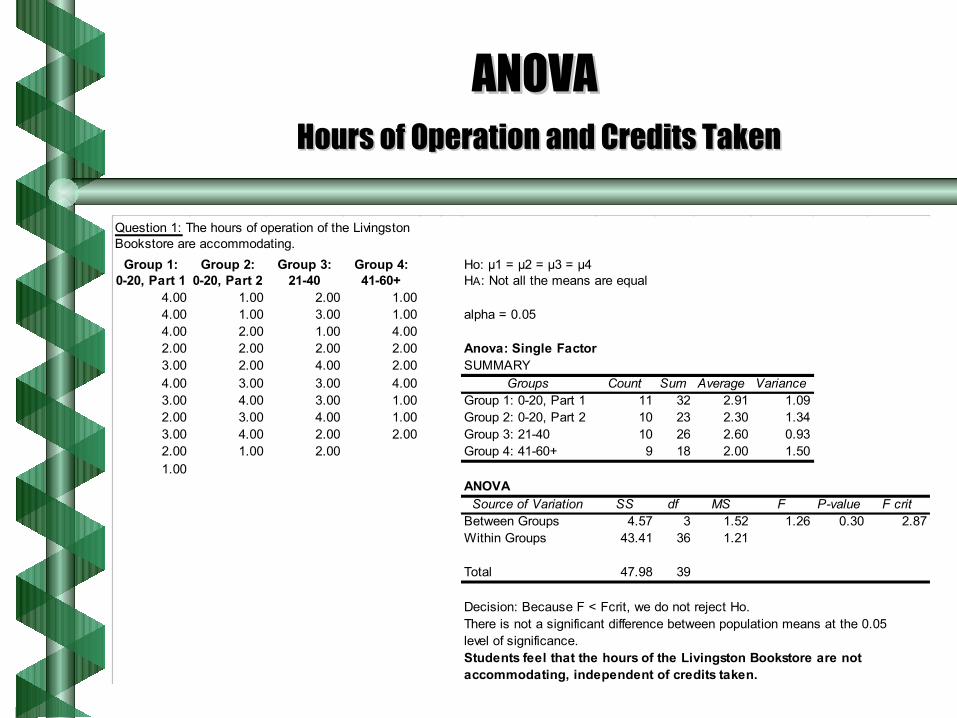
ANOVAANOVA Hours of Operation and Credits TakenHours of Operation and Credits Taken
Group 1: 0-20, Part 1
Group 2: 0-20, Part 2
Group 3:21-40
Group 4: 41-60+
4.00 1.00 2.00 1.004.00 1.00 3.00 1.00 alpha = 0.054.00 2.00 1.00 4.002.00 2.00 2.00 2.00 Anova: Single Factor3.00 2.00 4.00 2.00 SUMMARY4.00 3.00 3.00 4.00 Groups Count Sum Average Variance3.00 4.00 3.00 1.00 Group 1: 0-20, Part 1 11 32 2.91 1.092.00 3.00 4.00 1.00 Group 2: 0-20, Part 2 10 23 2.30 1.343.00 4.00 2.00 2.00 Group 3: 21-40 10 26 2.60 0.932.00 1.00 2.00 Group 4: 41-60+ 9 18 2.00 1.501.00
ANOVASource of Variation SS df MS F P-value F crit
Between Groups 4.57 3 1.52 1.26 0.30 2.87Within Groups 43.41 36 1.21
Total 47.98 39
Decision: Because F < Fcrit, we do not reject Ho.There is not a significant difference between population means at the 0.05 level of significance.Students feel that the hours of the Livingston Bookstore are not accommodating, independent of credits taken.
Ho: μ1 = μ2 = μ3 = μ4HA: Not all the means are equal
Question 1: The hours of operation of the Livingston Bookstore are accommodating.

RECOMMENDATIONSRECOMMENDATIONS
❂ Extend the hours of operation to accommodate part-time Extend the hours of operation to accommodate part-time studentsstudents
❂ Restructure the organization of books in the storeRestructure the organization of books in the store
❂ Ensure books are in stockEnsure books are in stock
❂ Investigate possibility of adding more parking spacesInvestigate possibility of adding more parking spaces

NEXT STEPSNEXT STEPS
❂ Expand survey to broader audience (undergraduates, Expand survey to broader audience (undergraduates, faculty members etc) to collect more datafaculty members etc) to collect more data
❂ Become educated on the operational cost structure of the Become educated on the operational cost structure of the Livingston bookstore to identify price reduction Livingston bookstore to identify price reduction opportunitiesopportunities

APPENDIX AAPPENDIX AHYPOTHESIS TESTHYPOTHESIS TEST
Questions 12 and 13 Questions 12 and 13
Scatter Plot for Hypothesis Test b/t Critical Incidents 12 and 13
0.00
1.00
2.00
3.00
4.00
5.00
6.00
0.00 1.00 2.00 3.00 4.00 5.00 6.00
Question 12
Qu
es
tio
n 1
3
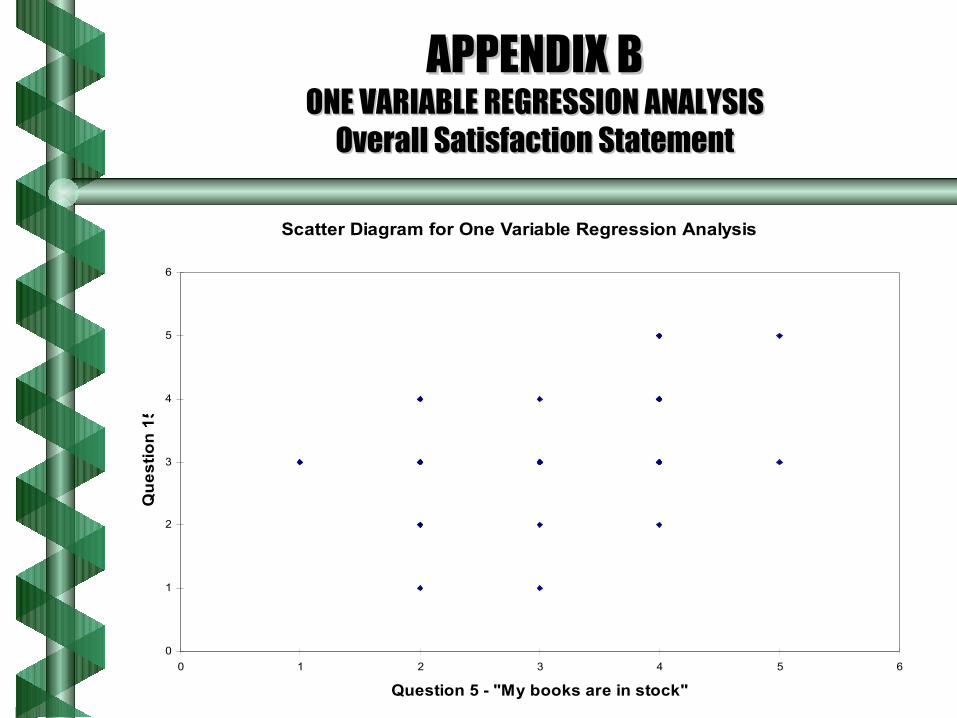
APPENDIX BAPPENDIX BONE VARIABLE REGRESSION ANALYSISONE VARIABLE REGRESSION ANALYSIS
Overall Satisfaction StatementOverall Satisfaction Statement
Scatter Diagram for One Variable Regression Analysis
0
1
2
3
4
5
6
0 1 2 3 4 5 6
Question 5 - "My books are in stock"
Qu
es
tio
n 1
5
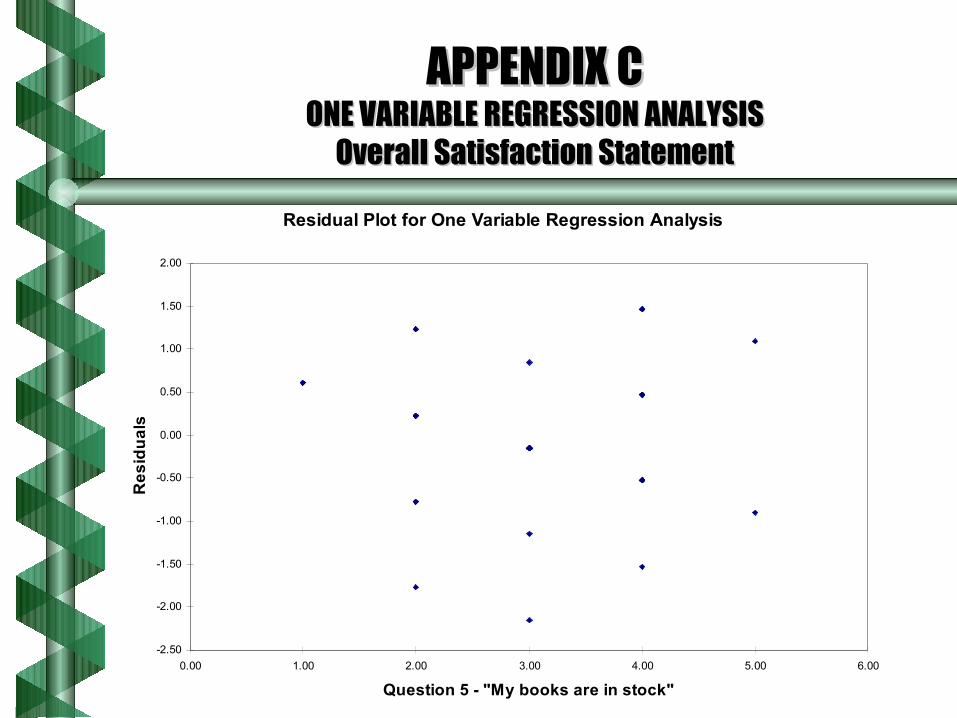
APPENDIX CAPPENDIX CONE VARIABLE REGRESSION ANALYSISONE VARIABLE REGRESSION ANALYSIS
Overall Satisfaction StatementOverall Satisfaction Statement
Residual Plot for One Variable Regression Analysis
-2.50
-2.00
-1.50
-1.00
-0.50
0.00
0.50
1.00
1.50
2.00
0.00 1.00 2.00 3.00 4.00 5.00 6.00
Question 5 - "My books are in stock"
Re
sid
ua
ls

APPENDIX DAPPENDIX DSURVEY RESULTSSURVEY RESULTS
First 20 respondentsFirst 20 respondents
Part II. A.
Data Collection
Respondent # Sex Status Credits #1 #2 #3 #4 #5 #6 #7 #8 #9 #10 #11 #12 #13 #14 #151 F PT 0-20 4.00 5.00 5.00 2.00 2.00 1.00 1.00 5.00 1.00 2.00 4.00 5.00 5.00 2.002 F PT 0-20 4.00 3.00 2.00 3.00 3.00 2.00 3.00 3.00 3.00 3.00 3.00 4.00 4.00 4.00 3.003 M PT 21-40 2.00 5.00 2.00 4.00 4.00 1.00 1.00 4.00 1.00 1.00 3.00 5.00 4.00 3.00 3.004 M PT 0-20 4.00 3.00 2.00 1.00 1.00 1.00 1.00 3.00 3.00 2.00 2.00 5.00 4.00 3.00 3.005 M PT 0-20 2.00 4.00 3.00 5.00 2.00 1.00 1.00 1.00 1.00 2.00 5.00 5.00 5.00 5.00 3.006 M PT 21-40 3.00 5.00 2.00 3.00 3.00 2.00 2.00 5.00 2.00 3.00 5.00 5.00 3.00 3.00 3.007 F PT 21-40 1.00 4.00 1.00 1.00 2.00 1.00 4.00 1.00 1.00 1.00 1.00 4.00 4.00 3.00 1.008 M PT 0-20 3.00 3.00 2.00 3.00 2.00 1.00 3.00 3.00 3.00 3.00 4.00 4.00 3.00 2.00 3.009 M PT 0-20 4.00 4.00 3.00 3.00 3.00 2.00 3.00 3.00 3.00 4.00 3.00 3.00 4.00 3.0010 M PT 0-20 3.00 5.00 2.00 4.00 4.00 1.00 1.00 2.00 3.00 3.00 4.00 5.00 4.00 4.00 4.0011 M PT 21-40 2.00 4.00 4.00 4.00 4.00 2.00 2.00 5.00 2.00 2.00 5.00 5.00 5.00 5.0012 F PT 21-40 4.00 4.00 4.00 4.00 4.00 2.00 3.00 4.00 3.00 2.00 3.00 3.00 3.00 3.00 3.0013 F PT 0-20 2.00 4.00 4.00 3.00 3.00 2.00 2.00 4.00 4.00 4.00 4.00 4.00 3.0014 F PT 0-20 3.00 4.00 2.00 2.00 4.00 1.00 2.00 4.00 3.00 3.00 2.00 5.00 5.00 5.00 4.0015 M PT 0-20 2.00 4.00 2.00 3.00 2.00 1.00 1.00 5.00 1.00 3.00 5.00 5.00 3.00 4.0016 M PT 0-20 1.00 5.00 3.00 4.00 2.00 1.00 3.00 4.00 2.00 4.00 5.00 4.00 4.00 3.0017 M PT 21-40 3.00 4.00 3.00 4.00 3.00 2.00 2.00 4.00 2.00 3.00 3.00 4.00 3.00 3.00 3.0018 M PT 21-40 3.00 4.00 1.00 2.00 4.00 3.00 3.00 4.00 3.00 2.00 4.00 5.00 3.00 3.00 3.0019 M PT 41-60 1.00 5.00 2.00 4.00 2.00 1.00 2.00 5.00 5.00 1.00 2.00 3.00 4.00 5.00 4.0020 M PT 0-20 1.00 4.00 3.00 4.00 4.00 1.00 1.00 4.00 1.00 1.00 4.00 5.00 3.00 2.00 3.00
Summary Template for Critical Incidents (Statements) and Satisfaction (Aggregation) ItemsTotal and by Each Demographic

APPENDIX EAPPENDIX ESURVEY RESULTSSURVEY RESULTS
Last 20 respondentsLast 20 respondents
Part II. A.
Data Collection
Respondent # Sex Status Credits #1 #2 #3 #4 #5 #6 #7 #8 #9 #10 #11 #12 #13 #14 #1521 M PT 41-60 1.00 2.00 2.00 4.00 4.00 1.00 1.00 5.00 4.00 2.00 5.00 4.00 3.00 5.00 2.0022 M PT 0-20 1.00 4.00 2.00 2.00 3.00 1.00 1.00 4.00 3.00 1.00 2.00 4.00 4.00 4.00 1.0023 M PT 0-20 2.00 5.00 3.00 4.00 2.00 1.00 1.00 3.00 1.00 1.00 4.00 4.00 4.00 3.00 2.0024 M PT 0-20 2.00 4.00 5.00 4.00 4.00 2.00 2.00 5.00 2.00 2.00 5.00 5.00 5.00 5.0025 M PT 21-40 4.00 4.00 5.00 5.00 2.00 1.00 1.00 1.00 1.00 2.00 5.00 5.00 5.00 5.00 3.0026 M PT 0-20 2.00 5.00 3.00 4.00 4.00 1.00 1.00 2.00 3.00 3.00 4.00 5.00 4.00 4.00 4.0027 F PT 21-40 2.00 3.00 2.00 2.00 2.00 1.00 1.00 5.00 1.00 2.00 4.00 5.00 5.00 2.0028 M PT 0-20 3.00 4.00 4.00 3.00 3.00 2.00 3.00 2.00 1.00 3.00 3.00 3.00 3.00 4.00 4.0029 F PT 0-20 4.00 4.00 2.00 1.00 1.00 1.00 1.00 3.00 3.00 2.00 2.00 5.00 4.00 3.00 3.0030 F PT 21-40 2.00 5.00 3.00 2.00 4.00 1.00 2.00 4.00 3.00 3.00 2.00 5.00 5.00 5.00 4.0031 M PT 0-20 3.00 3.00 2.00 3.00 3.00 2.00 2.00 5.00 2.00 3.00 5.00 5.00 3.00 3.00 3.0032 F PT 41-60 4.00 5.00 4.00 2.00 4.00 2.00 3.00 3.00 1.00 1.00 5.00 1.00 3.00 5.0033 M PT 0-20 4.00 4.00 1.00 3.00 5.00 2.00 4.00 4.00 3.00 1.00 2.00 3.00 3.00 4.00 5.0034 F PT 0-20 1.00 4.00 3.00 3.00 3.00 2.00 1.00 4.00 2.00 2.00 3.00 4.00 4.00 4.00 3.0035 M PT 41-60 2.00 4.00 2.00 5.00 4.00 2.00 3.00 5.00 1.00 3.00 5.00 5.00 4.00 4.00 3.0036 F PT 41-60 2.00 4.00 4.00 2.00 3.00 1.00 2.00 2.00 2.00 2.00 2.00 2.0037 F PT 41-60 4.00 5.00 4.00 4.00 4.00 4.00 2.00 4.00 4.00 1.00 4.00 4.00 3.00 3.00 4.0038 F PT 41-60 1.00 5.00 3.00 3.00 5.00 1.00 1.00 3.00 1.00 3.00 5.00 3.00 1.00 3.0039 F PT 41-60 1.00 4.00 2.00 2.00 2.00 1.00 1.00 3.00 1.00 1.00 3.00 3.00 3.00 3.00 2.0040 F PT 41-60 2.00 4.00 3.00 1.00 4.00 2.00 3.00 4.00 3.00 2.00 2.00 2.00 4.00 3.00 3.00
Summary Template for Critical Incidents (Statements) and Satisfaction (Aggregation) ItemsTotal and by Each Demographic

APPENDIX FAPPENDIX FTeam Member AssignmentsTeam Member Assignments
Team Name: GROUP 2
All work on this Assignment was done bythe following members of the team.
Print Last Name/First NameSignature
Description of Individual’s Contribution
KIM, SHIHO Data collectionNext stepsPowerPoint presentation
LEHMAN, ELEANOR A. Data collectionSurvey analysis
SHIMP, MELANY P. Data collectionNext stepsPowerPoint presentation
STOCKTON, TODD J. Survey questionsCategorization of critical incidentsData collection
ZILLUR REHMAN, SYED Data collectionRecommendations

APPENDIX GAPPENDIX GFinal SurveyFinal Survey

APPENDIX HAPPENDIX HVerbatimsVerbatims