Embed Size (px)
Citation preview

Cluster analysis of Finnish car retail and service business
operations strategy and innovation management
capabilities
Olli Rouvari, Pasi L. Porkka, Heli Aramo-Immonen* [email protected]
Tampere University of Technology, Pori Unit
Mikko Huhtala Autoalan Keskusliitto ry, Finnish Central Organization for Motor Trades and Repairs
RQ • This research was conducted in order to
explore the • strategic management of operations and • innovation capability in the Finnish car
retail and service business • The primary goal of the data analysis was to
find out whether there existed clusters among the respondents, which could help separate organizations with a good level of strategic management from those with a lower level
19/06/16 2
Research area
• Access to managers was facilitated via the Finnish Central Organization for Motor Trades and Repairs and covered all member companies (147 companies).
• This study gave a good overview of this industry in Finland.
• Of these companies, – 70 % had a turnover of between 5-50 M Eur and – 27% had a turnover of more than 50 M Eur.
• We obtained responses from 37 company managers at a response rate of 25.2%.
19/06/16 3
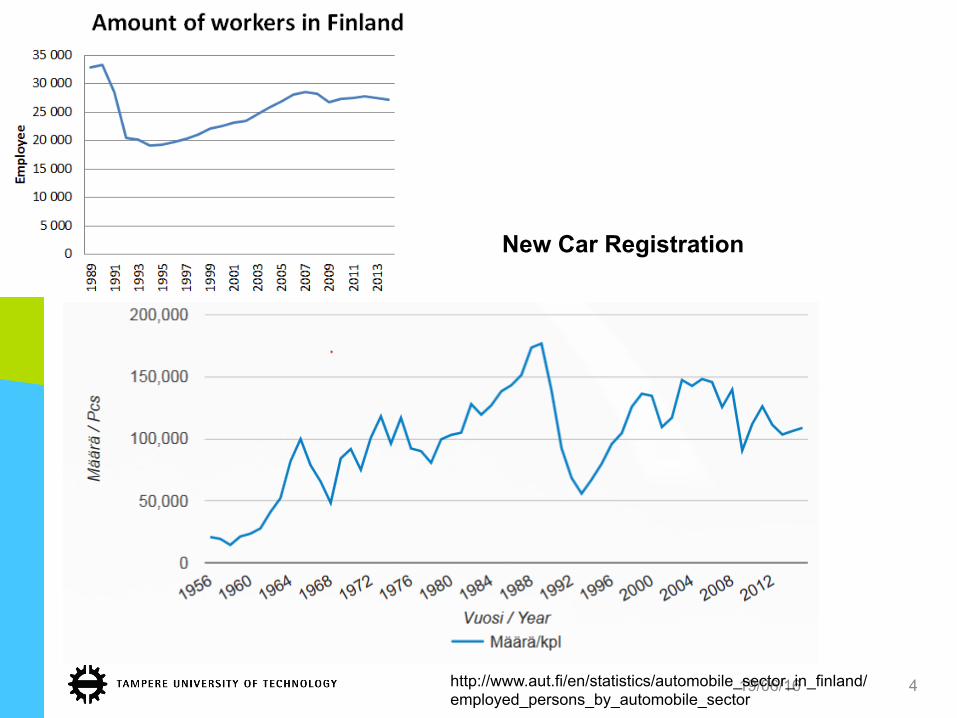
19/06/16 4 http://www.aut.fi/en/statistics/automobile_sector_in_finland/employed_persons_by_automobile_sector
New Car Registration

19/06/16 5
Car Taxes in Finland
http://www.aut.fi/en/statistics/taxation_and_car_prices/price_formation_of_new_passenger_car

Strategic management
• Competitive strategy (Porter, 1985) • Resource-based view (RBV) (Penrose, 1959;
Barney, 1991; Conner, 1991) • Knowledge-based view (KBV) (e.g. Kaplan
and Norton, 1992; Teece, 2002; Sveiby, 2001; Kong, 2008)
• Operative strategy analysis SWOT (Weirich, 1982)
19/06/16 6

Innovation management
• Knowledge creation fuels innovation (Takeuchi, 2013)
• Tidd and Bessant (2009) introduce four types of innovation: process, product/service, positioning and paradigm innovations.
19/06/16 7

Methodology
• Survey questionnaire of 110 questions • Conducted on the car retail and service
business in Finland • Among 147 CEOs and top managers. • Obtained responses from 37 company
managers • Response rate of 25.2% • Statistical analysis methods
19/06/16 8

Methods
• Cluster analysis with all 24 variables revealed no significant clustering among the data. → reduction of variables with factory analysis
• Exploratory factor analysis (EFA) was used for data reduction – The Kaiser-Meyr-Olkin (KMO) measure was 0.603. – We used Oblimin rotation with Kaiser Normalization – Scree test for deciding the number of factors – Five factors, with total variance explained 71,12%
19/06/16 9

Methods
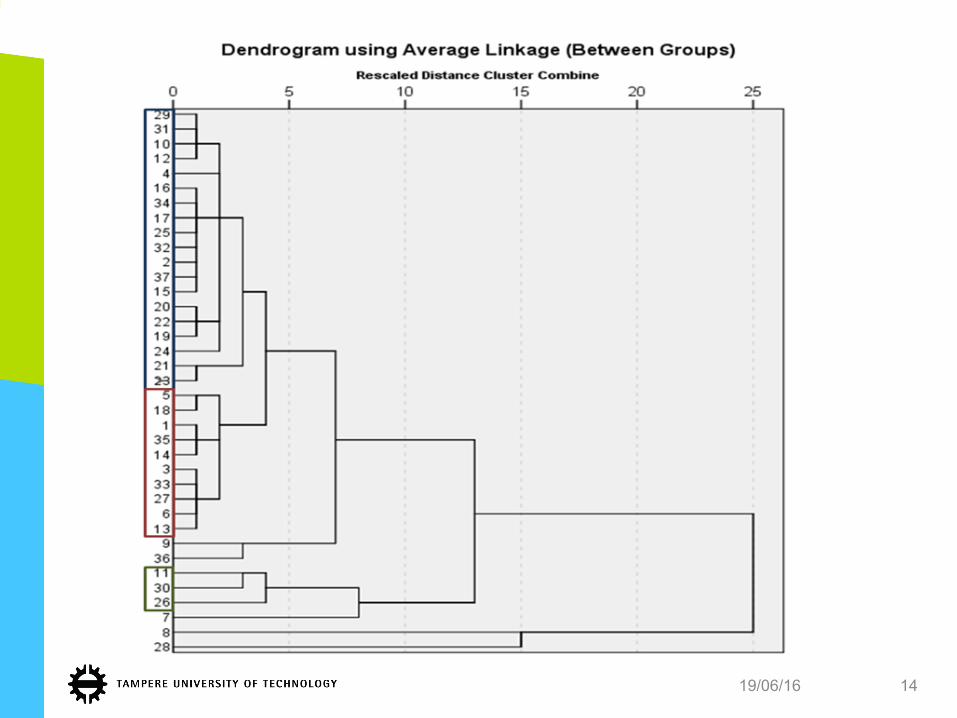
• Next we calculated values for each factor for each respondent with rotated factor loadings greater than 0.5
• We employed these five factors as variables and performed a cluster analysis.
19/06/16 10
Cluster #
7 Clusters
6 Clusters
5 Clusters
4 Clusters
3 Clusters
1 1 1 1 1 1 2 1 1 1 1 1 3 1 1 1 4 35 4 3 3 3 31 5 2 2 31 6 10 29
7 19
N = 37 37 37 37 37
Result
• The values in the cluster with 19 respondents were significantly higher in most statements and included differentiating factors.
• Therefore, one can identify the factors that the companies in the lower cluster should improve.
• This distinction into two major clusters with the use of 24 strategic statements also applied to 40 innovation statements.
19/06/16 11

Result
• When the answers to the latter were clustered accordingly, the differences between the clusters were statistically significant.
• This implies that there is a clear connection or correlation between strategic management and innovation management in the companies involved.
19/06/16 12

19/06/16 13
KMO and Bartlett's Test Structure Matrix KMO Measure of Sampling Adequacy .603
Factor
Bartlett´s test Appr. Chi-Square 688.354 1 2 3 4 5 of Sphericity df .276 V3 .962 Sig. .000 V4 .794 .500
V2 .664 .538 V1 .605 Total Variance Explained V5 .596 .528
Factor
Initial Eigenvalues V15
Total Var. %
Cum. % V16 .986
1 8.118 33.823 33.823 V17 .641 .601 2 3.514 14.641 48.465 V19 .534 3 2.268 9.450 57.915 V22 .926 4 1.788 7.451 65.366 V20 .755 5 1.524 6.350 71.715 V21 .737
V23 .731 -.613 V18 .563 .510 Factor Correlation Matrix V24 Factor 1 2 3 4 5 V12 -.907 1 1.000 .027 .174 -.266 .279 V13 -.905 2 .027 1.000 .212 .030 .149 V14 .563 -.730 3 .174 .212 1.000 -.278 .147 V11 -.713 4 -.266 .030 -.278 1.000 -.186 V7 -.546 5 .279 .149 .147 -.186 1.000 V9 .723 Extraction Method: Maximum Likelihood V8 -.600 .700 Rotation: Oblimin with Kaiser Normalization V10 .648 V6
Extraction: Maximum Likelihood Rotation: Oblimin with Kaiser Norm.
19/06/16 14

Conclusions
• The strategy was not communicated to all employees
• Attempts among managers to gain commitment from employees were not efficient
• Collaboration between companies would allow joint resource allocation, which would enable companies to focus on their core competencies
19/06/16 15

Further research areas
• Does strategic and innovative fit indicate smart social media use in a company?
19/06/16 16
http://www.slideshare.net/jjussila/does-strategic-and-innovative-fit-indicate-smart-social-media-use-in-a-company?qid=5c401802-6083-4997-bf2a-58ca015446c7&v=&b=&from_search=5
IFKAD 2016

Contact! Heli Aramo-Immonen *
[email protected] Tampere University of Technology
Pasi L. Porkka, Olli Rouvari
Tampere University of Technology, Pori Unit
Mikko Huhtala Autoalan Keskusliitto ry, Finnish Central Organization for Motor Trades and Repairs