Embed Size (px)
Citation preview

China – A Vital Trading Partner for the U.S. Plastics
Industry
Presented By:
Michael D. Taylor
Senior Director, International Affairs and Trade
Shenzhen Polymer Industry Association
Shenzhen, PRC
May 25, 2015
Agenda
Background on SPI
An Overview of the U.S. Plastics Industry
How Trade Impacts the Industry
The Sino-U.S. Plastics Industry Trade Situation
Q&A
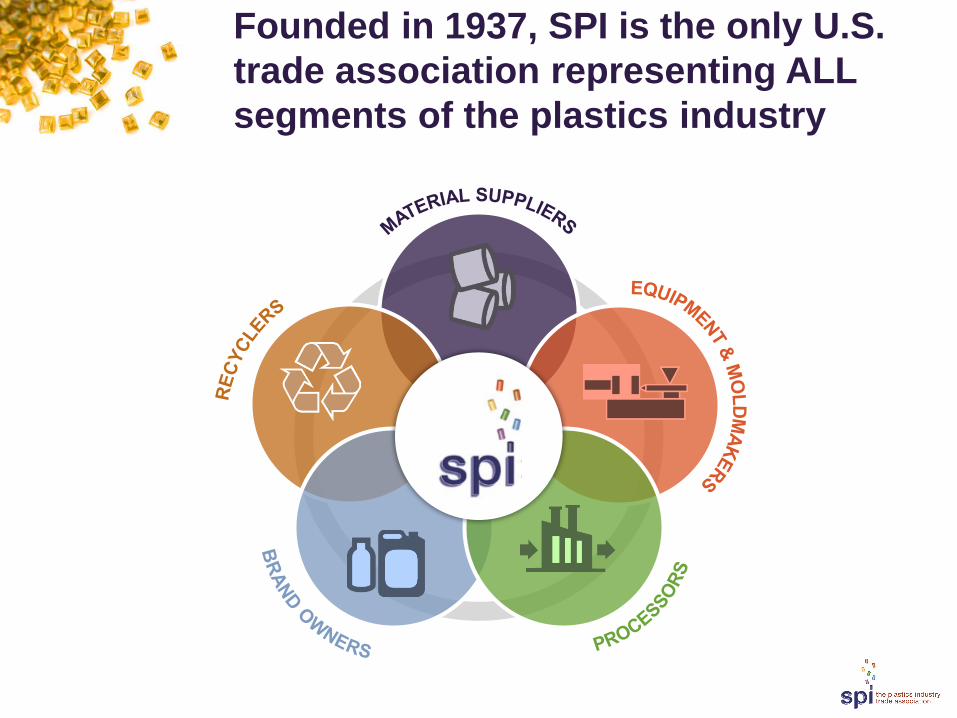
Founded in 1937, SPI is the only U.S.
trade association representing ALL
segments of the plastics industry

The U.S. Plastics Industry
In 2012…
• Shipped more than $373 billion
in goods
• Employed 892,000 people
• Operated 15,949 facilities in every
U.S. state
• Plastics manufacturers spent more than
$9.6 billion on new capital equipment
In 2013…
• 3rd largest industry in U.S.
• Record-breaking domestic demand
– Up 6.5% to $267 billion

Plastics have Historically Grown
Faster than all Manufacturing
• Plastics manufacturing
employment grew 0.1
percent per year since 1980
• The value of manufactured
shipments grew by 2.3
percent per year since 1980
• Productivity grew by 2.2
percent per year since 1980
Source: SPI “Size and Impact of the U.S. Plastics Industry” (2012)

U.S. Demand for Plastics sets
New High Level
$0
$50
$100
$150
$200
$250
$300
1994 1995 1996 1997 1998 1999 2000 2001 2002 2003 2004 2005 2006 2007 2008 2009 2010 2011 2012 2013
$ in b
illio
ns
Machinery Molds Plastic Products Resin
Apparent Consumption = Shipments + Imports – Exports
Source: SPI “Global Business Trends” (2014)
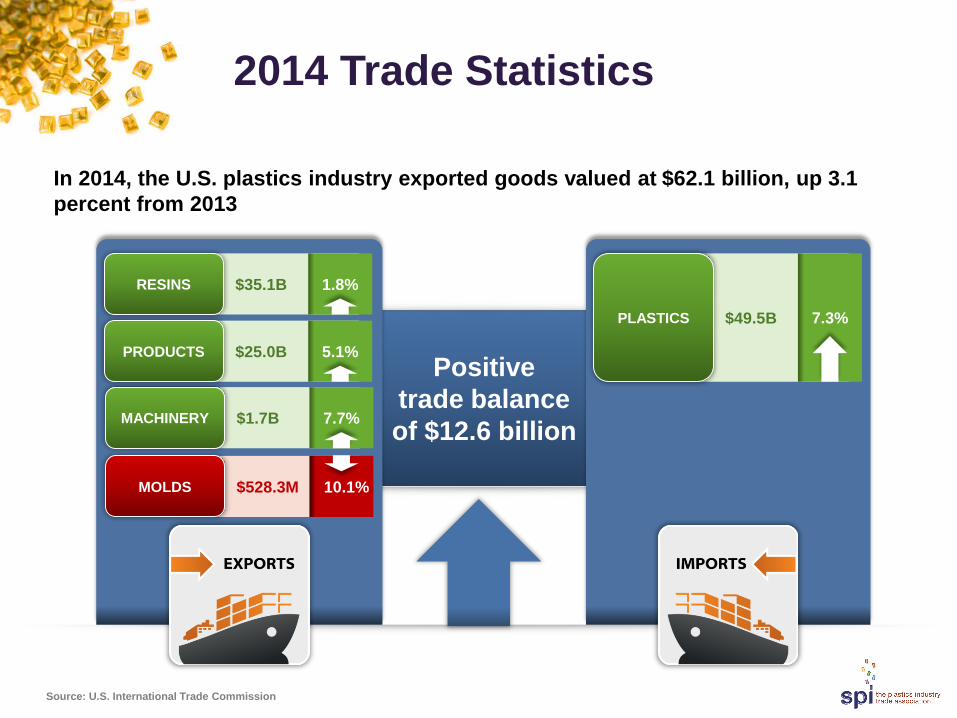
Positive
trade balance
of $12.6 billion
$49.5B PLASTICS 7.3%
2014 Trade Statistics
In 2014, the U.S. plastics industry exported goods valued at $62.1 billion, up 3.1
percent from 2013
$35.1B RESINS 1.8%
$25.0B PRODUCTS 5.1%
$528.3M MOLDS 10.1%
$1.7B MACHINERY 7.7%
Source: U.S. International Trade Commission

Top Industry Export Markets
$0
$5
$10
$15
$20
$25
$30
200
2
200
3
200
4
200
5
200
6
200
7
200
8
200
9
201
0
201
1
201
2
201
3
201
4
U.S
. $
Bill
ion
s
Mexico Canada China Belgium Brazil All Others
Top Plastics Industry
Export Markets 2014
All Others $23.5 billion
Mexico $15.8 billion
Canada $13.2 billion
China $5.2 billion
Belgium $2.4 billion
Brazil $2.1 billion
Total $62.1 billion

Changes in U.S. Plastics
Industry Exports
9.5%
3.0%
-8.9%
-3.8% -4.8% -2.5% -2.2%
-9.5%
0.6%
-11.5%
-0.03%
9.1%
0.4% 0.4%
12.0% 11.4%
-13.3%
14.2%
2.4% 1.9%
-5.8%
2.7%
5.9% 4.4%
7.4%
3.0%
-8.3%
3.6% 1.5%
5.8%
11.5% 9.6%
3.1%
-30%
-20%
-10%
0%
10%
20%
30%
40%
Mexico Canada China Belgium Brazil Japan SouthKorea
Germany UnitedKingdom
HongKong
World
2012 2013 2014
Changes in U.S. Plastics Industry Exports for the Top 10 Exports Markets 2012-2014
Source: U.S. International Trade Commission
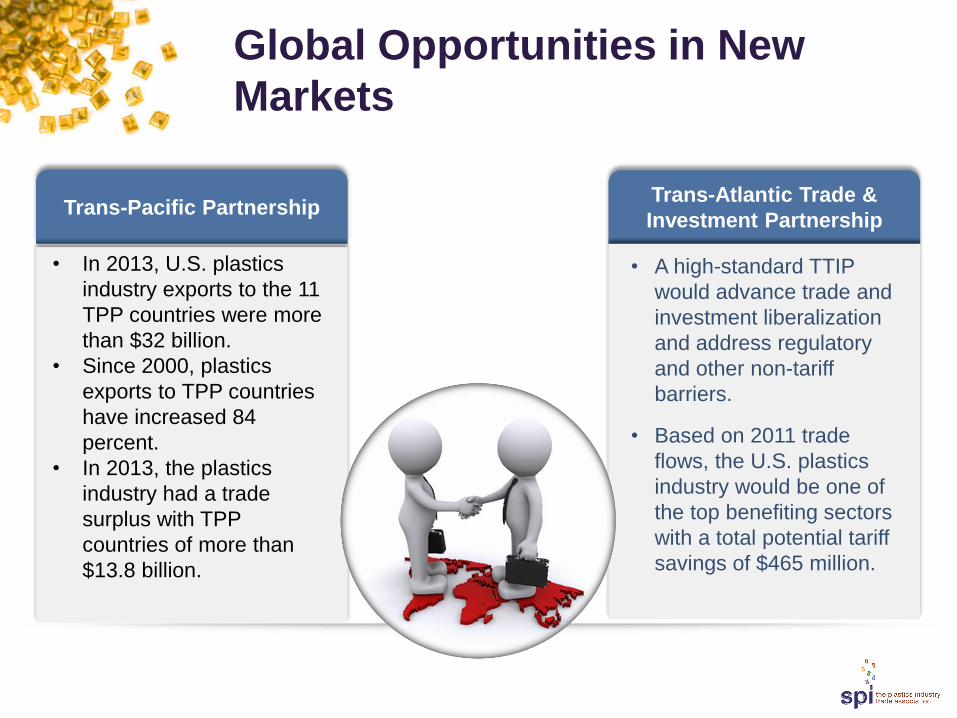
Trans-Pacific Partnership Trans-Atlantic Trade &
Investment Partnership
Global Opportunities in New
Markets
• In 2013, U.S. plastics
industry exports to the 11
TPP countries were more
than $32 billion.
• Since 2000, plastics
exports to TPP countries
have increased 84
percent.
• In 2013, the plastics
industry had a trade
surplus with TPP
countries of more than
$13.8 billion.
• A high-standard TTIP
would advance trade and
investment liberalization
and address regulatory
and other non-tariff
barriers.
• Based on 2011 trade
flows, the U.S. plastics
industry would be one of
the top benefiting sectors
with a total potential tariff
savings of $465 million.

U.S. Plastics Trade Balance
by Segment 2000-2014
Source: U.S. International Trade Commission
-10
-5
0
5
10
15
20
25
Resin Products Machinery Molds

U.S. Plastics Trade Balance with
FTA Countries by Segment
2000-2014
Source: U.S. International Trade Commission
-2
0
2
4
6
8
10
12
Resin Products Machinery Molds
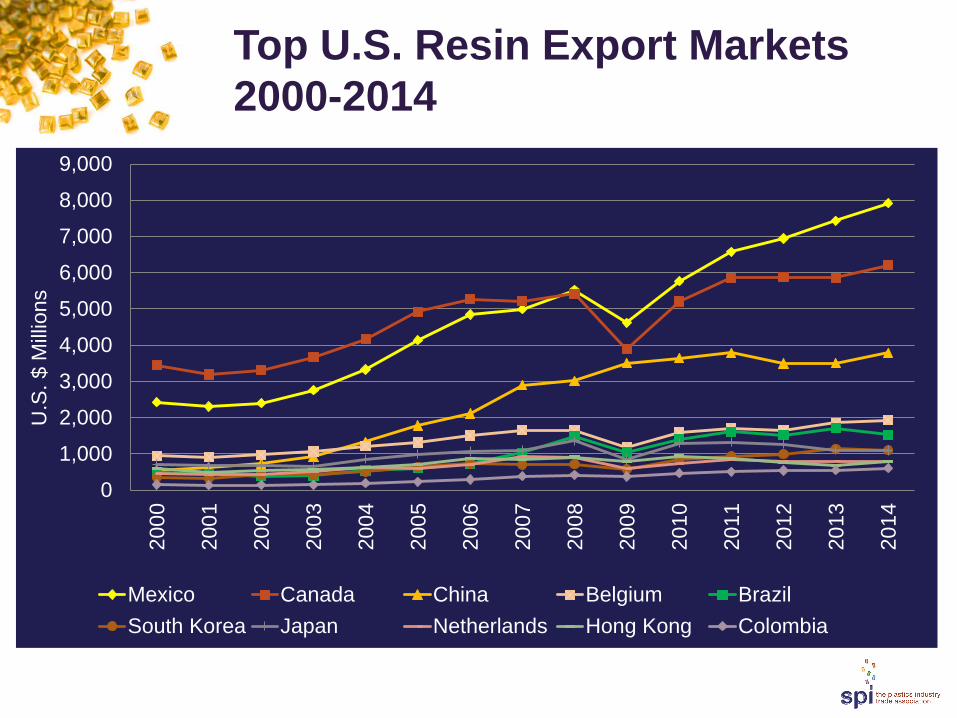
Top U.S. Resin Export Markets
2000-2014
0
1,000
2,000
3,000
4,000
5,000
6,000
7,000
8,000
9,000200
0
200
1
200
2
20
03
200
4
200
5
200
6
200
7
200
8
200
9
201
0
20
11
201
2
201
3
201
4
Mexico Canada China Belgium Brazil
South Korea Japan Netherlands Hong Kong Colombia
U.S
. $ M
illio
ns

Top U.S. Resin Export Markets
by Percentage 2014
17.7%
10.8%
5.5%
4.3%
3.1%
3.1%
2.3% 2.2% 1.7%
Canada China Belgium Brazil South Korea
Japan Netherlands Hong Kong Colombia All Others

Top U.S. Resin Import Markets
2000-2014
0
1,000
2,000
3,000
4,000
5,000
6,000
7,000200
0
200
1
200
2
20
03
200
4
200
5
200
6
200
7
200
8
200
9
201
0
20
11
201
2
201
3
201
4
Canada Germany Mexico Japan
China South Korea Taiwan Netherlands
United Kingdom France
U.S
. $ M
illio
ns

Top U.S. Resin Import Markets
by Percentage 2014
9.8%
7.9%
7.4%
5.8%
5.1%
2.5%
2.3%
2.2% 2.2%
Germany Mexico Japan China
South Korea Taiwan Netherlands United Kingdom
France All Others

Top U.S. Resin Import Markets
2000-2014
0
200
400
600
800
1,000
1,200
1,400
1,600200
0
200
1
200
2
20
03
200
4
200
5
200
6
200
7
200
8
200
9
201
0
20
11
201
2
201
3
201
4
Germany Mexico Japan
China South Korea Taiwan
Netherlands United Kingdom France
U.S
. $ M
illio
ns

U.S. Plastics Trade Balance
with China by Segment 2000-2014
Source: U.S. International Trade Commission
-12
-10
-8
-6
-4
-2
0
2
4
Resin Products Machinery Molds

U.S. Produced Goods
79.6% 84.4%
36.6%
54.7%
82.0%
0%
20%
40%
60%
80%
100%
Resins Products Machinery Molds Total Industry
% S
hare
U.S. Produced Goods Retain Significant Market Share in the Industry Segments
Source: SPI “Global Business Trends” (2014)

HTS Classification
• POLYACETALS, OTHER POLYETHERS AND EPOXIDE RESINS, IN PRIMARY FORMS; POLYCARBONATES, ALKYDS, POLYALLYL ESTERS AND OTHER POLYESTERS, IN PRIMARY FORMS
• POLYMERS OF VINYL CHLORIDE OR OF OTHER HALOGENATED OLEFINS, IN PRIMARY FORMS
• POLYMERS OF PROPYLENE OR OF OTHER OLEFINS, IN PRIMARY FORMS
• PETROLEUM RESINS, COUMARONE-INDENE RESINS, POLYTERPENES, POLYSULFIDES, POLYSULFONES AND OTHER SPECIFIC SYNTHETIC POLYMERS NESOI, IN PRIMARY FORMS
• AMINO-RESINS, PHENOLIC RESINS AND POLYURETHANES, IN PRIMARY FORMS

Top U.S. Resin Exports to China
2000-2014
0
1,000
2,000
3,000
4,000
5,000
6,000
7,000200
0
200
1
200
2
20
03
200
4
200
5
200
6
200
7
200
8
200
9
201
0
20
11
201
2
201
3
201
4
POLYACETALS POLYMERS OF ETHYLENE SCRAP PLASTICS
POLYMERS OF VINYL CHLORIDE POLYAMIDES CELLULOSE
POLYMERS OF PROPYLENE PETROLEUM RESINS ACRYLIC POLYMERS
AMINO-RESINS
U.S
. $ M
illio
ns
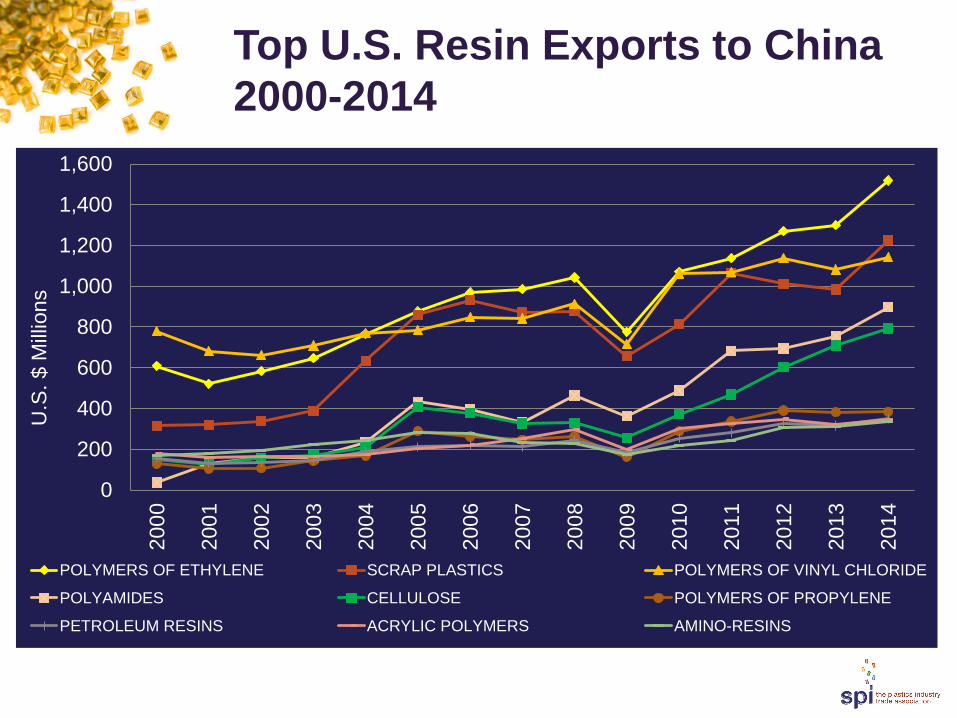
Top U.S. Resin Exports to China
2000-2014
0
200
400
600
800
1,000
1,200
1,400
1,600200
0
200
1
200
2
20
03
200
4
200
5
200
6
200
7
200
8
200
9
201
0
20
11
201
2
201
3
201
4
POLYMERS OF ETHYLENE SCRAP PLASTICS POLYMERS OF VINYL CHLORIDE
POLYAMIDES CELLULOSE POLYMERS OF PROPYLENE
PETROLEUM RESINS ACRYLIC POLYMERS AMINO-RESINS
U.S
. $ M
illio
ns

Top U.S. Resin Exports to China
by Percentage 2014
13.6%
11.4%
9.6% 8.7%
6.0%
5.1%
4.1%
3.9% 3.4%
POLYMERS OF ETHYLENE SCRAP PLASTICS
POLYMERS OF VINYL CHLORIDE POLYAMIDES
CELLULOSE POLYMERS OF PROPYLENE
PETROLEUM RESINS ACRYLIC POLYMERS
AMINO-RESINS ALL OTHERS

Top U.S. Resin Imports from
China 2000-2014
0
50
100
150
200
250200
0
200
1
200
2
20
03
200
4
200
5
200
6
200
7
200
8
200
9
201
0
20
11
201
2
201
3
201
4
AMINO-RESINS POLYACETALS CELLULOSE
POLYMERS OF VINYL CHLORIDE ACRYLIC POLYMERS ION-EXCHANGERS
POLYMERS OF ETHYLENE POLYMERS OF STYRENE PETROLEUM RESINS
NATURAL POLYMERS
U.S
. $ M
illio
ns
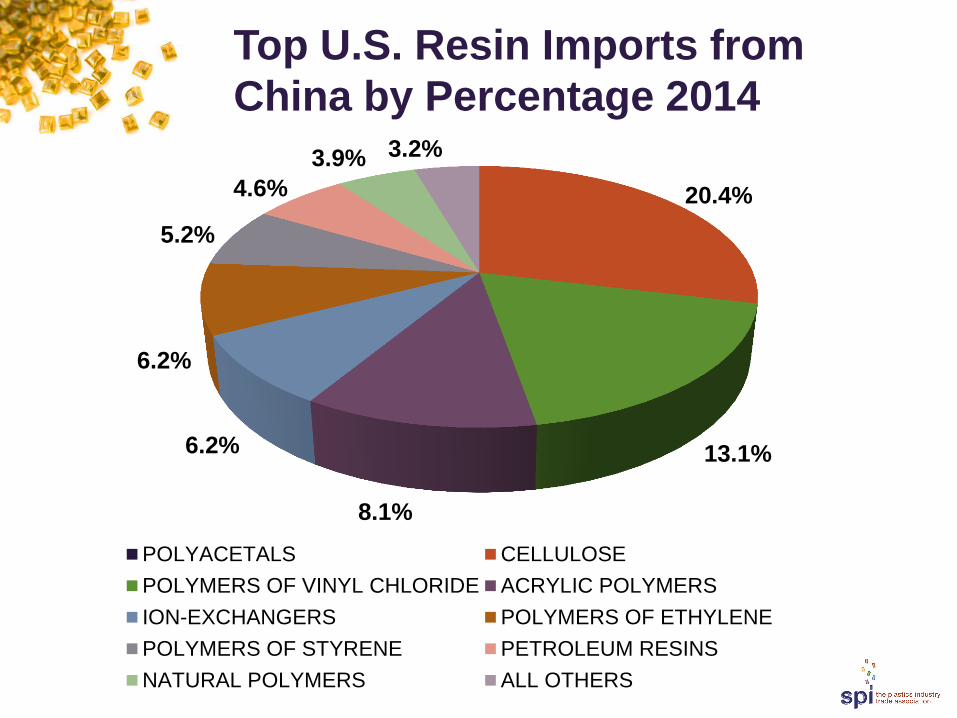
Top U.S. Resin Imports from
China by Percentage 2014
20.4%
13.1%
8.1%
6.2%
6.2%
5.2%
4.6%
3.9% 3.2%
POLYACETALS CELLULOSE
POLYMERS OF VINYL CHLORIDE ACRYLIC POLYMERS
ION-EXCHANGERS POLYMERS OF ETHYLENE
POLYMERS OF STYRENE PETROLEUM RESINS
NATURAL POLYMERS ALL OTHERS

Thank You!
谢谢 Merci Vielen Dank
Grazie ありがとうございました 감사합니다
Obrigado Спасибо Gracias Teşekkürler
Questions & Answers
Michael Taylor
202-974-5232