Embed Size (px)
Citation preview

Retail Sourcing Report Facts & Insight
Q3 2015

© 1995-2015 Copyright by CBX Software. All rights reserved.
1
FORWARD
RETAIL SOURCING REPORT
CBX Software’s Retail Sourcing Report provides research and analysis
aimed at informing global sourcing and buying decisions for retailers, brands
and other sourcing professionals. Each issue includes a snapshot of key
information impacting global sourcing, such as economic conditions in
sourcing countries, container shipping prices, currency exchange rates and
commodity costs. We also cover hot topics ourselves and include insight
from analysts and other experts.
If you like this content, please share:
LinkedIn, Facebook, Twitter
Americas +1.908.898.1880
Asia +852.2378.6300
EMEA +44.20.8133.0328
www.cbxsoftware.com
Statement of Indemnity: CBX Software recommends that any information provided in this report be
weighed against other sources and experts on the individual topics covered. As such, CBX Software bears no legal or financial responsibility for any potential harm or outcome which may result directly or indirectly from information provided in this report.

Q3 2015 Retail Sourcing Report
2 2
Content RETAIL SOURCING REPORT ............................................................................................................................ 0
FORWARD ..................................................................................................................................................... 1
PURCHASING MANAGER’S INDEX ............................................................................................................ 3
MAJOR ECONOMIC INDICATORS .............................................................................................................. 4
GLOBAL COMPETITIVENESS INDEX ......................................................................................................... 5
CHINA WAGE TREND SNAPSHOT .............................................................................................................. 6
GLOBAL LOW COST SOURCING COUNTRY WAGE SNAPSHOT ........................................................... 7
CONTAINER FREIGHT RATES FOR MAJOR ROUTES ............................................................................. 8
CURRENCY EXCHANGE RATES ................................................................................................................. 9
GLOBAL COMMODITY RATES .................................................................................................................. 10
CRUDE OIL ................................................................................................................................................. 10 RUBBER ..................................................................................................................................................... 10 METAL ........................................................................................................................................................ 10 WOOD ........................................................................................................................................................ 11 WOOL, HIDES, COTTON ............................................................................................................................... 11 PLASTICS AND FIBERS ................................................................................................................................. 12
QUALITY FOCUS ........................................................................................................................................ 12
QUALITY CONTROL, COMPLIANCE, SUSTAINABILITY HIGHLIGHTS ................................................................... 12
FROM RISK MANAGEMENT TO PRODUCT SAFETY .............................................................................. 14
ABOUT CBX SOFTWARE ........................................................................................................................... 15

© 1995-2015 Copyright by CBX Software. All rights reserved.
3
Purchasing Manager’s Index
To help understand industry and economic conditions in a country, the PMI Index tracks variables such as
output, new orders, stock levels, employment and prices across private companies in the manufacturing,
construction, retail and service sectors.
A reading below 50 indicates contraction from the previous month, while a reading above 50 indicates
growth. Currently 22 countries and regions conduct the PMI survey and compilation, based on an
internationally standardized methodology.
This update looks at a selection of emerging economies and key sourcing countries, providing indicators
for recent months (based on data provided by Markit).
Analysis: The global manufacturing sector remained in a soft growth patch at the end of the second
quarter, with June seeing a mild deceleration in the rate of output expansion to a near two-year low.
Among the main emerging markets, output fell slightly in China and Russia, but rose in India, Mexico and
Vietnam. Brazil’s severe downturn in manufacturing production continued.
Country Apr 2015
May 2015
June 2015
Indicators
Brazil 46.0 45.9 46.5
The Brazilian manufacturing recession continued in Q3. Companies faced further reductions in new work intakes leading many to scale back output and cut jobs again
China 48.9 49.2 49.4 Operating conditions faced by Chinese manufacturers continued to
deteriorate in June, albeit at a weaker rate.
Czech Republic
54.7 55.5 56.9 Growth rates for output, new orders, exports, purchasing and employment all accelerated for Czech manufucturers in June.
Egypt 49.8 49.9 Business conditions in the non-oil private sector deteriorated in March,
with inflation impacting input costs, a continuing trend from Q1.
India 51.3 52.6 51.3 The Indian manufacturing economy improved further in June, but output growth eased on the back of a weaker rise in new business inflows.
Indonesia 46.7 47.1 47.8 Business conditions across Indonesia’s manufacturing economy continued to deteriorate, with sustained reductions in new orders from both domestic and export clients.
Mexico 53.8 53.3
52.0
June data pointed to a sustained upturn in Mexican manufacturing
production and new order volumes, but both rates of expansion slowed
since the previous month.
Poland 54.0 52.4 54.3
Remaining above 50.0 for the ninth consecutive month in June, the PMI signalled an ongoing improvement in business conditions at Polish goods producers.
Russia 48.9 47.6 48.7
Operating conditions in Russia’s manufacturing sector continued to
deteriorate modestly during June as output, new orders and
employment all fell.
South Africa
51.5 50.1
49.2
June data signaled a contraction in South Africa’s private sector, with
output and new orders falling amid reports of a weak economic
environment and subdued demand
South Korea
48.8 47.8 46.1 Production and new orders in the South Korean manufacturing
economy both fell at the quickest rates in over two-and-a-half years.
Turkey 48.5 50.2 49.0 Turkish manufacturing business conditions deteriorated in June, following a brief stabilization in May.
Vietnam 53.5 54.8 52.2 Although output and new orders continued to expand at the end of the
second quarter of the year, rates of growth eased in June.
Sources: HSBC, Markit

Q3 2015 Retail Sourcing Report
4 4
Major Economic Indicators
This section looks at major economic indicators from key “low-cost” sourcing destinations, also pulling out
highlights and sourcing trends in these countries.
Selected highlights:
Bangladesh – The ADB revised its growth forecast for Bangladesh for the current year to 6.1% from 6.4%
Cambodia – Cambodia’s garment exports increased by 4% yoy to US$5.75 bln in 2014, down 20% yoy
India – A five-year foreign policy framework for promoting exports of goods and services was unveiled
Indonesia – Tariffs on garment exports to the EU are now removed under the EU’s GSP+ scheme
Pakistan – Textile Policy (2014-2019), was announced, with plans to double textile exports to US$26 bln
Philippines – FDI inflows reached an all-time high of US$6.2 billion in 2014, up 65.9% yoy
Thailand – GDP growth slowed to 0.7% yoy in 2014 from 2.9% yoy in 2013, the slowest since 2011
Turkey – The Turkish economy expanded by 2.9% yoy in 2014, slower than the 4.2% yoy growth in 2013
Vietnam – Vietnam became the second largest footwear exporter to the U.S. in 2014 (after China)
CPI (% yoy growth)
Oct 2014
Nov 2014
Dec 2014
Jan 2015
Feb 2015
Mar 2015
Bangladesh 6.6 6.2 6.1 6.0 6.1 -
Cambodia - - - - - -
India 5.5 4.4 5.0 5.2 5.4 5.2
Indonesia 4.8 6.2 8.4 7.0 6.3 -
Pakistan 5.8 4.0 4.3 3.9 3.2 2.5
Philippines 4.3 3.7 2.7 2.4 2.5 -
Thailand 1.5 1.3 0.6 -0.4 -0.5 -
Turkey 9.0 9.2 8.2 7.2 7.6 7.6
Vietnam 3.2 2.6 1.8 0.9 0.3 -
Exports (% yoy growth)
Oct 2014
Nov 2014
Dec 2014
Jan 2015
Feb 2015
Mar 2015
Bangladesh -7.6 9.3 4.3 4.8 5.2 7.4
Cambodia - - - - - -
India -5.0 7.3 -3.8 -11.2 -15.0 -21.1
Indonesia -2.2 -14.6 -13.8 -8.1 -16.0 -
Pakistan 5.0 9.5 -4.6 -0.2 -12.9 -13.4
Philippines 2.5 21.7 -3.2 -0.5 - -
Thailand 4.0 -1.0 1.9 -3.5 - -
Turkey 7.0 -7.9 1.2 -0.7 -6.0 -
Vietnam 14.1 13.7 13.7 14.0 8.4 -
Imports (% yoy growth)
Oct 2014
Nov 2014
Dec 2014
Jan 2015
Feb 2015
Feb 2015
Bangladesh 14.4 1.8 8.5 -9.8 - -
Cambodia - - - - - -
India 3.6 26.8 -4.8 -11.4 -15.7 -13.4
Indonesia -2.2 -7.3 -6.6 -15.6 -16.2 -
Pakistan 30.0 -0.6 8.4 -26.0 -7.6 -3.8
Philippines 7.5 -10.8 -10.6 - - -
Thailand -4.9 -3.5 -8.7 -13.3 - -
Turkey -1.5 -0.1 -5.6 -13.7 -7.2 -
Vietnam 11.5 11.8 12.1 39.2 21.9 -
Sources: Fung Group, various statistical bureaus
© 1995-2015 Copyright by CBX Software. All rights reserved.
5
Global Competitiveness Index
The Global Competitiveness is a ranking of countries based on their competitiveness across different
measures such as government regulation, labor market efficiency, education, infrastructure and other
measures important to doing business in a country. Below is a selection of emerging economies which are
important sourcing locations. As might be expected, countries which made significant gains in the index
include Bangladesh, Indonesia, the Philippines and Vietnam, while China remained relatively flat.
Global Competitiveness Index: Selected Indicators, 2013-14 (Ranking of 148 countries)
Rank/148 Bangladesh Cambodia China India Indonesia Pakistan Philippines Thailand Turkey Vietnam
Overall competitiveness
110(↑8) 88(↓3) 29(-) 60(↓1) 38(↑12) 133(↓9) 59(↑6) 37(↑1) 44(↓1) 70(↑5)
Institutions 131(↓4) 91(↓18) 47(↑3) 72(↓2) 67(↑5) 123(↓8) 79(↑15) 78(↓1) 56(↑8) 98(↓9)
Intellectual property protection
130(↑1) 99(↓14) 53(↓2) 71(↓8) 55(↑5) 109(↓3) 78(↑9) 102(↓1) 74(↑12) 116(↑7)
Burden of government regulation
97(↓12) 70(↓28) 14(↑9) 104(↓6) 31(↑17) 82(↓20) 98(↑10) 90(↓1) 72(↑8) 106(↑6)
Strength of investor protection
25(↓1) 69(↓4) 84(↓4) 41(↓2) 41(↓2) 31(↓2) 107(↑3) 13(-) 57(↓5) 134(↓4)
Infrastructure 132(↑2) 101(↑3) 48(-) 85(↓1) 61(↑17) 121(↓5) 96(↑2) 47(↓1) 49(↑2) 82(↑13)
Quality of roads 118(↓5) 80(↓14) 54(-) 84(↑2) 78(↑12) 72(↑1) 87(-) 42(↓3) 44(↓1) 102(↑18)
Quality of railroad 78(↓5) 91(↓10) 20(↑2) 19(↑8) 44(↑7) 75(↓9) 89(↑5) 72(↓7) 52(↑1) 58(↑10)
Quality of port 104(↑17) 81(↓12) 59(-) 70(↑10) 89(↑15) 55(↑5) 116(↑4) 56(-) 63(-) 98(↑15)
Quality of air transport
125(↓5) 90(↓15) 65(↑5) 61(↑7) 68(↑21) 88(↓10) 113(↓1) 34(↓1) 33(↑3) 92(↑2)
Quality of electricity supply
133(↑3) 112(↓7) 67(↓8) 111(↓1) 89(↑4) 135(↓9) 93(↑5) 58(↓14) 77(-) 95(↑18)
Macroeconomic environment
79(↑21) 83(↑8) 10(↑1) 110(↓11) 26(↓1) 145(↓6) 40(↓4) 31(↓4) 76(↓21) 87(↑19)
Health & primary education
104(↓1) 99(↑3) 40(↓5) 102(↓1) 72(↓2) 128(↓11) 96(↑2) 81(↓3) 59(↑4) 67(↓3)
Higher education & training
127(↓1) 116(↓5) 70(↓8) 91(↓5) 64(↑9) 129(↓5) 67(↓3) 66(↓6) 65(↑9) 95(↑1)
Goods market efficiency
89(↑6) 55(↓5) 61(↓2) 85(↓10) 50(↑13) 103(↓6) 82(↑4) 34(↑3) 43(↓5) 74(↑17)
Prevalence of trade barriers
62(↑19) 80(↑8) 76(↑3) 61(↑17) 71(↑4) 92(↑22) 60(↑16) 50(↑21) 97(↑1) 104(↑24)
Trade tariffs, %duty 132(↓3) 105(↑22) 123(↓1) 128(↓2) 65(↓4) 142(↓7) 46(↑7) 83(↓5) 69(-) 92(↓2)
Burden of customs procedures
113(↑11) 101(↓22) 60(↑5) 88(↓4) 74(↓1) 91(↑2) 130(↓4) 80(↑6) 87(↑9) 99(↑15)
Labor market efficiency
124(↓7) 27(↑1) 34(↑7) 99(↓17) 103(↑17) 138(↓8) 100(↑3) 62(↑14) 130(↓6) 56(↓5)
Cooperation in labor-employer relations
96(↓12) 68(↑7) 60(↓3) 61(↓11) 49(↑12) 105(↓15) 34(↑4) 37(↑4) 82(↑22) 64(↓11)
Flexibility of wage determination
95(↓10) 71(-) 94(↓17) 50(↑11) 106(↑8) 97(↓5) 109(↑8) 111(↓14) 32(↑3) 69(↓24)
Pay and productivity 101(↑4) 32(↓3) 17(↓1) 58(↓15) 29(↑5) 86(↓13) 44(↑13) 31(↓4) 61(↓12) 15(↑3)
Business sophistication
113(↓5) 86(↓12) 45(-) 42(↓2) 37(↑5) 85(↓7) 49(-) 40(↑6) 43(↑4) 98(↑2)
Local supplier quantity
76(↑1) 111(-) 31(↓3) 2(↑8) 51(↑16) 78(↓4) 54(↓5) 23(↑2) 18(↑17) 30(↑8)
Local supplier quality
95(↓14) 113(↓11) 69(↓3) 76(↓7) 66(↓4) 92(↓6) 68(-) 42(↓3) 56(-) 89(↑10)
Site of cluster development
66(↓9) 44(↑4) 24(1) 16(↑13) 29(↑4) 62(-) 55(↓17) 33(↑1) 30(↑13) 68(↓32)
Source: World Economic Forum

Q3 2015 Retail Sourcing Report
6 6
China Wage Trend Snapshot
Following the 2011-15 Five Year Plan – stipulating growth of 13% per year - wage increases in China have occurred in at least 16 of the 31 provinces and regions. The chart illustrates min wage levels in selected Chinese cities and provinces. Specific regional wage increases are indicated in the below table. While a sharp slowdown in Chinese manufacturing has raised some uncertainty as to wage sustainability, policy makers are expected to intervene to support continued wage growth. Minimum Wage Levels of Selected Cities and Provinces (Yuan)
2014 Minimum Wage Updates (official)
Region Monthly Min Wage (RMB) Effective Date
Anhui 860-1,260 (various regions)
Beijing 1,560 April 2014
Chongqing 1,150 -1,250 (various districts) January 2014
Fujian 3.5% - 17% increase (various regions) August 2014
Gansu 1.200 – 1,350 (various regions)
Guangdong 1,210 – 1,510 (various regions) May 2015
Guizhou 2.7 - 15.2% increase (various regions) June 2014
Hebei 6% - 22% increase (various regions) August 2014
Henan 1,400, 1,250, 1,100 (various regions) July, 2014
Jiangxi 4-16% increase (various regions) August 2014
Jilin 4% - 16% increase (various regions) August 2014
Shaanxi 1,190 – 1,370 (various regions) May 2015
Shandong 1,200, 1,350, 1,500 March 2014
Shanghai 2,020 April 2015
Shenzhen 1,808 February 2014
Sichuan 1,100 – 1,400 (various regions) July 2014
Tianjin 1,850 April 2015
Qinghai Benchmark of 10% plus increase May, 2014
Yunnan 1,070 – 1,420 (various regions) May 2014
Zhejiang 1,220 - 1,650 (various regions) August 2014
Source: Trading Economics

© 1995-2015 Copyright by CBX Software. All rights reserved.
7
Global Low Cost Sourcing Country Wage Snapshot
Below is a snapshot of minimum wages in selected Asian sourcing locations, with the addition of Egypt and
Ethiopia. Wages vary by region or province and indicate either an estimated or actual/official rate. In cases
with a distinct variance, we provide an average. With greater visibility into social conditions in low cost
countries, currency fluctuations, increasing unrest and union pressure, wages in traditional low cost
sourcing countries are on the rise across the board. (Figures in USD/month as of July, 2015)
Most of the emerging markets have either committed to increases or are facing heavy union
pressure to increase wages in double digit percentages. In addition to basic wages, workers may
receive attendance and production bonuses, transport, subsidized meals, etc.
Note: Consult Fair Wage Guide to calculate benchmarks for wages in particular countries on an hourly or
piece rate basis and determine a fair wage in those regions.
BANGLADESH CAMBODIA CHINA EGYPT ETHIOPIA
$68 (Dec 2014) $128/month (Nov 2014) $137-$639 (2015 est.) $114 (Mar 2015 est.) $23-$40 (Dec 2014)
Bangladesh raised the minimum wage for garment workers – up by 77%. To 5300 Taka ($68) following a labor dispute that shut factories in the Ashulia industrial zone outside the capital city of Dhaka.
Cambodia officials agreed to raise the minimum wage in its biggest export earning apparel sector to $128 US a month, a 28% increase. Labor unions are still pushing for $140 as a minimum.
Minimum wages in China are set by local governments and vary widely by region and how wages are calculated (with housing, food, overtime etc.) Wages continue to increase +/-10% / year.
The basic min wage for the public sector rose from EGP246 to EGP870 in March 2015. Currently there is only one national minimum wage; there are no sectorial rates or occupation-based rates.
Many government institutions and public enterprises set their own minimum wages which accounts for variations. Public sector employees are on the low end ($23) while the private sector is higher (+/-$40)
INDIA INDONESIA LAOS MALAYSIA MYANMAR
$40 - $130 (2015 est.) $71-230 (2015 est.) $110 (2015 proposed) US$ 254 (2015 actual) $40-$60 (2015 est. )
Indian min. wages vary widely between regions and skill levels, however the central Indian labor ministry has proposed fixing minimum wages at 15,000 Rupees/month ($242) as of late 2014 - a big gap between actual rates.
Indonesia min. wages vary widely depending on the region and skill level. Officials have made commitments on increases but Union officials are pushing for more. For example, the Jakarta approved a $219 min. for 2015, but unions want $285.
Talks are underway in Laos to increase the min. wage, based on rising living costs from a 2011 min. of 626,000 Lao kip ($78) per month to a proposal by labor unions to raise wages to 900,000 Lao kip ($99) in key provinces.
Malaysian officials proposed an increase of the min. wage from RM 900 ($254) to RM 1,100 ($310) to offset rising costs. This excludes foreign workers who make up 70%-80% of textile sector workers. Wages vary widely across the country.
Rates vary widely in Myanmar (Burma) according to the public or private sector and skill level of employees. Talks are underway between unions, trade associations and government with proposed wages ranging from $36-$100 for unskilled workers.
PHILLIPPINES SRI LANKA THAILAND VIETNAM
$110-220 (2015 est.) $49-72 (2015 est.) $381 (2014 est.) $ 101-142 (2015 est.)
Wages in the Philippines vary widely by region and skill. Garment sector wages range from $6-8 per day. In 2013 minimum wages were replaced with a two-tier system. 1
st tier:
Minimum floor wage for new hires/ low skilled. 2
nd tier:
productivity – based system.
Min. wages in Sri Lanka vary by skill and industry. Industrial sector wages range from 6,500-7,500 Sri Lankan Rupees ($49-$56) for unskilled workers to 7,500-9,500 ($56-$72) for skilled workers. Average wages for textile workers are +/- $160.
Actual wages in Thailand increased to 13581 Thai Baht ($416) in the fourth quarter of 2014 from 13386 ($410) in the third quarter of 2014. Manufacturing wages average 12429 ($381) a marginal increase. An official min. wage of $300 per month applies from Jan. 2013
Prime Minister agreed to increase Vietnam’s minimum monthly salary from VND 2.15 mln-VND3.1 mln ($101-$146) depending on location, effective January 1, 2015. Inflation continues to press wages and further hikes are expected through to 2017.
Sources: WageIndicator.org, SAFSA, Wikipedia, Local News Reports

Q3 2015 Retail Sourcing Report
8 8
Container Freight Rates for Major Routes
The rates below are supplied by Xeneta which relies on actual “crowd sourced” data provided by shippers,
allowing users to cross-reference prices. All indices are reported in USD per Twenty Foot Container. We
report on historical and forward looking rates for key Asia-Europe and Asia-U.S. routes.
Analysis: Freight rates on Asia-European trade lanes have hit record lows. Average rates for 2015 for
the Asia to Europe routes, the busiest in the world, are $697 per TEU compared to $1,170 last year. Faced
with below costs rates, carriers are announcing rate increases from July and will also reduce capacity.
With the US West Coast port dispute resolved, and terminal operations back to normal, Asia-North
America trade lanes have now stabilized. Over capacity is still an issue as it is on most trade lanes,
impacting prices and stability. Container shippers announced rate increases to take effect June, 2015.
Chart Source: www.xeneta.com
20ft Container Rates (USD)
(6 months to July 2015)
Avg. High: +/-$1,150 (Feb 2015)
Avg. Low: +/- $750 (Mar 2015)
20ft Container Rates (USD)
(6 months to July 2015)
Avg. High: +/-$1,150 (Feb 2015)
Avg. Low: +/- $775 (Mar 2015)
20ft Container Rates (USD)
(6 Months to July 2015)
Avg. High: +/-$1,150 (Feb 2015)
Avg. Low: +/- $775 (Mar 2015)

© 1995-2015 Copyright by CBX Software. All rights reserved.
9
Currency Exchange Rates
Following are exchange rates and indicators from 30 day to 2 year historical rates for major currencies commonly factored into global sourcing costing estimations. The USD is expected to gain strength as a rate hike approaches in September. Developments in the Greek saga are likely to support higher levels of volatility in the EUR. Chinese policy reforms, including liberalization of the RMB are pressing ahead, which most likely means steady RMB appreciation. EURO / USD:
EURO / RMB:
USD / RMB:
Sources: Oanda.com; News/Analyst Reports
The EUR faces ongoing uncertainty in the face of the Greek crisis, yet a positive relationship between the EUR/USD has emerged, especially for the EUR, which has performed better in recent months.
EUR/USD - % change
2 years -15.51%
1 year -18.37%
6 months -3.55%
3 months 2.66%
30 days -2.01%
The Eurozone recovery appears to be holding up, but adverse credit conditions in Greece will most likely keep the EUR on the defensive. The RMB is expected to main a trend towards appreciation as liberalization continues.
EUR/RMB - % change
2 years -16.65%
1 year -19.45%
6 months -4.18%
3 months 2.62%
30 days -2.04%
Chinese economic data continues to suggest the economy is losing momentum. However rates for RMB have remained stable versus the USD which is expected to continue, reflecting the desire of policymakers to ease the pace of appreciation in the RMB.
USD/RMB - % change
2 years -1.35%
1 year -1.32%
6 months -0.65%
3 months -0.04%
30 days -0.03%

Q3 2015 Retail Sourcing Report
10 10
Global Commodity Rates
Oil prices, which were down almost 50% year on year began a modest recovery in Q2, but prices have
dropped again on the Greek crisis and news of a nuclear deal with Iran, which will allow Iran (which has
the world’s 4th largest reserves) to export more oil. The crisis in Greece and volatility in financial markets is
also impacting commodity prices in the short term, but despite the potential of a reverberation across
global economies, analysts predict little long-term impact. The outlook for the Chinese economy and for US
interest rates remain the key economic drivers for commodities.
Crude Oil
Rubber
Metal
20
40
60
80
100
120
Oil US$ per barrel
Dated Brent,lightblend 38 API
Dubai,medium,fob Dubai Fateh32 API
West TexasIntermedia 40API, MidlandTexas
70
80
90
100
Rubber, Singapore Commodity Exchange, No. 3 Rubber Smoked Sheets, US cents per pound
130
140
150
160
170
180
Metals Price Index, 2005 = 100, includes Copper, Aluminum, Iron Ore, Tin, Nickel, Zinc,
Lead, and Uranium Price Indices
0
5000
10000
15000
20000
25000Metals US$ per metric ton
Zinc Tin Aluminum
Lead Iron Copper
Nickel
Rubber prices are likely to remain low despite expectations of a recovery this year given slow global demand and surplus stocks with the collapse in crude oil prices.
© 1995-2015 Copyright by CBX Software. All rights reserved.
11
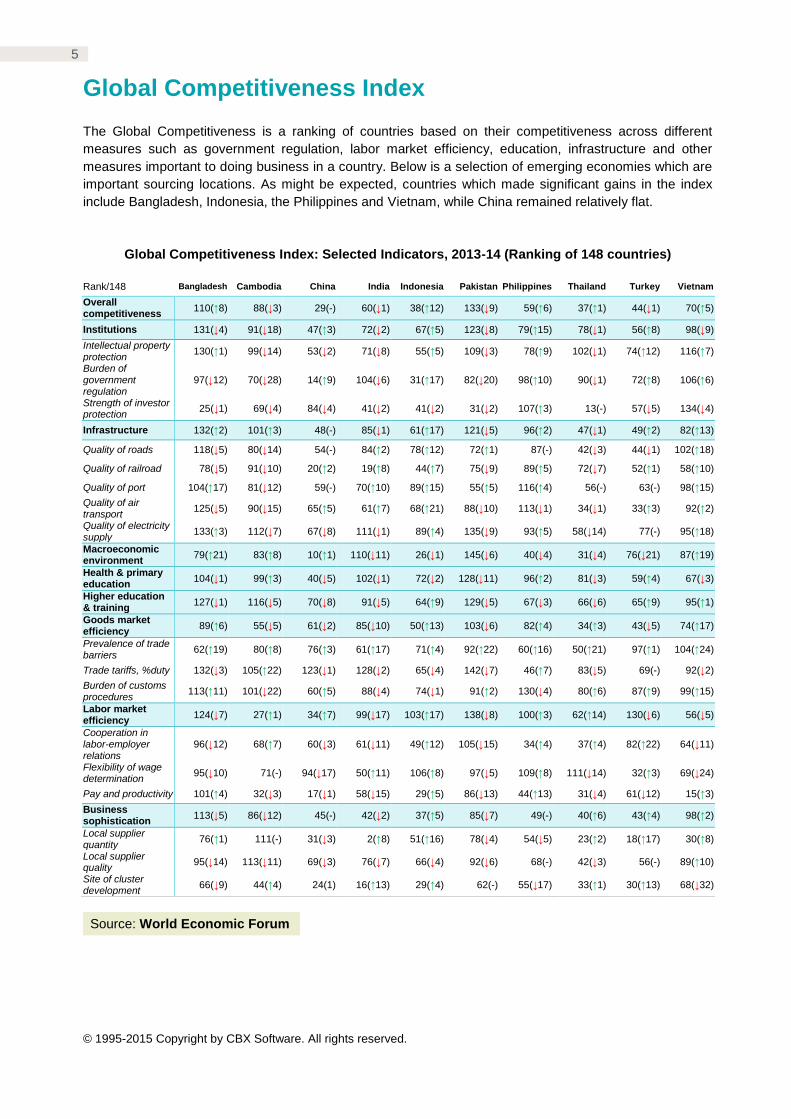
Wood
Wool, Hides, Cotton
Cotton prices are expected to trade down on expectation of weak sentiment in international markets and
news of sales from China’s stockpile. Prices are expected to stay in the range of 64 to 67 cents, depending
on US crop conditions and production estimates, export reports. China’s expected imports were lowered
from 6 to 5.75 million bales. Wool prices, falling through Q2 on low demand, a trend expected to continue.
0
100
200
300
400
500
600
700
800
900
1000
Wood US$ per cubic meter
Soft logs
Hard logs
Hard Sawn
Soft Sawn
800
850
900
950
1000
1050
1100
1150
Wool, Coarse, Australian Wool Exchange, US cents per kg
900
950
1000
1050
1100
1150
Wool, fine, Australian Wool Exchange, US cents / kilogram
90
95
100
105
110
115
120
Hides, Heavy native steers, wholesale dealer's price, fob Shipping Point, US cents /
pound
60
70
80
90
100
Cotton 'A Index', Middling 1-3/32 inch staple, CIF Liverpool, US cents / lb

Q3 2015 Retail Sourcing Report
12 12
Plastics and Fibers
A selection of plastic related prices is provided below. These are calculated from offer prices in the
Plasticker Material Exchange, which provide an indication of trends.
Analysis: Despite low oil prices, prices for the raw materials used to make finished plastic products, which
dropped initially, are now on an upward trend. This is partly explained by prior under-investment in the
plastic manufacturing sector.
Sources of above commodity prices: IMF data, Index Mundi, Plasticker
Quality Focus
This section focuses on manufacturing/sourcing quality related news and the impact on retailers and
brands. Regular insight to this section is provided by experts in the quality area, including regular
contributor, AsiaInspection, a leading provider of quality control and compliance services for businesses
importing from Asia, Africa, Southern Europe and Latin America.
Quality Control, Compliance, Sustainability Highlights
AI Barometer Key KPI’s (Q2, 2015)
0.00
0.20
0.40
0.60
0.80
1.00
1.20
1.40
Plastics & Fibers, Regrind/ Flakes (Euros/kg)
Nylon
Polyester
ABS
PVC
PP
PS

© 1995-2015 Copyright by CBX Software. All rights reserved.
13
China Overshadowed by Astounding Growth in Southeast Asia While China’s economy may be growing at
its slowest pace in six years, global brands
are readily expanding their supply chains to
other low-cost destinations in Asia. Looking
at July 2014 to June 2015 vs. July 2013 to
June 2014, AsiaInspection data shows a
moderate 7% growth of product inspections
performed in China – on par with the
country’s GDP growth. That said, growth
was staggering in nearly every other South-
East Asian country. Inspections in Cambodia
grew at an unprecedented 227% year over
year; Vietnam, 172%; Myanmar, which in
recent years has relaxed import restrictions
and abolished export taxes, saw 133%
growth; Indonesia, 114%; Thailand, 102%;
Bangladesh, 81%; and even the less known
Pakistan showed a 47% increase.
While most of the Southeast Asia growth seems driven by apparel exports, there are notable exceptions.
The most commonly inspected products by AI were furniture in Indonesia, Malaysia and the Philippines;
footwear in Vietnam, bags in Thailand, and audio and video equipment in South Korea.
Vietnam – Growth and Ethical Compliance Scores Lead Asia
Vietnam is now the world's 4th largest garment exporter and is working to increase its share of exports with
major expansion plans for its garment industry and several free trade agreements – some already signed
and some in the works (including the ongoing Trans Pacific Partnership negotiations). Not only have
inspections performed increased by 172% yoy, but ethical audit scores were the highest of the big four in
Asia according to AI figures. Over the past 12 months Vietnam had a score of 6.7 out of 10, ahead of India
at 6.6, China 6.2 and Bangladesh 6.5. Some of Vietnam's improvement can be attributed to the recent
progress made in the country's labor laws, better worker representation and efforts to increase safety
awareness.
South-East Asia Tightens Environmental Restrictions
Environmental concerns are becoming increasing prominent as countries adopt and enforce more stringent
environmental regulations. The Indian environmental authorities disrupted supply chains by ordering the
closure of nearly 900 textile units for their failure to install effluent treatment facilities, while Vietnam
recently rejected an investment proposal worth US$ 200 million, deeming the proposed textile and dyeing
plant “environmentally unsound”. Meanwhile, China released the Action Plan for Water Pollution
Prevention and Control, authorities warn of the imminent crackdown on illegal discharges and falsification
of monitoring data.
“The overall trend in South-East Asia and the rate of growth outside of China is
unprecedented,” said Sebastian Breteau, CEO of Asia Inspection. “Two years ago, China
represented 91% of inspections, today its share is 78%.”

Q3 2015 Retail Sourcing Report
14 14
From Risk Management to Product Safety
This is a guest post by Jo Van Landeghem, Quality and Safety manager for global retailer C&A. Risk and Quality go hand in hand. When you reduce the risk, the product quality will rise. Whilst higher quality = stronger brand, lower costs result in an increase in demand. Therefore proper Quality Management always encompasses Risk Management. Quality risks begin with suppliers making components, factory workers assembling the final product, culminating with the end consumers using the product. Important to note is that an end consumer is not necessarily the one who purchased the product. A child or your grandmother could end up using the product. In order to always ensure Product Safety, Risk Management has a major role to play. Classic Risk Management focuses on severity and frequency of risk, which is then translated and standardized into a risk matrix. So far so good, but only as long as your company is able to:
identify the risk
understand the risk
reduce/mitigate the risk
implement the Key Learnings in its Quality
Management System
This is why designing a product is THE critical starting point where you apply risk assessment. You need to be aware of the weaknesses or failure mode of the single components you are going to use and the combination of all these components in its foreseeable use. If the design of the product is hard to reproduce then inconsistency in production will become the biggest troublemaker that can lead to major risk or even a product recall. Once the product hits the market, Customer Complaints / Customer Feedback needs to be categorized by the risk matrix, enabling the organization to focus and trigger the Corrective and Preventive Action plans where needed. This info should then be stored in the products Technical File so it can be used for future reference and guidance. As market and brand competition has increased, the speed of product development followed suit. But by going faster the risk of making a mistake has also increased, therefore a preventive rather than a reactive approach to risk is crucial. Product Safety is expected by any consumer both chemically and mechanically, whether by design, workmanship or any other variables. Ensuring Chemical Product Safety is pretty straight forward as there are industry stands such as REACH etc., but Mechanical Product Safety is not that well established yet. Often Mechanical Product Safety incidents are caused through:
poor understanding of design related risk
poor component quality usage/selection
poor quality workmanship when the products are being manufactured
poor combination of quality components combined with inappropriate workmanship
For example; a zipper from a reputable brand is sewn into a baby sleeping bag but the zip slider and puller is of the kind with a "non-end zipper stop" so it can easily be removed when required. Now these zippers are for a specific usage but certainly not suitable for a baby product as the baby could remove the zipper part by themselves when unsupervised in their "safe" cot bed. There is much more to be said and learned on the topic of Product Safety & Risk Management, but Common sense goes a long way when you need to decide on design and safety requirements in your own company.

© 1995-2015 Copyright by CBX Software. All rights reserved.
15
This exclusive event brings together over 100 sourcing executives at leading retailers and brands to learn and exchange ideas on the most pressing issues in retail global sourcing today.
Topics Include: Strategies for Optimizing your Sourcing Operations, Private Label Sourcing Done
Right, Effective Quality Control, Leveraging Technology for Global Sourcing and more.
Past Attendees Include: Alliance Boots, Berghaus, Dollar General, El Corte Ingles, Family Dollar,
Marks & Spencer, MGB Metro, Pets at Home, Poundland, Target, Tchibo – and many more.
To pre-register for a complimentary seat (qualified attendees only):
Contact: Judy Mak at +852 2378 6300 or email [email protected].
About CBX Software
CBX Software has simplified the business of global sourcing; transforming traditional
methodologies into fast, friction free supply chains through our real-time cloud based Total
Sourcing Management Platform (TSM). We help retailers, brands and manufacturers manage
and empower the supply chain from plan to pay - one intelligent collaboration solution for an
enterprise to plan, spec, source, assure quality, order, make, inspect, ship and pay. Over 20,000
users in more than 30 countries rely on CBX, including: Target, Safeway, Kmart, Charming
Shoppes and others.
Americas +1.908.898.1880 Asia +852.2378.6300 EMEA +44.20.8133.0328
www.cbxsoftware.com
Click below to learn more about how CBX Software can help!
Request a Callback Request a Demonstration
Don’t miss the 8th Edition of CBX Global Sourcing Day
on December 4, 2015