Embed Size (px)
Citation preview

©2015 Competitive Solutions, Inc. All Rights Reserved
PBL ScoreCard® [email protected]
1
Why Data Visualization is Only the Tip of the Iceberg

©2015 Competitive Solutions, Inc. All Rights Reserved
PBL ScoreCard® [email protected]
What is Data Visualization?
2
Data Visualization – the goal is to communicate information clearly and efficiently via the statistical graphics, plots, information graphics, tables, and charts.
Effective Data Visualization:
• Highlights performance
• Displays patterns and relationships within the data
• Makes complex data easy to use and understand
• Helps you make better decisions
©2015 Competitive Solutions, Inc. All Rights Reserved
PBL ScoreCard® [email protected]
3
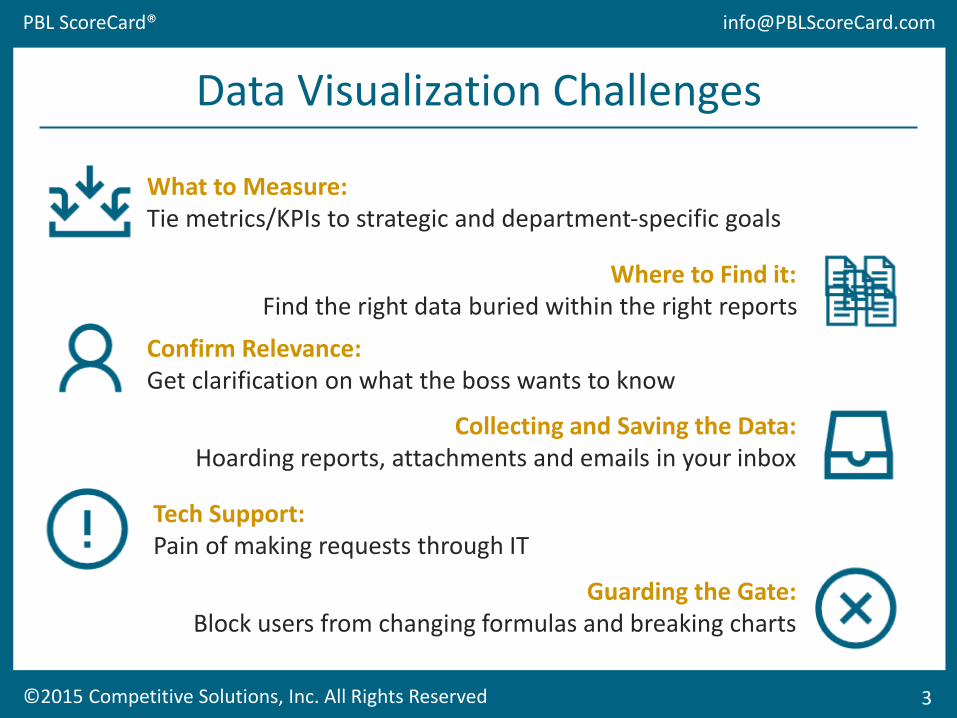
Data Visualization Challenges
What to Measure: Tie metrics/KPIs to strategic and department-specific goals
Where to Find it: Find the right data buried within the right reports
Confirm Relevance:Get clarification on what the boss wants to know
Collecting and Saving the Data:Hoarding reports, attachments and emails in your inbox
Tech Support:Pain of making requests through IT
Guarding the Gate:Block users from changing formulas and breaking charts

©2015 Competitive Solutions, Inc. All Rights Reserved
PBL ScoreCard® [email protected]
©2015 Competitive Solutions, Inc. All Rights Reserved
PBL ScoreCard® [email protected]
4
Data Visualization Results
Does the data have meaning?Is this actionable data?
Can you decipher and use this information?
©2015 Competitive Solutions, Inc. All Rights Reserved
PBL ScoreCard® [email protected]
5
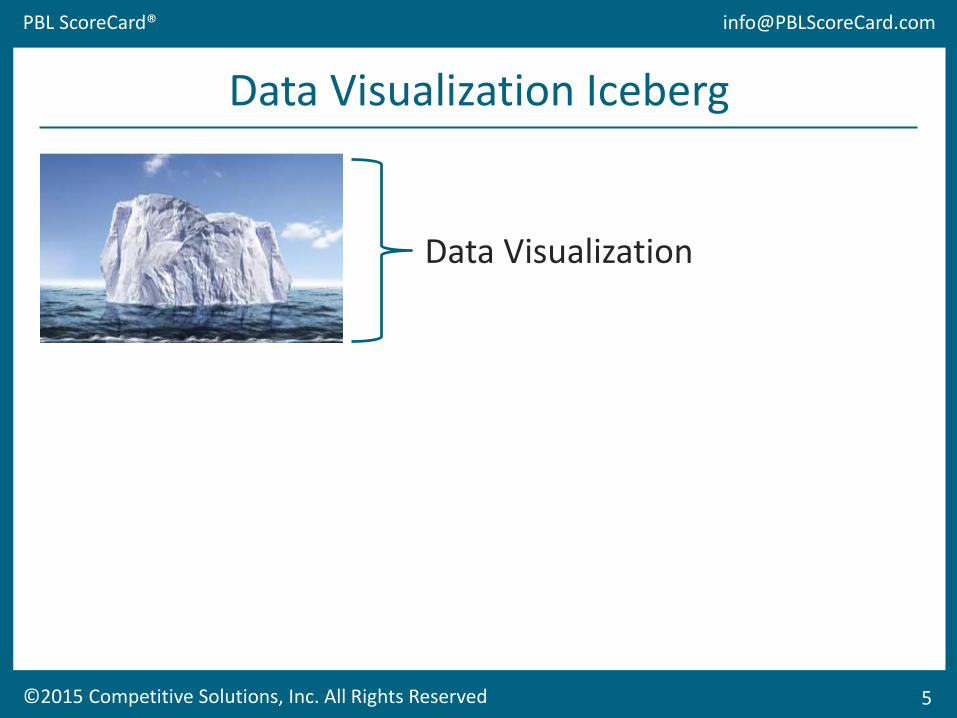
Data Visualization Iceberg
Data Visualization

©2015 Competitive Solutions, Inc. All Rights Reserved
PBL ScoreCard® [email protected]
6
Data Visualization Iceberg
Data Visualization
Scorecard System = Measure
In a culture of ownership you spend less time, energy, and resources holding people accountable because they hold themselves accountable.
©2015 Competitive Solutions, Inc. All Rights Reserved
PBL ScoreCard® [email protected]
7
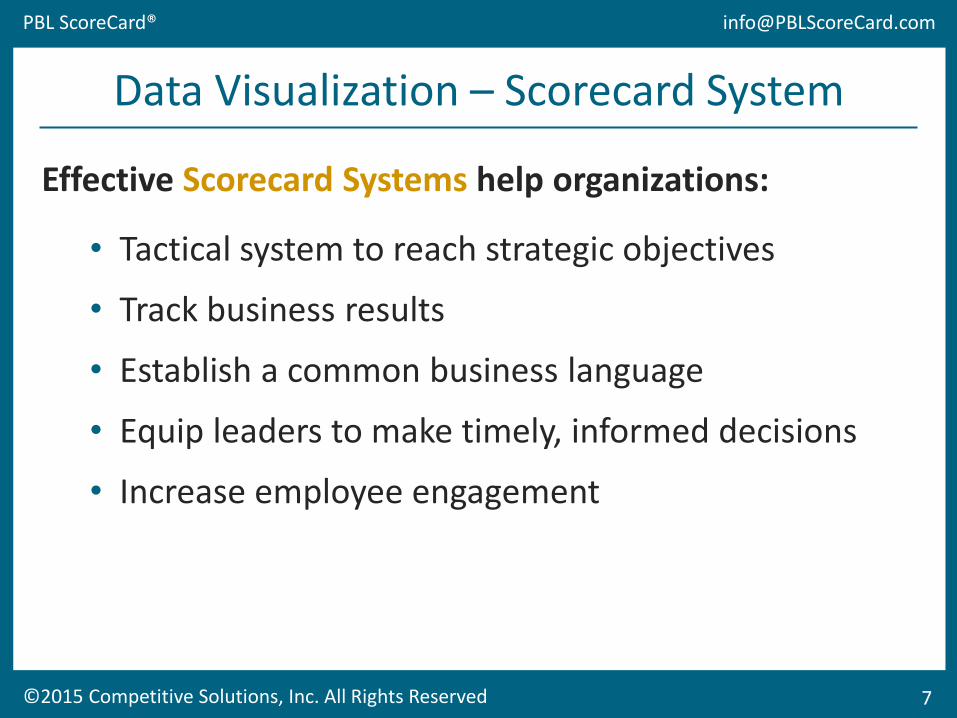
Data Visualization – Scorecard System
Effective Scorecard Systems help organizations:
• Tactical system to reach strategic objectives
• Track business results
• Establish a common business language
• Equip leaders to make timely, informed decisions
• Increase employee engagement
©2015 Competitive Solutions, Inc. All Rights Reserved
PBL ScoreCard® [email protected]
8
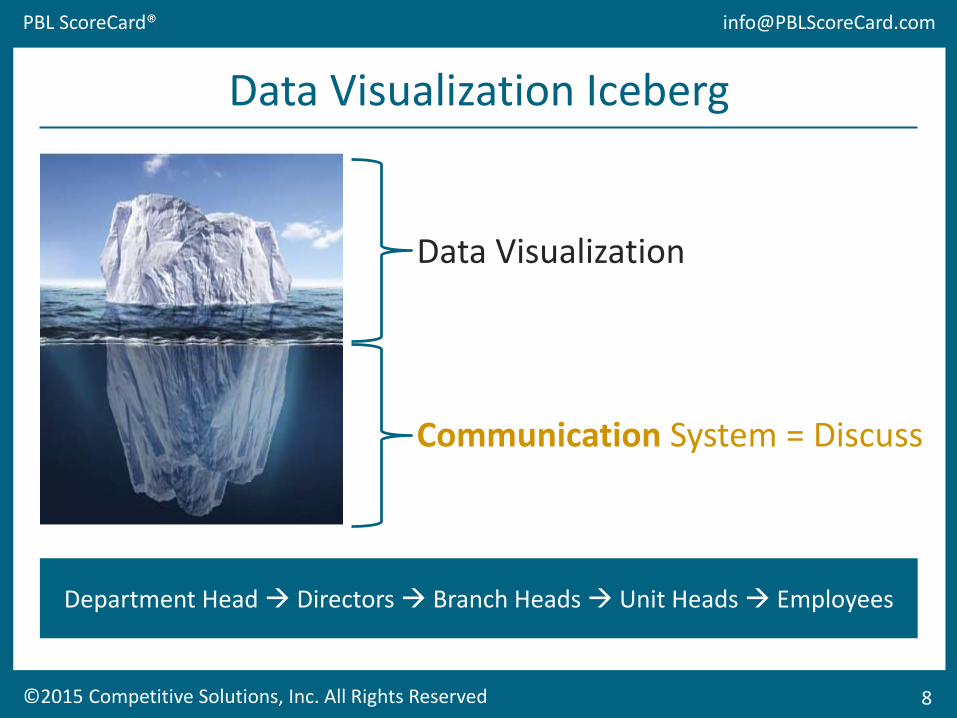
Data Visualization Iceberg
Data Visualization
Communication System = Discuss
Department Head Directors Branch Heads Unit Heads Employees
©2015 Competitive Solutions, Inc. All Rights Reserved
PBL ScoreCard® [email protected]
9
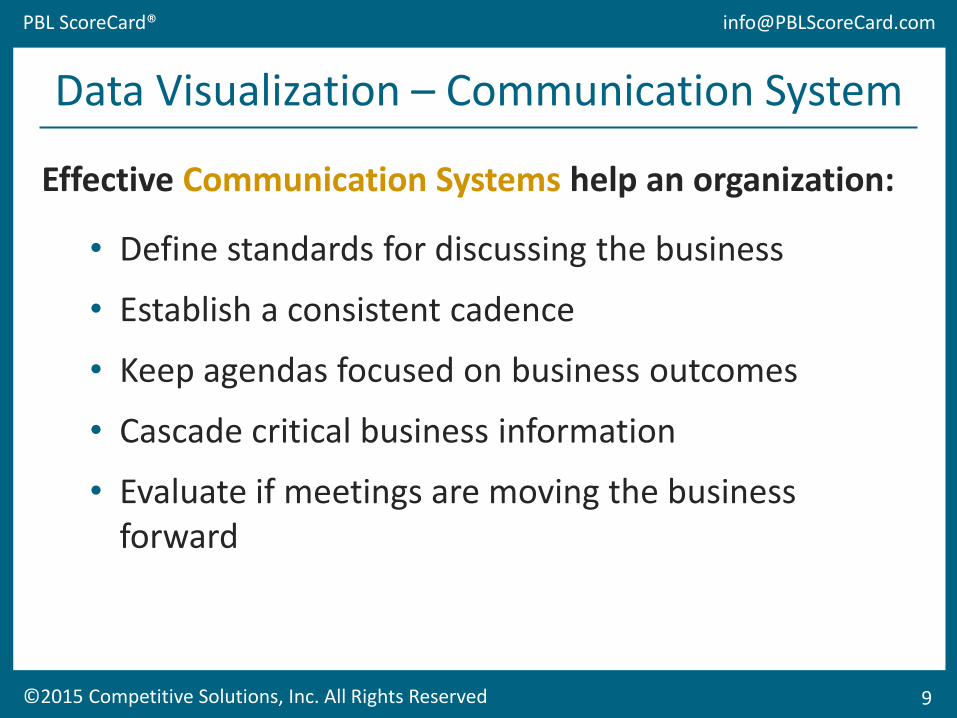
Data Visualization – Communication System
Effective Communication Systems help an organization:
• Define standards for discussing the business
• Establish a consistent cadence
• Keep agendas focused on business outcomes
• Cascade critical business information
• Evaluate if meetings are moving the business forward

©2015 Competitive Solutions, Inc. All Rights Reserved
PBL ScoreCard® [email protected]
10
Data Visualization Iceberg
Data Visualization
Accountability System = Act
What to do when people break their commitments.

©2015 Competitive Solutions, Inc. All Rights Reserved
PBL ScoreCard® [email protected]
11
Data Visualization – Accountability System
Effective Accountability Systems help an organization:
• Clearly define what is to be done
• Identify who takes corrective action (1 person)
• Assign a target date for each action
• Link directly to a metric/KPI for clear line of site
• Understand the process of action assignment and follow through
©2015 Competitive Solutions, Inc. All Rights Reserved
PBL ScoreCard® [email protected]
12
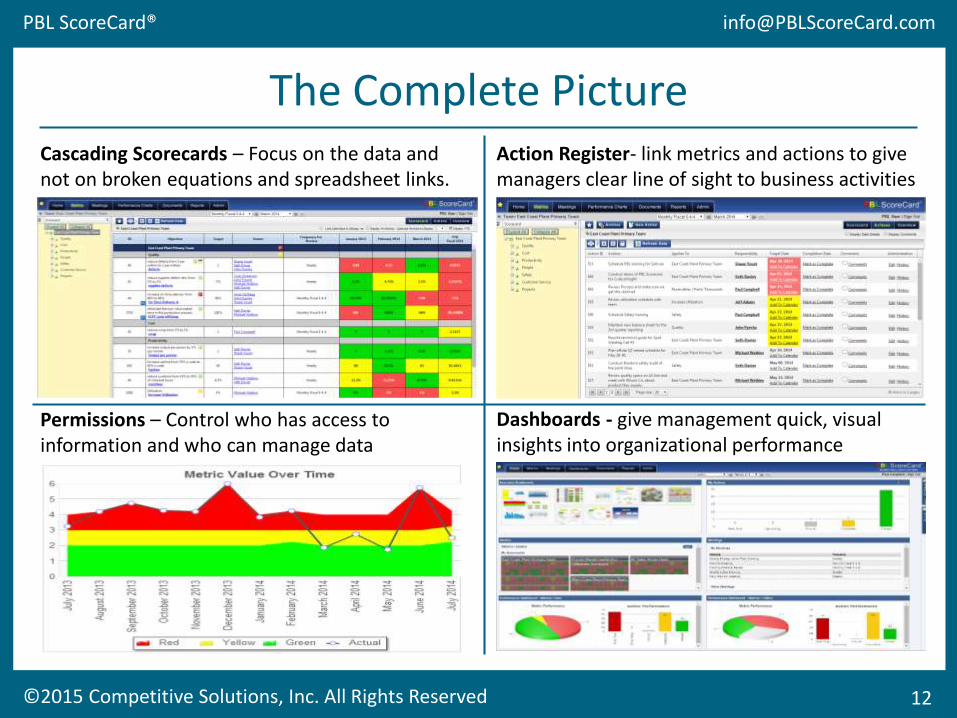
The Complete Picture
Permissions – Control who has access to information and who can manage data
Cascading Scorecards – Focus on the data and not on broken equations and spreadsheet links.
Action Register- link metrics and actions to give managers clear line of sight to business activities
Dashboards - give management quick, visual insights into organizational performance
©2015 Competitive Solutions, Inc. All Rights Reserved
PBL ScoreCard® [email protected]
13
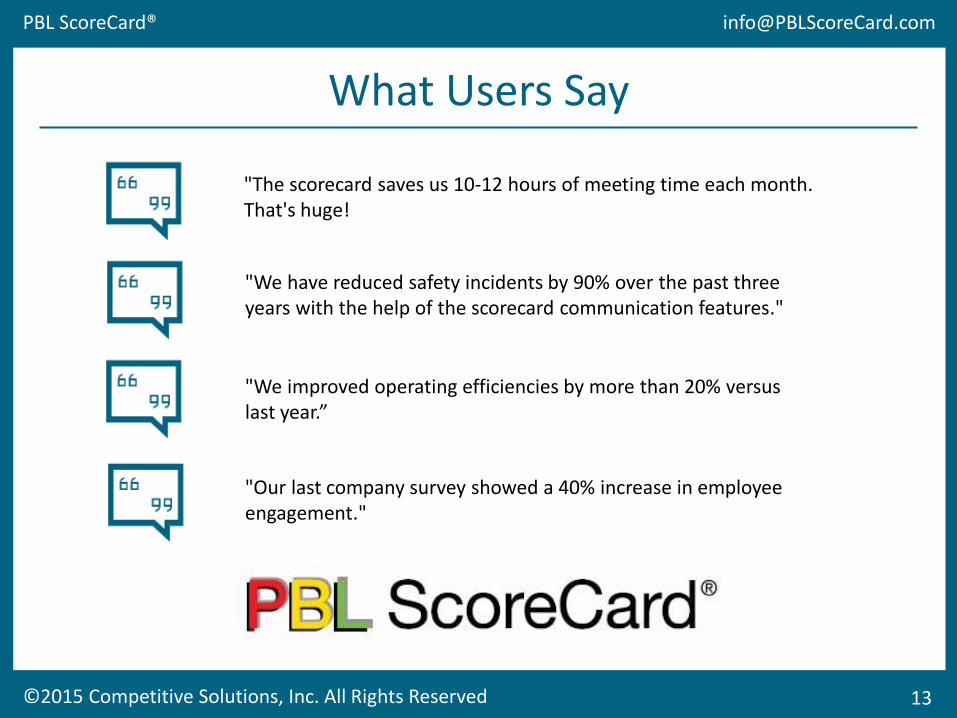
What Users Say
"The scorecard saves us 10-12 hours of meeting time each month. That's huge!
"We improved operating efficiencies by more than 20% versus last year.”
"Our last company survey showed a 40% increase in employee engagement."
"We have reduced safety incidents by 90% over the past three years with the help of the scorecard communication features."
©2015 Competitive Solutions, Inc. All Rights Reserved
PBL ScoreCard® [email protected]
14
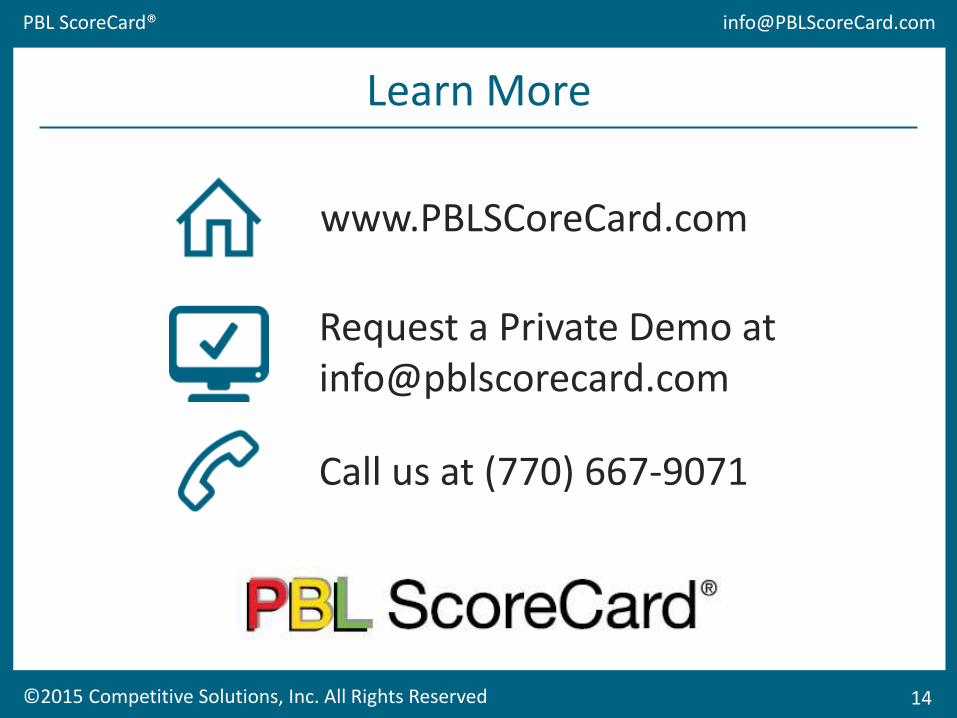
Learn More
Request a Private Demo at [email protected]
www.PBLSCoreCard.com
Call us at (770) 667-9071