Embed Size (px)
Citation preview

SUPERCHARGING YOUR DOCUMENTATION
1
VISUAL DOCUMENTATION
By Adrienne Bellehumeur
www.leadersinbusinessanalysis.com
This booklet covers Step 4 Visual Documentation of the six-step documentation process (Step 1 – Capturing, Step 2 –
Structuring, Step 3 – Presenting, Step 4 – Visual Documentation, Step 5 – Documentation for Effective Meetings,
Step 6 – Storing & Maintaining Information). This booklet provides some basic tips, techniques, approaches and
exercises for understanding and practicing how to produce high quality visuals in your documentation.
WORKBOOK SERIES
4
1 | P a g e
CHALLENGE
Crash Course in Visual Documentation
This approach to documentation recognizes the reader’s need to be engaged through stimulating visuals.
Marketers have long understood the power of visuals.
Organizations pour huge fees into advertising agencies
and their marketing departments to capture the eye of
their target external audience. So, why do they forget
about marketing to their internal audience?
Although you have rarely used “documentation” and
“visual design” in the same sentence, challenge
yourself to do so. You don’t need to be a graphic artist,
but you do need to acknowledge and understand how
important the visual component of your
documentation is, and then work on simple techniques
to improve this.
There are no rules in business that say your
documentation can’t be fun. Having fun with it is the
first step to seeing more engagement from your
audience.
To improve your documentation immediately, replace blocks of text with
visuals to illustrate your key messages and hold your readers’ attention.

2 | P a g e
QUICK TIPS:
Improve Your Visual Flair Immediately
Use these quick tips for effective results:
(1) Take Advantage of the Many Canned Shapes and Smart Art in Microsoft
Word to Engage Your Audience – These simple shapes will help you to break up
blocks of text to make your documents more readable for your users. The shapes in
Word are easy to add and, with practice, you will learn how to insert shapes to create a
great colour scheme quickly.
(2) Put Pictures in Your Document – If you are building training materials, be sure to
include screen shots of how the system works. If you want to add punch to your
meeting notes, take photos of your meeting such as of the whiteboard, and add them to
your documentation. Why is Facebook so popular? Because we all love pictures!
(3) Use Simple Graphs to Communicate Number Values – Strings of large numbers
are not fun to look at and will lose your reader quickly. Communicating numbers using
simple graphs will help you to communicate them faster and more effectively. Microsoft
Word 2010
3 | P a g e
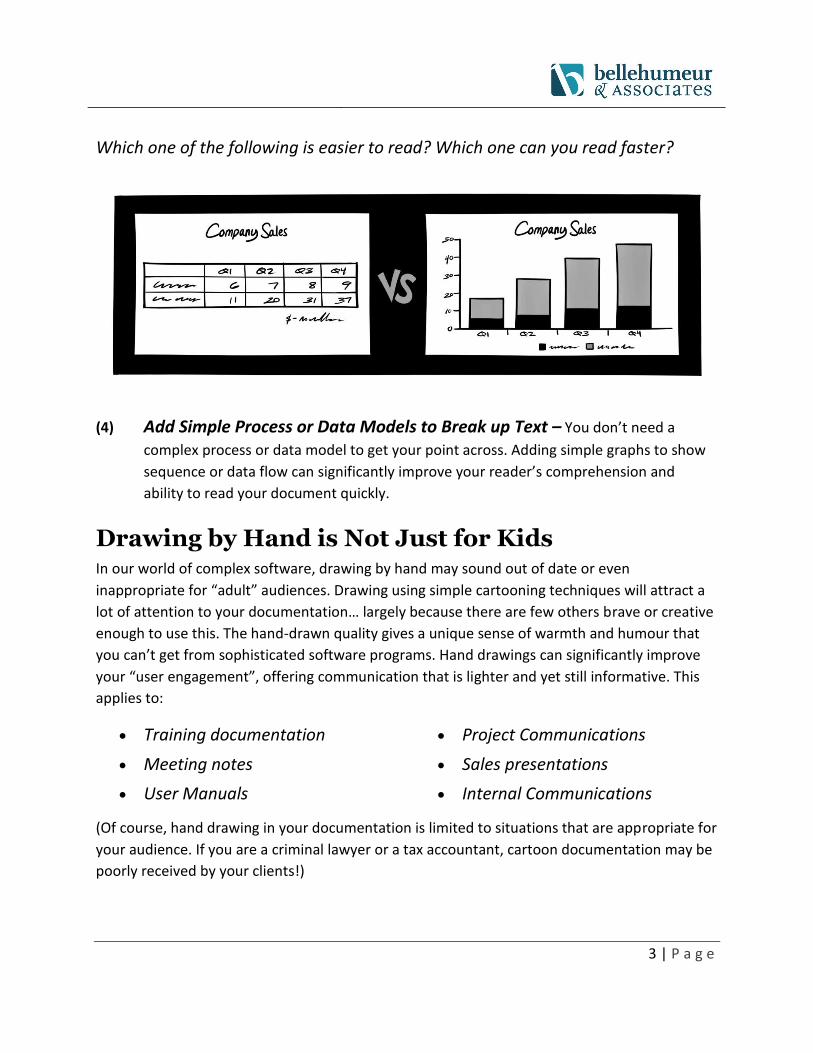
Which one of the following is easier to read? Which one can you read faster?
(4) Add Simple Process or Data Models to Break up Text – You don’t need a
complex process or data model to get your point across. Adding simple graphs to show
sequence or data flow can significantly improve your reader’s comprehension and
ability to read your document quickly.
Drawing by Hand is Not Just for Kids In our world of complex software, drawing by hand may sound out of date or even
inappropriate for “adult” audiences. Drawing using simple cartooning techniques will attract a
lot of attention to your documentation… largely because there are few others brave or creative
enough to use this. The hand-drawn quality gives a unique sense of warmth and humour that
you can’t get from sophisticated software programs. Hand drawings can significantly improve
your “user engagement”, offering communication that is lighter and yet still informative. This
applies to:
Training documentation
Meeting notes
User Manuals
Project Communications
Sales presentations
Internal Communications
(Of course, hand drawing in your documentation is limited to situations that are appropriate for
your audience. If you are a criminal lawyer or a tax accountant, cartoon documentation may be
poorly received by your clients!)

4 | P a g e
Take a Risk and Draw by Hand You don’t need the professional drawings such as the comics you find in the newspaper. We are
talking about “documentation style” cartoons. These are simple visual representations,
including:
Direction
Goal Stakeholders
EXERCISE:
Cartoon Your Meeting Notes
This exercise will provide you with insight into your own personal style for using hand-drawn visuals to capture business concepts.
STEPS:
(1) Choose a team meeting that is informal.
(2) Instruct all team members to take meeting notes illustrating through symbols or simple
cartoons and ask team members to avoid using text.
(3) After the meeting, review and compare each other’s notes as a team.

5 | P a g e
Cartoon Your Meeting Notes

6 | P a g e
DISCUSS WITH YOUR TEAM…
What symbols did team members choose?
How did each team member illustrate the points differently?
Which points were easy to illustrate? Which points were difficult to illustrate?
How could team members use illustration for future meeting notes?

7 | P a g e
Process & Data Modelling Process and data modelling is an essential part of an organization’s documentation. It adds a
visual dynamic to engage your readers and to understand your processes and data flows. This
visual component adds a new dimension to your documentation, enabling your user to grasp
and to review the content faster than lengthy write-ups.
Examples of Simple, Effective Process & Data Diagrams
Process Diagram – Swim lane
The swim lane diagram is an excellent
diagram for providing immediate clarity for
processes and roles. A swim lane diagram
categorizes the actors in their process
according to their own “section” marked by
vertical or horizontal lines.
Process Diagram – Use Case
A use case is a diagram that describes the
interactions between a user and a system.
These diagrams are excellent for
documenting details necessary for testing
or for understanding how a system works.
PROCESS MODELING: conveying a business process through a visual
representation.
DATA MODELLING: conveying the flow of data from people or technology
through a visual representation.

8 | P a g e
PARALLEL
This is not to say that you can
blindly copy one organization’s
processes to use for another
organization.
Processes depend on the
industry and the size of the
organization. Common sense
trumps all examples or
templates.
Data Flow Diagram – System Inputs
& Outputs
Simple input and output diagrams can be
extremely powerful for helping to bring
clarity to how data flows within your
organization.
Demystifying Process & Data Modelling As complicated as some consultants may have you believe it is, process and data modelling is
not rocket science. Kids are naturals at it, often drawing pictures of themselves walking to and
from home to school (processes) or illustrating how they interact with their family and friends
(data flows). The fundamental concepts of process and data modelling are very simple.
Looking to document your organization’s processes? There is no need to reinvent the
wheel. Modelling is standardized; there are many examples of sources, including Google, to find
them, and many people in your business circles who have looked at similar processes before.
Here are a few processes and data flows that are similar across organizations and
industries:
Finance: Accounts Payable, Accounts
Receivable, Cash Management, Budgeting, Monthly Close, Financial Statement Preparation, Authorization for Expenditure, Purchasing
IT: Change Management, System Development,
Problem & Incident Management, Access Management
HR: Onboarding New Hire, Voluntary
Termination, Involuntary Termination, Annual Appraisals, Extended Sick Leave
Sales: Request for Proposal, New Client, Monthly Sales Meetings, Leads Monitoring

9 | P a g e
QUICK TIPS:
How to Start Process and Data Modeling
Use these quick tips for effective results:
The fact that you are acknowledging you need to model your processes or data flows is the first
big step. If you have never done it before, don’t be afraid to get started… just jump in and do it.
Remember that
modelling is a
process - Process
modelling, like all
documentation, is a
process, not an end
product. With the
rapid rate of change in
business today,
process and data flows
change continuously.
Ensure that your
organization reviews
and updates your
models annually.
(1) Understand the Purpose of Your Diagram - The
purpose of your diagram will determine the level of detail
required, and the area that you need to focus on. Remember,
you never have to focus on all aspects of the process or data
flow. If you are focusing only on financial data in a data flow,
don’t focus on interfaces with no financial impact.
(2) Learn the Conventions - There are a few conventions for
process and data shapes that may be standard for your
organization. These conventions and symbols are easy to
follow if you are using Microsoft Visio or another common
diagramming program.
(3) Talk, Talk, Talk to People - Interviewing is a great way to
understand the process and data flow and to unlock
information locked inside the heads of your organization’s
employees. Draw, or have your interviewee draw, the process
or data flow on paper or on a whiteboard during your meeting.
(4) Gather Feedback and Edit - Document the process or data
flow immediately after your meeting and pass it back to your
interviewee for feedback.

10 | P a g e
(5) Make Your Diagrams Usable – When they are ready, get your diagrams out there
and into your organization’s operations for a test run. From there, you can test whether
your diagrams satisfy the reperformance standard. Can your stakeholders use the
diagrams effectively? Does it help them with their job? Use this feedback to make edits
and improvements.
(6) Understand the Purpose of Your Diagram - The purpose of your diagram will
determine the level of detail required, and the area that you need to focus on.
Remember, you never have to focus on all aspects of the process or data flow. If you are
focusing only on financial data in a data flow, don’t focus on interfaces with no financial
impact.
EXERCISE:
Improve Your Process Modelling Using Your Own Life
The easiest and most effective thing to do is to illustrate
the processes from your own life.
If you are looking to get more experience in process modelling, there is no need to wait until an
opportunity comes up in your organization. There is also no need to take an expensive course
or training.
STEPS:
(1) Choose a partner, if available.
(2) Choose a particular “life process” that you would like to improve.
(3) Using this process, take out your markers and a piece of white paper and draw out this
process.
(4) Build a diagram that will help you to think through each step.

11 | P a g e
(5) Ensure that you can communicate the process to your partner.
(6) Present this diagram to your partner and ask for their feedback.
Examples can include:
Planting a garden
Planning a dinner party
Doing your taxes
Organizing your house
Buying a house
Leaving for work in the morning
Leaving for vacation
Finding a boyfriend/girlfriend
Doing this exercise and treating it seriously will show you how powerful
visualizing processes and data flows can be.
Think about:
(1) Would you create a diagram for the process of buying a new house if you
had no intention of buying it for the next three years?
(2) Would you draw detailed diagrams for brushing your teeth?
(3) Would you use a bar-reader to track every dish in your house?

12 | P a g e
Process Work Flow Diagram Title
13 | P a g e
DISCUSS & CONSIDER
What did you learn or discover about the process?
Was this exercise helpful in getting you to think through all of the steps?
Is it easier to look at the process now that it is presented visually?
Did you get stuck on any of the steps of the process?

14 | P a g e
How did you choose to present the process visually?
What did you learn about process modelling?
ADDITIONAL RESOURCES: Process and Data modeling – Get The Most From Your Data
http://searchdatamanagement.techtarget.com/feature/Data-modeling-techniques-explained-
How-to-get-the-most-from-your-data