Embed Size (px)
Citation preview

13th October, 2012

> 17% of the world’s human & 11%
livestock population and counting
4.2% of the world’s water
2.4% of the world’s area
142 m ha cultivated & 60 m ha net irrigated
138% cropping intensity
52% of population earns livelihood in agriculture
14.0% contribution in GDP
10.5% earning of total exports
India Today…

India’s Population 1961 to 2051
Total and Urban
Rural
Urban
547 million
1210 million
1620 million

Pressures on Natural
Resource Base
Deforestation
Soil erosion
Desertification
(million ha)
Land degradation 107.43
Water erosion 57.15
Degraded forests 24.90
Wind erosion 10.46
Salt-affected 6.32
Acid-affected 12.00
Others 8.60
Per capita agricultural
land availability
0.34 ha (1950-51)
0.17 ha (1999-2000)
0.12 ha (2010-2011)
Biodiversity for
Posterity
World
Estimated Species 10 million
Documented species 1.72 million
India: Among the 12 Mega bio-
diversity Centres
India: 3 of the 34 Hot Spots of
Biodiversity
12% of world’s flora
7% of world’s fauna
National Bureaus of Plant,
Animal, Fish, Microbes and
Insects
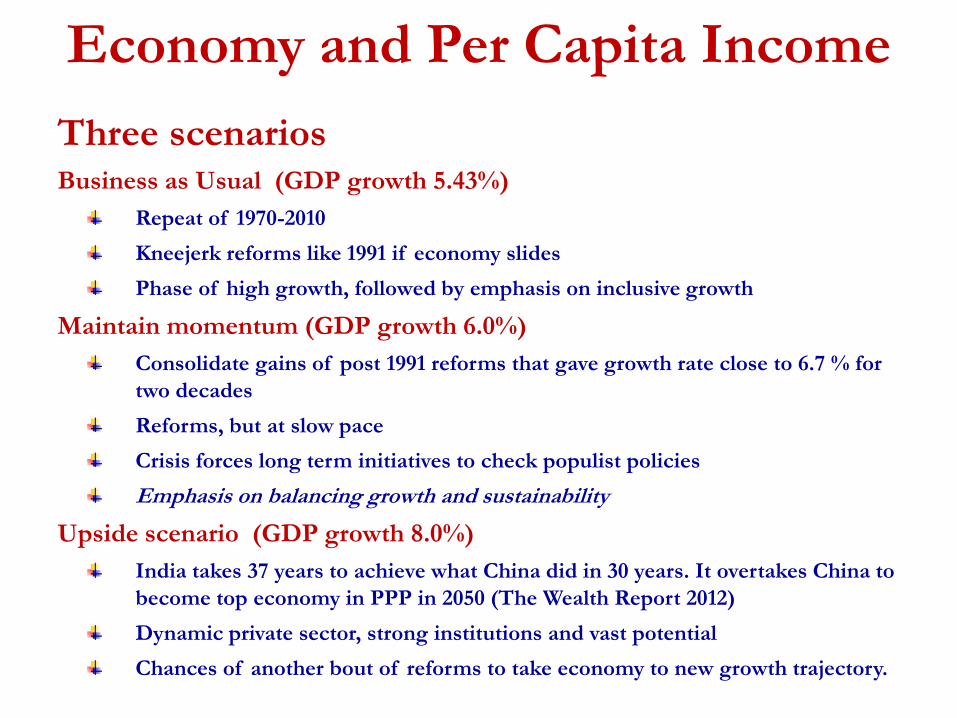
Economy and Per Capita Income
Three scenariosBusiness as Usual (GDP growth 5.43%)
Repeat of 1970-2010
Kneejerk reforms like 1991 if economy slides
Phase of high growth, followed by emphasis on inclusive growth
Maintain momentum (GDP growth 6.0%)
Consolidate gains of post 1991 reforms that gave growth rate close to 6.7 % for
two decades
Reforms, but at slow pace
Crisis forces long term initiatives to check populist policies
Emphasis on balancing growth and sustainability
Upside scenario (GDP growth 8.0%)
India takes 37 years to achieve what China did in 30 years. It overtakes China to
become top economy in PPP in 2050 (The Wealth Report 2012)
Dynamic private sector, strong institutions and vast potential
Chances of another bout of reforms to take economy to new growth trajectory.

How Much Food will be Consumed?
8597
30497
12159
40312
54183
0
10000
20000
30000
40000
50000
60000
1970 2010 2050
BAU
MM
UPSIDE
Food spending (`)
Share (%)
40 yr. back
1970
Present
2010-11
2050
BAU MM UPSIDE
Food share in income 58 23 9 10 6
Food spending 4.65 14.42 49.37 65.27 87.72
Per capita food spending 8597 12159 30497 40312 54183

Total Domestic Demand for Various Food
Commodities: million tonne
Food ItemsPresent Projected for 2050
2009-2010 BAU MM Upside
Cereals 196.4 311.5 358.7 406.9
Pulses 17.8 35.1 46.3 50.3
Foodgrains 214.2 346.6 405.0 457.1
Edible Oils 15.7 29.5 39.0 45.2
Vegetables 131.8 258.9 342.2 438.6
Fruits 71.2 231.0 305.3 183.4
Milk 111.5 303.7 401.4 483.6
Sugar 22.0 44.1 58.3 58.2
Meat 6.0 10.4 13.8 18.1
Eggs 58.2 139.2 183.9 202.5
Fish 7.1 16.9 22.4 27.0
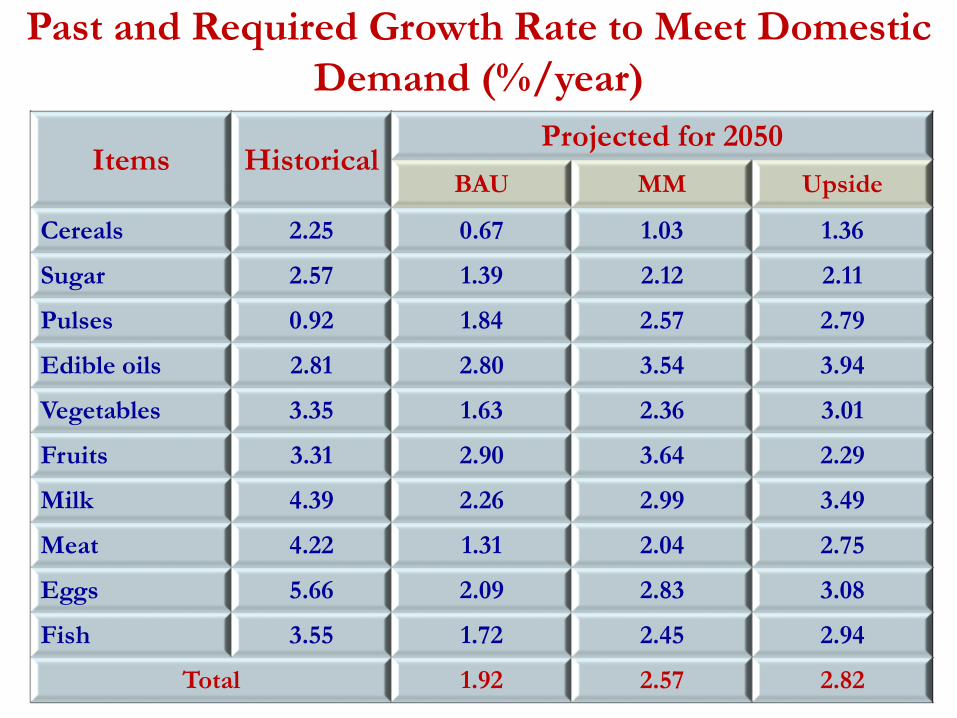
Past and Required Growth Rate to Meet Domestic
Demand (%/year)
Items HistoricalProjected for 2050
BAU MM Upside
Cereals 2.25 0.67 1.03 1.36
Sugar 2.57 1.39 2.12 2.11
Pulses 0.92 1.84 2.57 2.79
Edible oils 2.81 2.80 3.54 3.94
Vegetables 3.35 1.63 2.36 3.01
Fruits 3.31 2.90 3.64 2.29
Milk 4.39 2.26 2.99 3.49
Meat 4.22 1.31 2.04 2.75
Eggs 5.66 2.09 2.83 3.08
Fish 3.55 1.72 2.45 2.94
Total 1.92 2.57 2.82
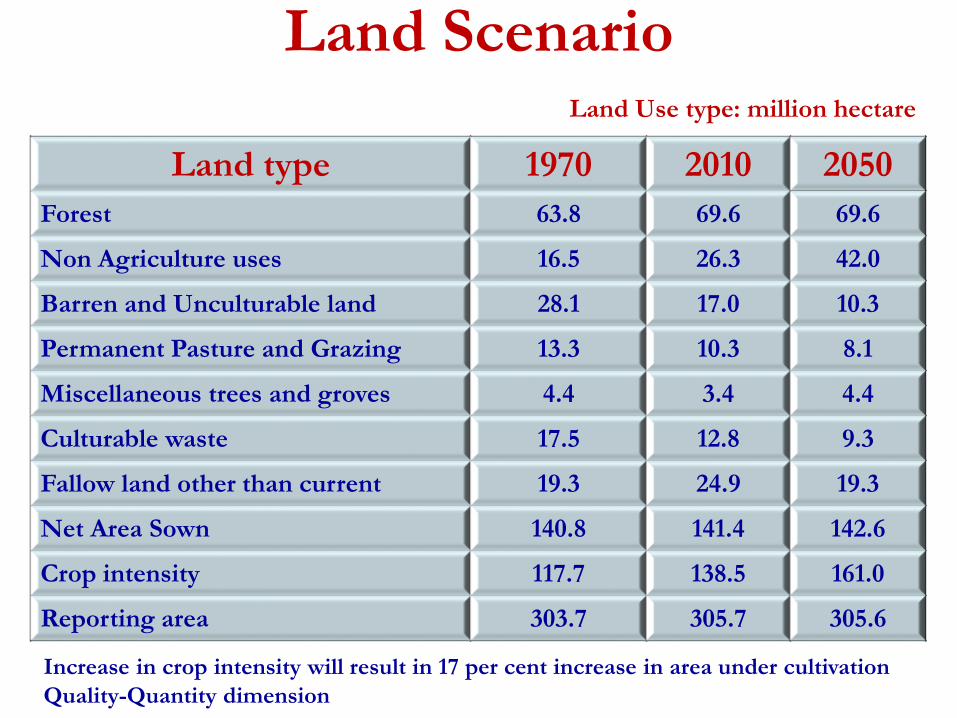
Land ScenarioLand Use type: million hectare
Increase in crop intensity will result in 17 per cent increase in area under cultivation
Quality-Quantity dimension
Land type 1970 2010 2050
Forest 63.8 69.6 69.6
Non Agriculture uses 16.5 26.3 42.0
Barren and Unculturable land 28.1 17.0 10.3
Permanent Pasture and Grazing 13.3 10.3 8.1
Miscellaneous trees and groves 4.4 3.4 4.4
Culturable waste 17.5 12.8 9.3
Fallow land other than current 19.3 24.9 19.3
Net Area Sown 140.8 141.4 142.6
Crop intensity 117.7 138.5 161.0
Reporting area 303.7 305.7 305.6

Water ScenarioWater demand projection: NCIWRD and IWMII
IWMI: Projects increase in Net area under irrigation from current level of
63 mh to 81 mh and gross irrigated area from 88 mh to 117 mh
Water demand in Agriculture and other sectors: BCM
Source: IWMI, 2007.
Sector 2000 2010 2025 2050
NCIWRD, Planning Com.
Irrigation 557 611 807
Total 710 843 1180
IWMI
Irrigation 605 675 637
Domestica 34 66 101
Industrialb 42 92 161
Total 680 833 900a Domestic withdrawals include those for livestock water demand which is 3.2 BCM b Industrial withdrawals include cooling needs for power generation
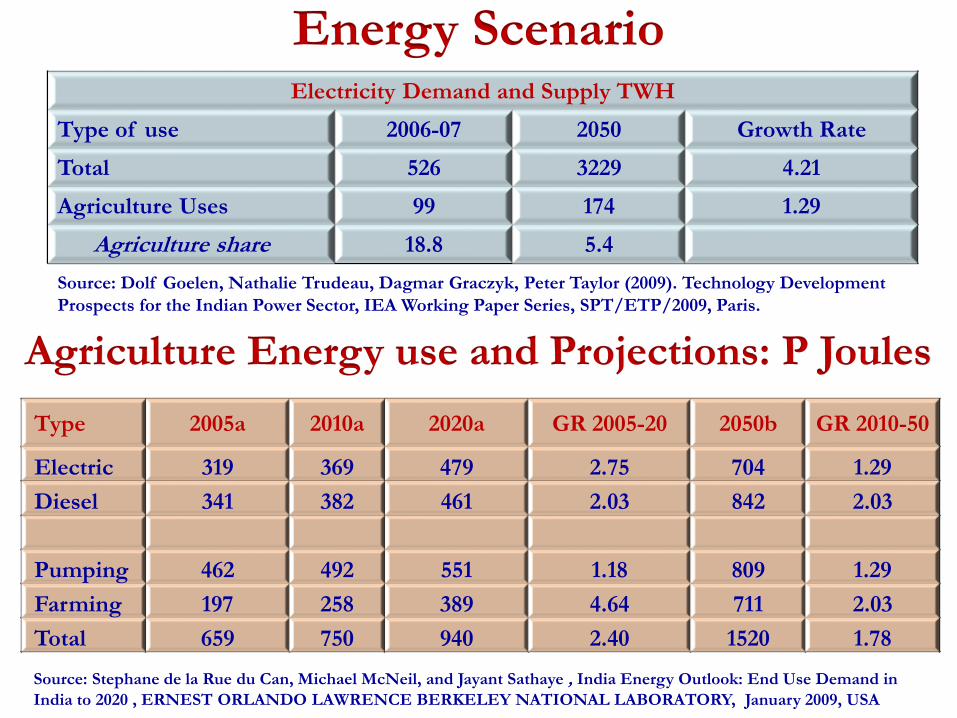
Energy Scenario
Source: Dolf Goelen, Nathalie Trudeau, Dagmar Graczyk, Peter Taylor (2009). Technology Development
Prospects for the Indian Power Sector, IEA Working Paper Series, SPT/ETP/2009, Paris.
Type 2005a 2010a 2020a GR 2005-20 2050b GR 2010-50
Electric 319 369 479 2.75 704 1.29
Diesel 341 382 461 2.03 842 2.03
Pumping 462 492 551 1.18 809 1.29
Farming 197 258 389 4.64 711 2.03
Total 659 750 940 2.40 1520 1.78
Source: Stephane de la Rue du Can, Michael McNeil, and Jayant Sathaye , India Energy Outlook: End Use Demand in
India to 2020 , ERNEST ORLANDO LAWRENCE BERKELEY NATIONAL LABORATORY, January 2009, USA
Electricity Demand and Supply TWH
Type of use 2006-07 2050 Growth Rate
Total 526 3229 4.21
Agriculture Uses 99 174 1.29
Agriculture share 18.8 5.4
Agriculture Energy use and Projections: P Joules
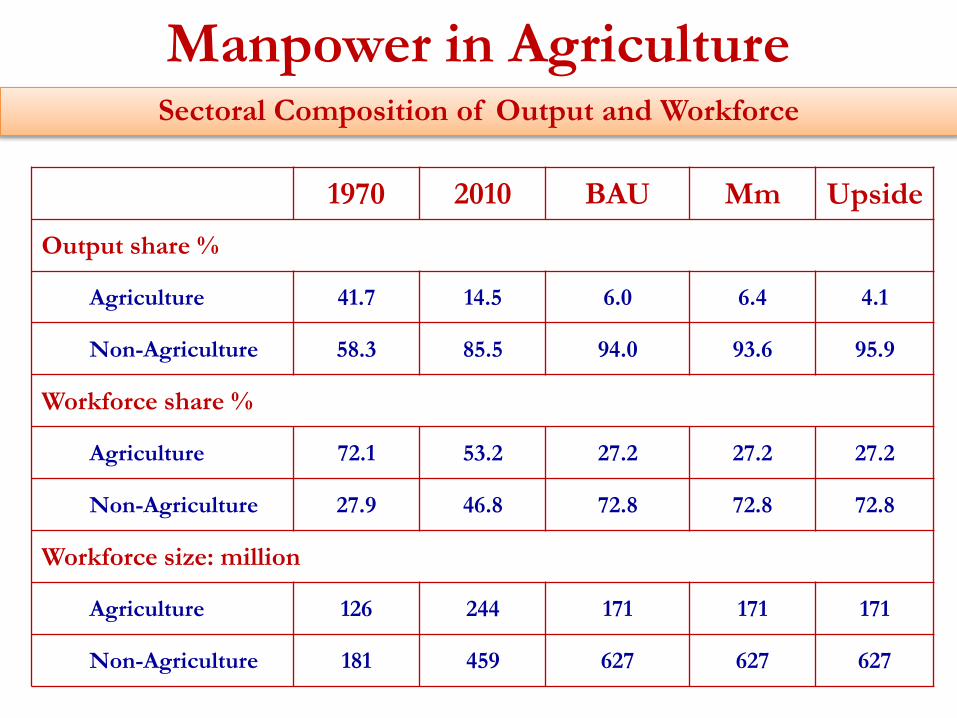
Manpower in AgricultureSectoral Composition of Output and Workforce
1970 2010 BAU Mm Upside
Output share %
Agriculture 41.7 14.5 6.0 6.4 4.1
Non-Agriculture 58.3 85.5 94.0 93.6 95.9
Workforce share %
Agriculture 72.1 53.2 27.2 27.2 27.2
Non-Agriculture 27.9 46.8 72.8 72.8 72.8
Workforce size: million
Agriculture 126 244 171 171 171
Non-Agriculture 181 459 627 627 627

Main Targets
A four fold increase in land productivity
A three fold increase in water
productivity
Doubling of energy use efficiency
A six fold increase in labour productivity
Low carbon emission

Productivity Gains
CommodityProductivity
1950 2011 Times
Food Grains, kg/ha 522 1921 3.7
Fruits, kg/ha 8600 11700 1.36
Vegetables, kg/ha 7500 17300 2.30
Fish, kg/ha
(Aquaculture)400 2900 7.25
Milk litre/lactation 583 1080 1.8
Eggs, No./bird 50 248 4.96

Towards Knowledge Management
Resources to Decisions
Ideas - Innovations
Insight - Vision
Information - Knowledge
Skills - Technologies

Agricultural R&D
Rainfed agriculture, Diversified agriculture, Integrated
Agriculture
Secondary Agriculture, Speciality Agriculture, Stress-
Agriculture
Climate-Smart Agriculture (Resilient varieties and breeds)
Enhanced Input Use Efficiency (Reduced cost of
cultivation)
Health Management (genomics, diagnostics, vaccines, One
Health approach)
Farm Mechanization, Energy Management, Primary
Processing and value addition

Animal Husbandry: An Ancient
Practice in India
Dates back to 6-10 millennia
Became symbol of socio-
economic status & religious
Seals from Harappa site
depicting domestic and wild
animals underline
significance of animals.
Vedic people worshipped cow
as goddess Laxmi
Vedic wars fought to protect
animal wealth
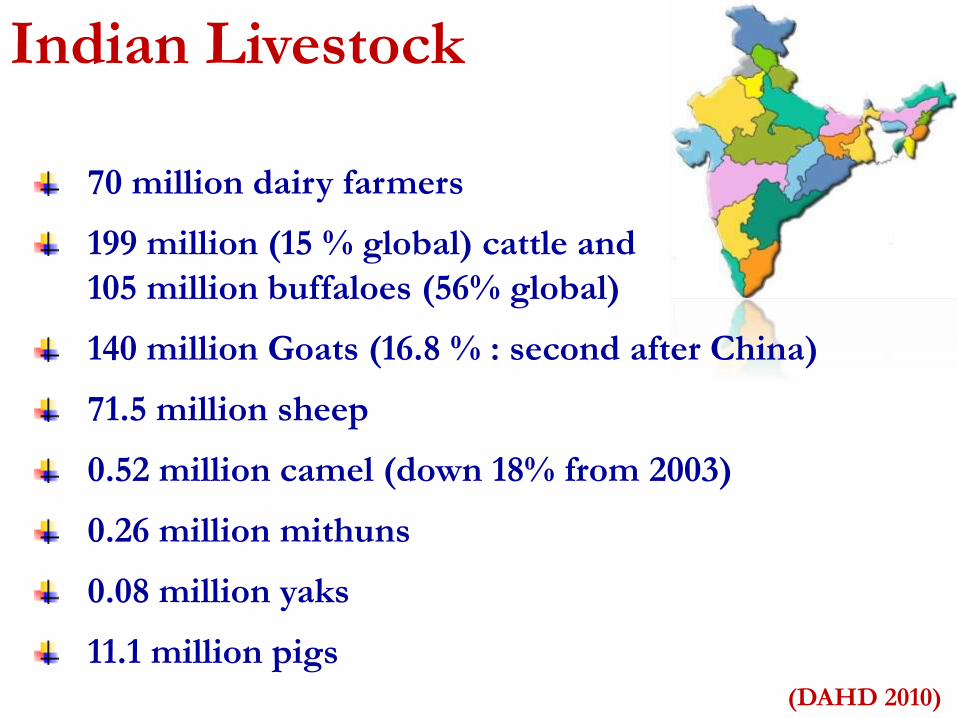
70 million dairy farmers
199 million (15 % global) cattle and
105 million buffaloes (56% global)
140 million Goats (16.8 % : second after China)
71.5 million sheep
0.52 million camel (down 18% from 2003)
0.26 million mithuns
0.08 million yaks
11.1 million pigs
Indian Livestock
(DAHD 2010)

Livestock Production at a Glance
CommodityPresent Annual
Production
Rank in the
World
Demand by
2020
Milk (million tonnes) 127.3 I 152
Meat (million tonnes) 5.1 V 11
Eggs ( in billions) 65.5 III 88
Fish (million tonnes) 8.3 II 12

Contribution of Livestock GDP
0
5
10
15
20
25
30
2004-05 2005-06 2006-07 2007-08 2208-09 2009-10 2010-11
16.04 15.4614.69 14.29
13.3612.41 12.34
4.02 3.9 3.74 3.63 3.68 3.58 3.37
25.04 25.2 25.46 25.39
27.5928.86
27.28
Ag. (%) Total GDP AH (%) to Total GDP AH (%) to Ag. GDP

1950-51 1968-69 1990-91 2006-07 2007-08 2008-09 2009-10 2010-11 2011-12
17.0 21.2
53.9
102.6107.9
112.2 116.4121.8 127.3124.0
112.0
176.0
251.0260.0
266.0273.0
281.0
Milk Production (MT) Per Capita Availability (gm/day)
Milk
Production

Meat Production (million tonnes)
1998-99 2002-03 2006-07 2007-08 2008-09 2009-10 2010-11 2011-12
1.92.1
2.3
4.04.2
4.5
4.95.1

1950-51 1968-69 1990-91 2006-07 2007-08 2008-09 2009-10 2010-11 2011-12
1.8
5.3
21.1
50.7
53.655.6
60.3
63.065.5
5.0
10.0
25.0
42.0
47.0
49.051.0
53.0
Egg (billion nos.) Per Capita Availability (nos/annum)
Poultry
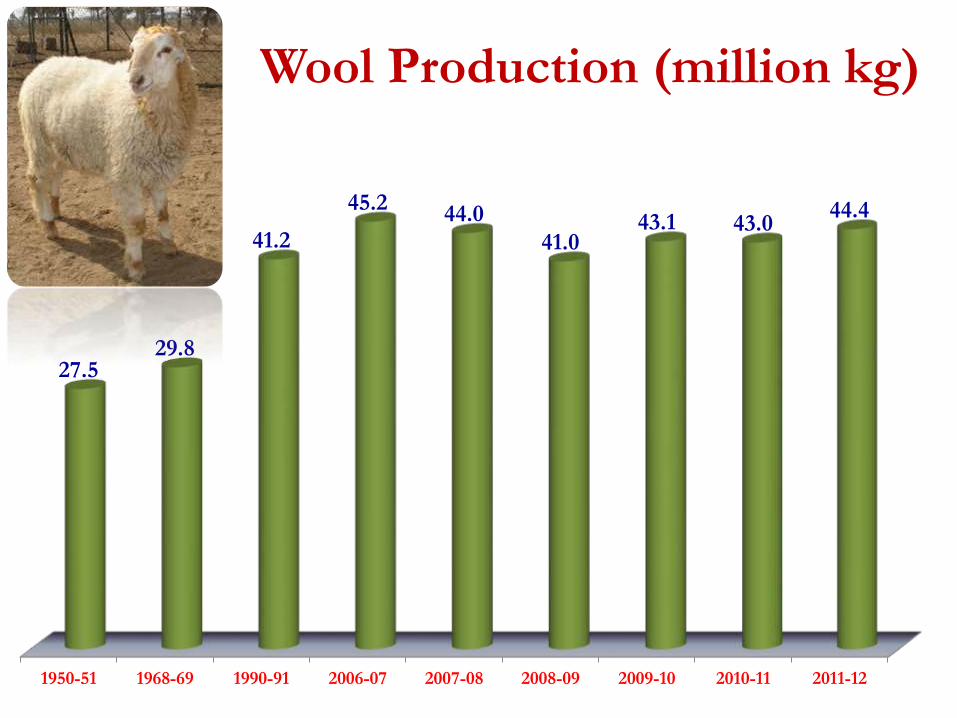
Wool Production (million kg)
1950-51 1968-69 1990-91 2006-07 2007-08 2008-09 2009-10 2010-11 2011-12
27.529.8
41.2
45.244.0
41.043.1 43.0
44.4

Rural poultry strains
Gir Cattle
Murrah Buffalo
Improved Germplasm
Improved goat
germplasm
Marwari Horse
Mewari Camel
Crossbred cattle
germplasm

Frieswal crossbred cattle with milk yield of 3000 kg/lactation
Vrindavani cattleFrieswal cow
Improved Murrah buffalo yielding >2500 Kg/lactation
Improved germplasm
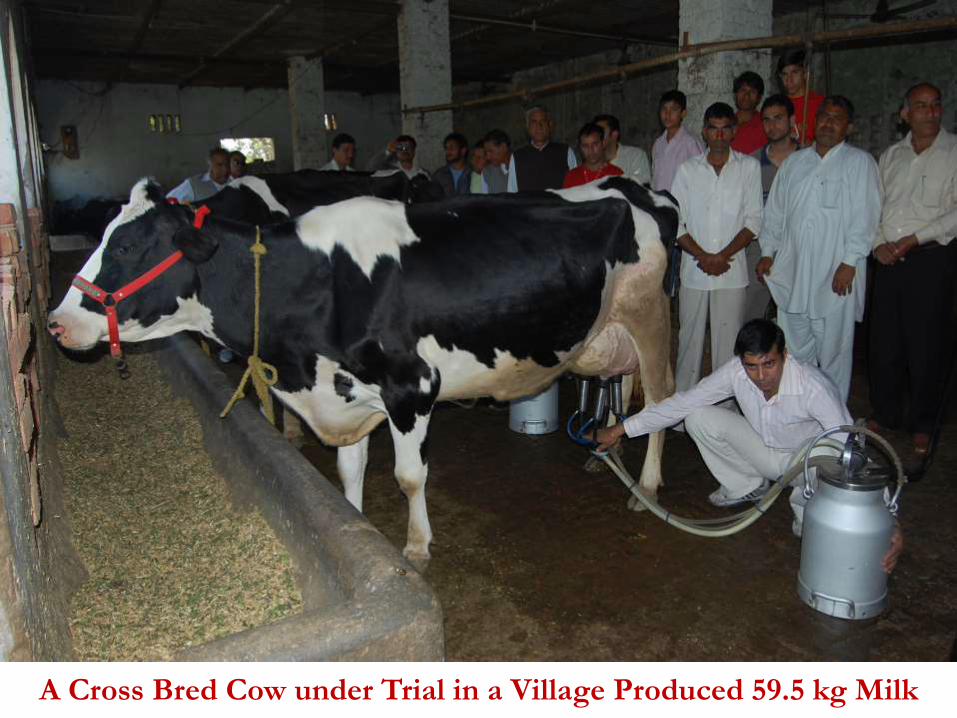
A Cross Bred Cow under Trial in a Village Produced 59.5 kg Milk

Garole X Malpura Crosses of sheep (introgression of FeC B- twinning gene)
Improved germplasm of goats with increased weight gain and milk production
Jamunapari Sirohi

Meghalaya Local Ghungroo Duroc
Hampshire Crossbred piglets
Pig Germplasm
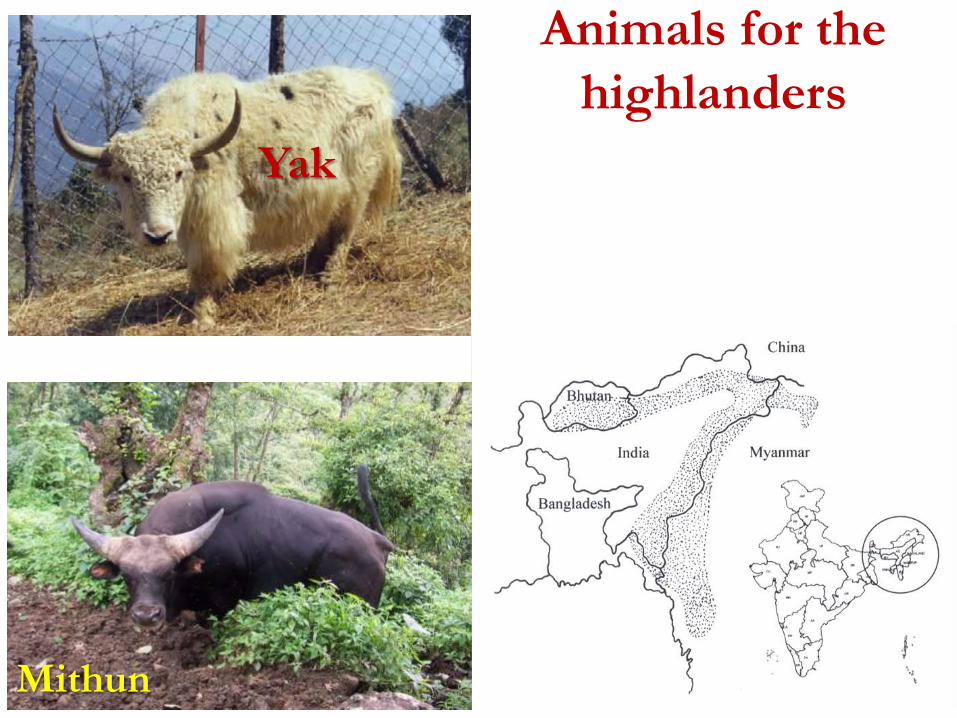
Animals for the
highlanders
Yak
Mithun
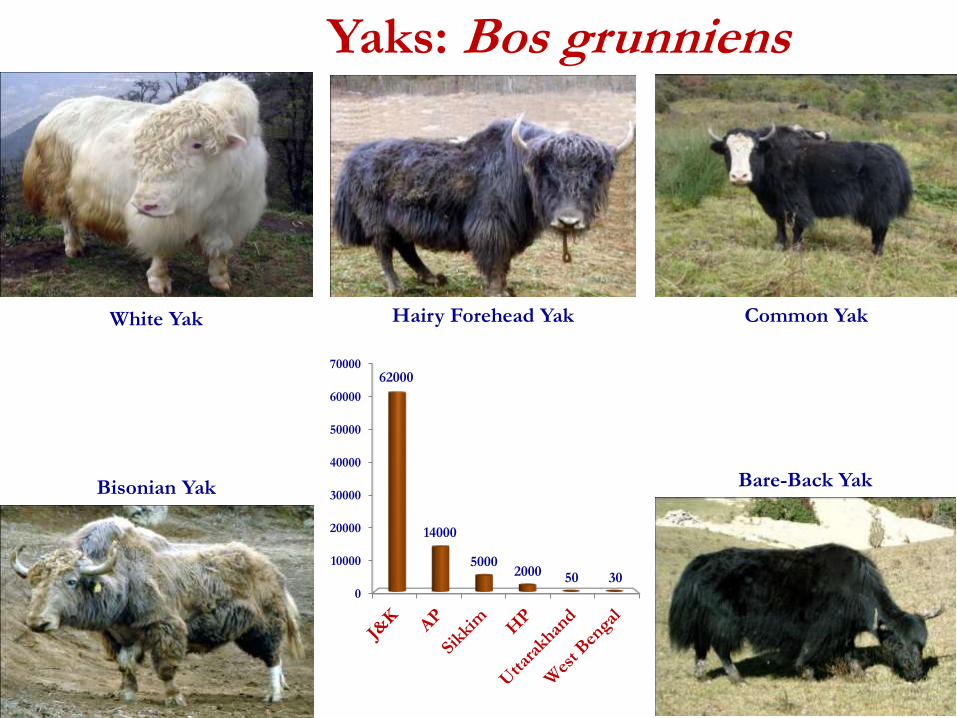
Yaks: Bos grunniens
White Yak Hairy Forehead Yak Common Yak
Bisonian Yak Bare-Back Yak
0
10000
20000
30000
40000
50000
60000
7000062000
14000
50002000 50 30
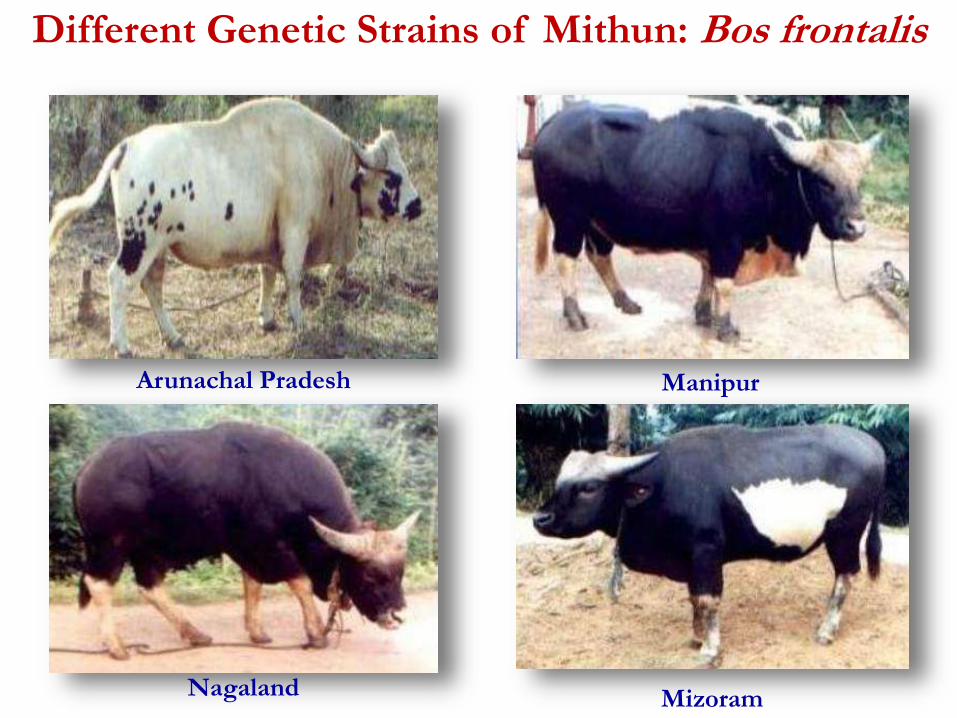
Different Genetic Strains of Mithun: Bos frontalis
Arunachal Pradesh Manipur
Nagaland Mizoram
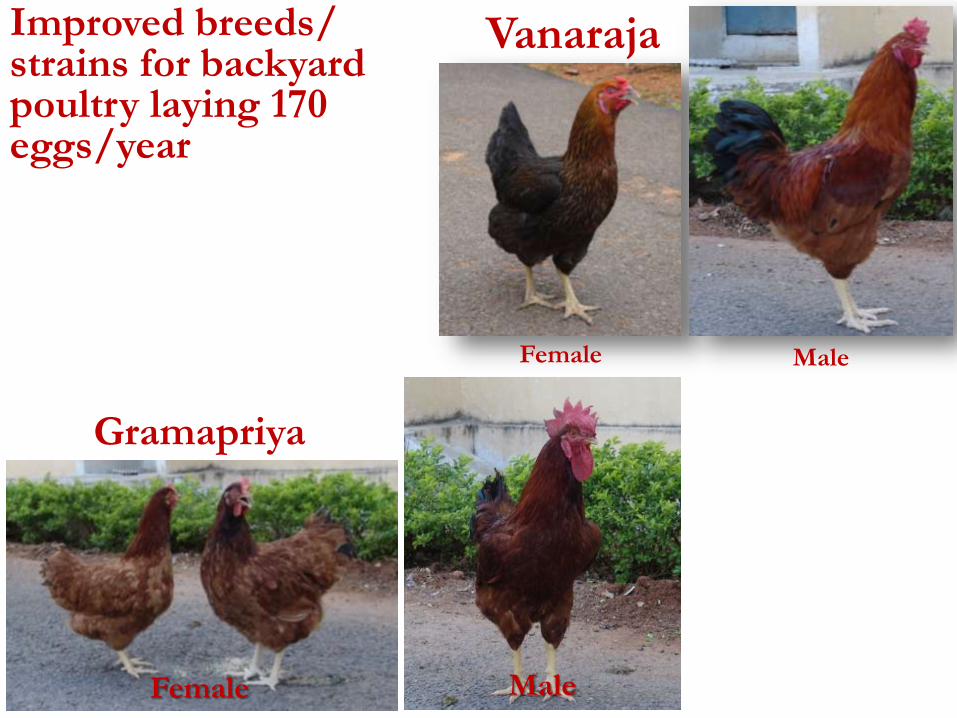
Improved breeds/ strains for backyard poultry laying 170 eggs/year
Female
Gramapriya
Vanaraja
Male
Female Male

34
Improved strains for Quails, Ducks, Turkey, Guinea Fowl

0
2
4
6
8
10
12
14
16
18
20
Broiler Layer Rural
3 3
1
6 6
10
76
191980 - 1990
1990 - 2000
2000 - 2010
Poultry strains developed over a period
Breeds with
Over 300
eggs/year

Global Warming
There is a gradual
increase in the
average temperature
of the Earth’s
atmosphere in the
last 100 years…It
has risen about 1°C
since 1900…
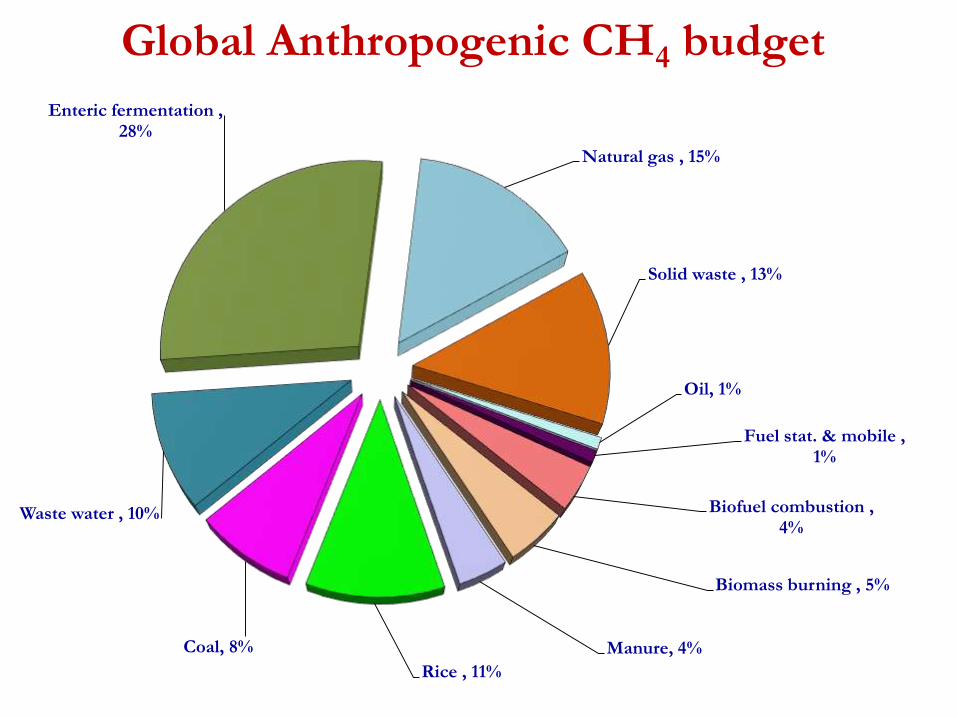
Global Anthropogenic CH4 budget
Enteric fermentation , 28%
Natural gas , 15%
Solid waste , 13%
Oil, 1%
Fuel stat. & mobile , 1%
Biofuel combustion , 4%
Biomass burning , 5%
Manure, 4%
Rice , 11%
Coal, 8%
Waste water , 10%
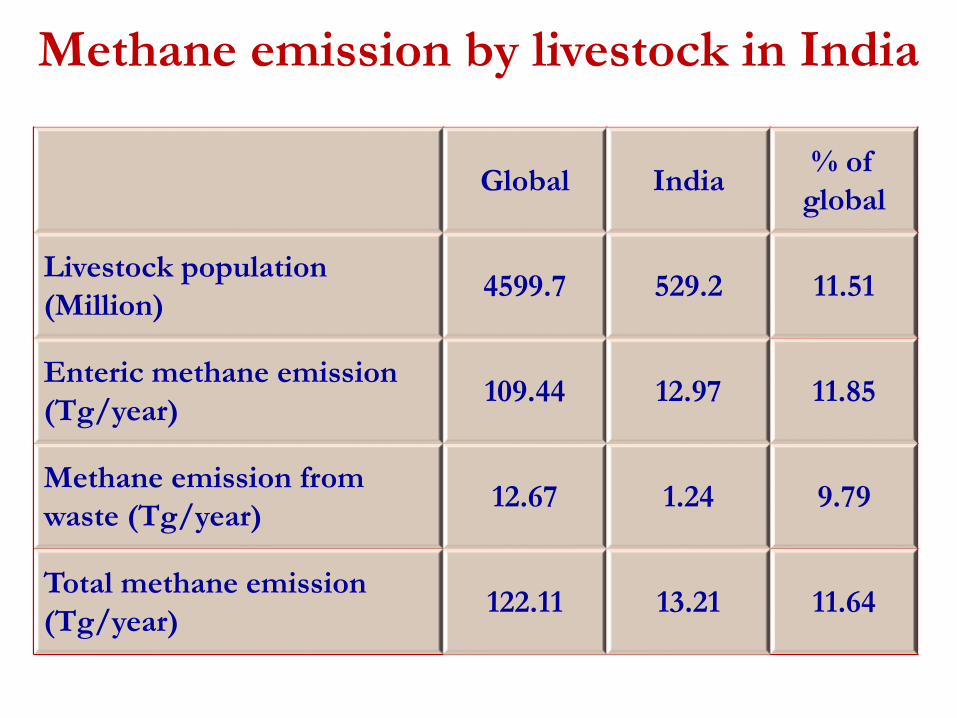
Methane emission by livestock in India
Global India% of
global
Livestock population
(Million) 4599.7 529.2 11.51
Enteric methane emission
(Tg/year)109.44 12.97 11.85
Methane emission from
waste (Tg/year)12.67 1.24 9.79
Total methane emission
(Tg/year)122.11 13.21 11.64
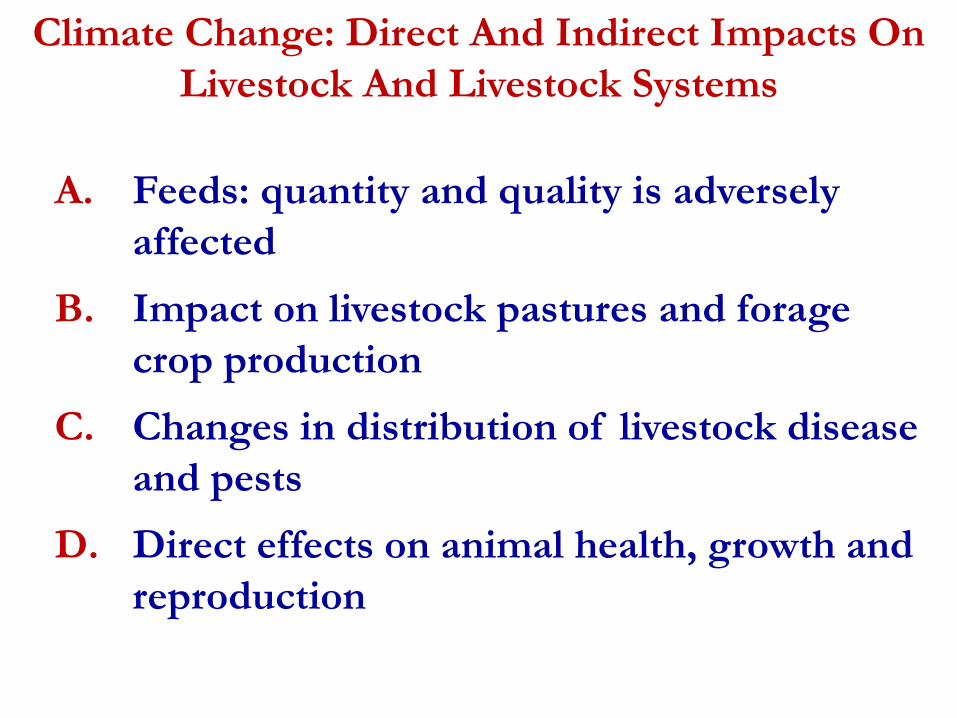
A. Feeds: quantity and quality is adversely
affected
B. Impact on livestock pastures and forage
crop production
C. Changes in distribution of livestock disease
and pests
D. Direct effects on animal health, growth and
reproduction
Climate Change: Direct And Indirect Impacts On
Livestock And Livestock Systems
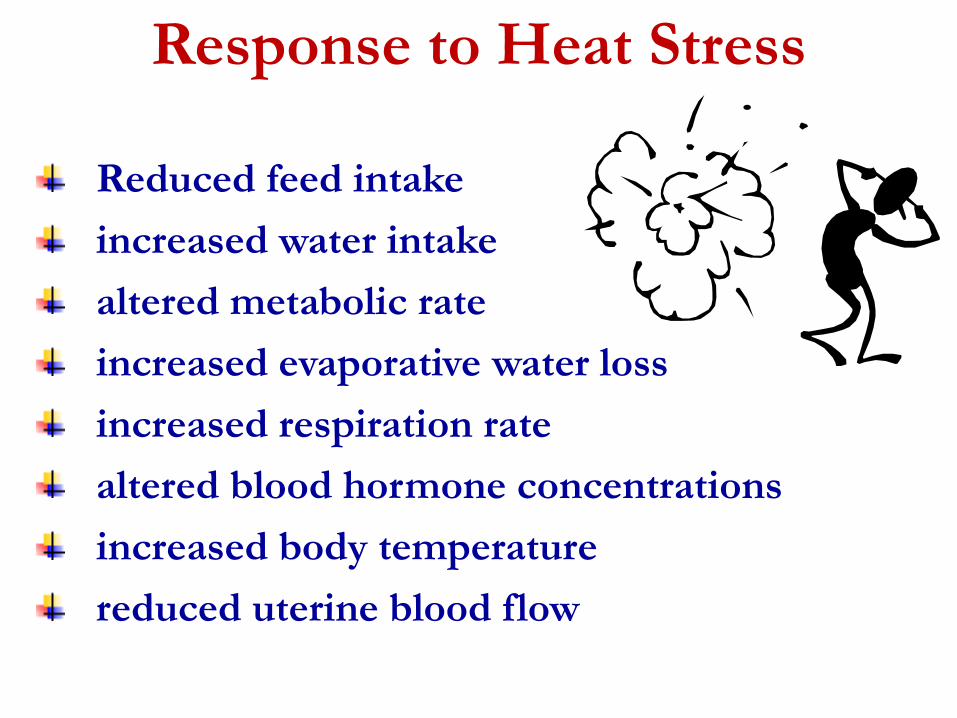
Response to Heat Stress
Reduced feed intake
increased water intake
altered metabolic rate
increased evaporative water loss
increased respiration rate
altered blood hormone concentrations
increased body temperature
reduced uterine blood flow
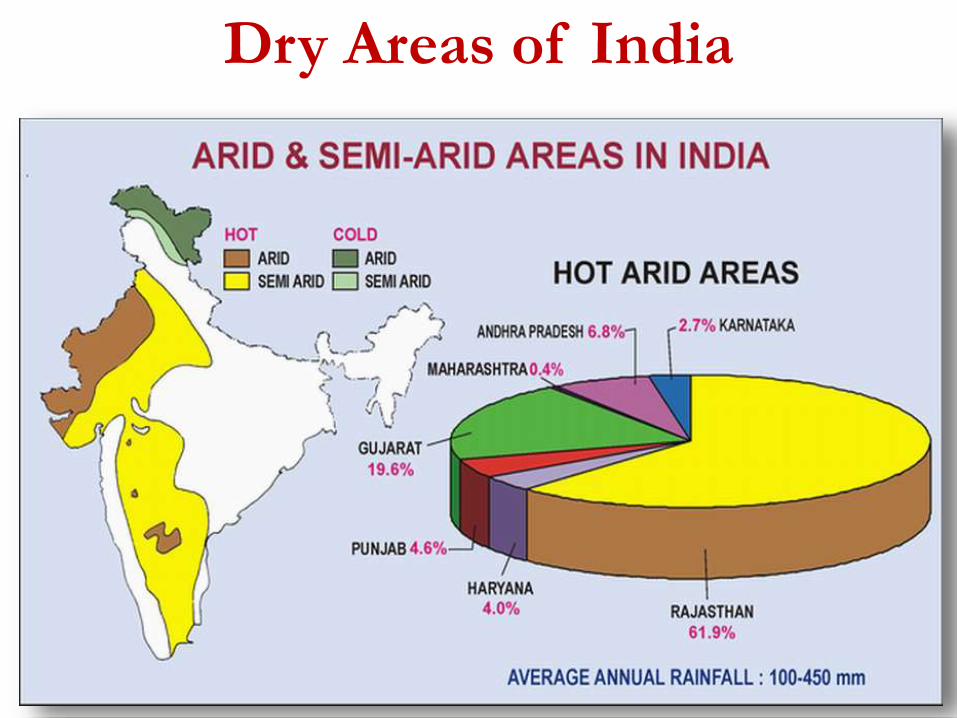
Dry Areas of India

Peculiarities of Arid Zone
Low & erratic rainfall <400 mm (cv. 80-40%)
High Temperature (45-48ºC)
High wind velocity (20-40 km hr-1)
Frequent Drought
Sandy Soil with Low Soil WHC
Poor Soil Fertility
Degraded Natural Vegetation
Wind & Water Erosion
Acute Water Scarcity
Poor Water Resources
Lowering Ground water Table
Hostile Climate, Fragile Natural Resources,
Socio-Economic Constraints, Poor Market facilities
Low Biomass Production/ Crop Failures (not dependable)
Animal Husbandry + Perennial Vegetation provides stability

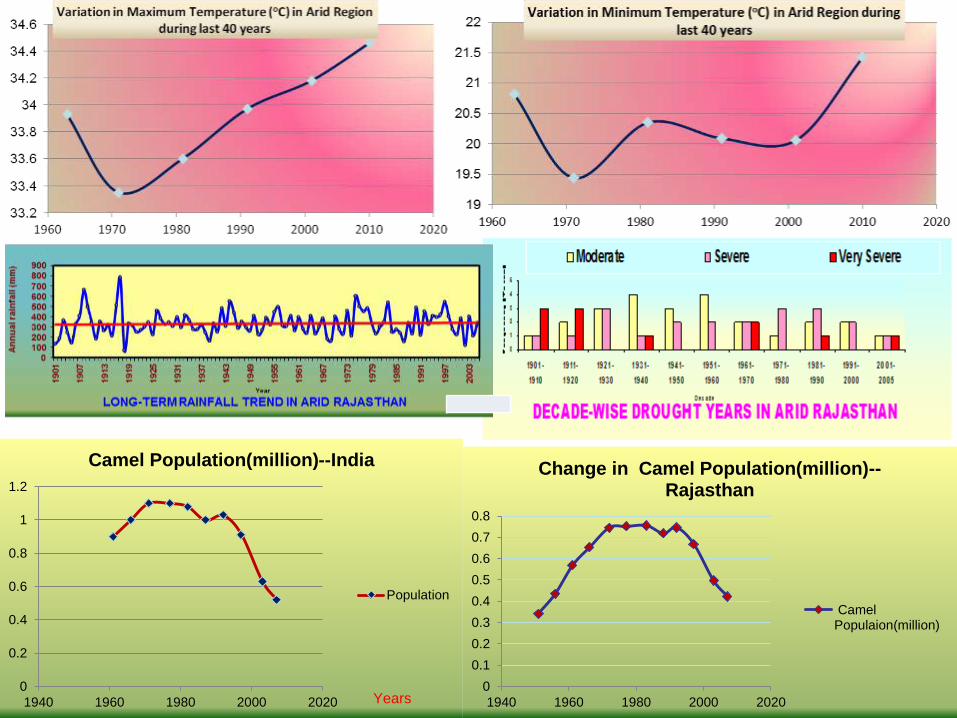
Camel
Production
Thrive well and reproduce in
semi-arid and arid areas
Lower water requirements
and excrete less water and
nitrogen in urine
The amount of digested cell
wall carbohydrate is much
larger
Hsp70 gene cluster
(HSPA1A,HSPA1B &
HSPA1L) are actively
transcribed in different camel
tissues even under normal
physiological conditions
Declining population of camels by
50% during the last 4 decades is a
matter of serious concern
0
0.1
0.2
0.3
0.4
0.5
0.6
0.7
0.8
1940 1960 1980 2000 2020
Change in Camel Population(million)--Rajasthan
CamelPopulaion(million)
0
0.2
0.4
0.6
0.8
1
1.2
1940 1960 1980 2000 2020
Camel Population(million)--India
Population
Years
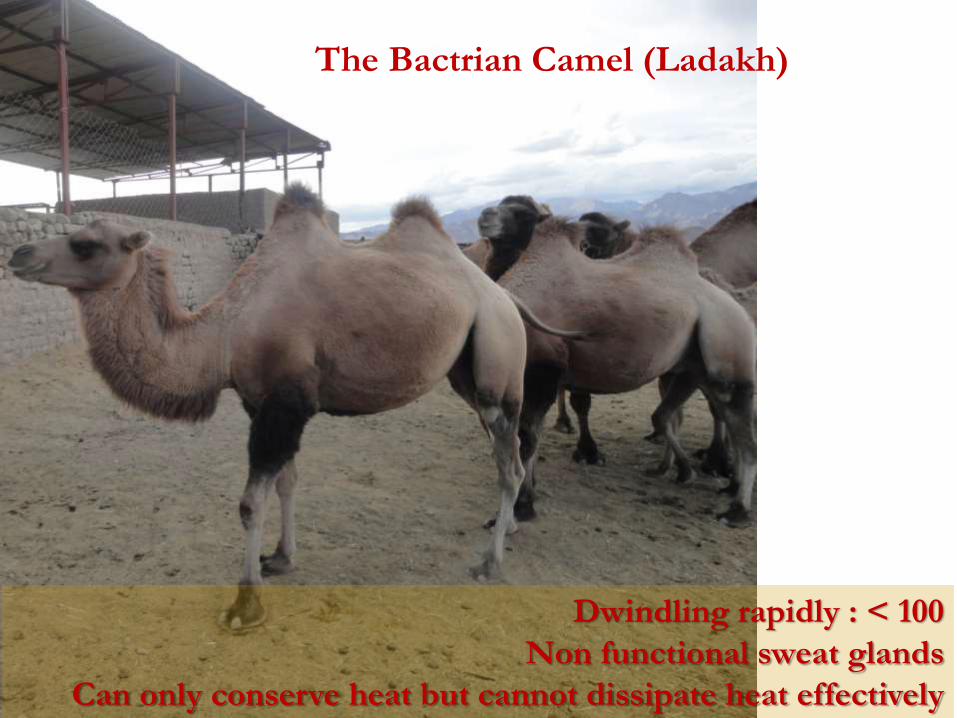
The Bactrian Camel (Ladakh)
Dwindling rapidly : < 100
Non functional sweat glands
Can only conserve heat but cannot dissipate heat effectively
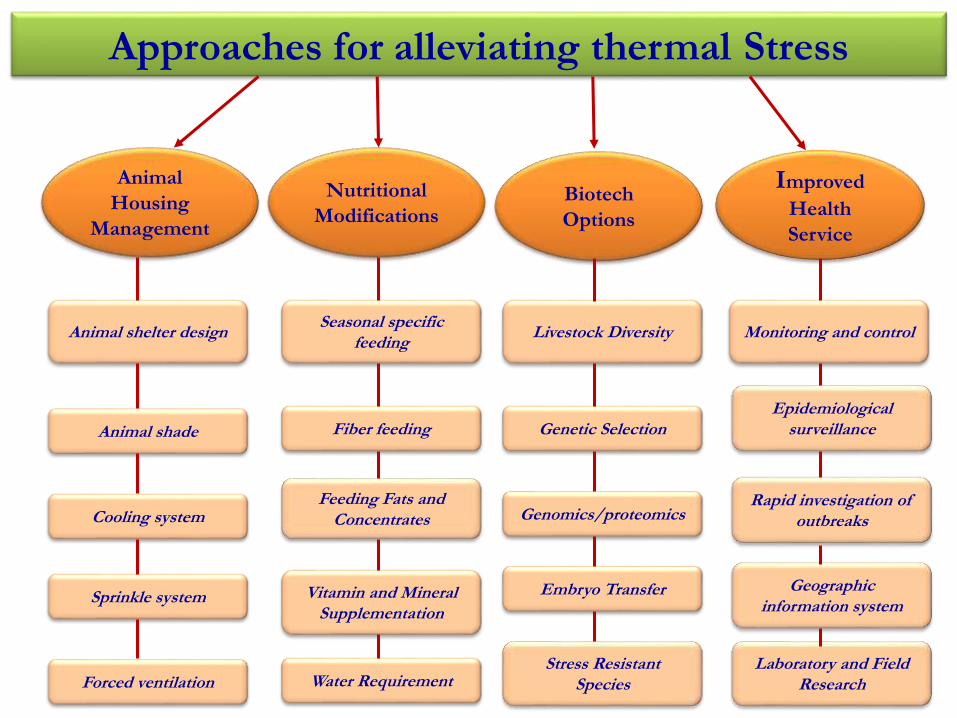
Approaches for alleviating thermal Stress
Animal
Housing
Management
Nutritional
ModificationsBiotech
Options
Improved
Health
Service
Animal shelter design
Animal shade
Cooling system
Sprinkle system
Forced ventilation
Seasonal specific feeding
Fiber feeding
Feeding Fats and Concentrates
Vitamin and Mineral Supplementation
Water Requirement
Livestock Diversity
Genetic Selection
Genomics/proteomics
Embryo Transfer
Stress Resistant Species
Monitoring and control
Epidemiological surveillance
Rapid investigation of outbreaks
Geographic information system
Laboratory and Field Research

Milk Production in India and the United States

Milk Production Estimates
AnimalNo. in milk
(in millions)Av. Yd. (kg/d)
Milk (million
tonnes)%
Indigenous
cows
28.8
(53%)2.14 22.5 20.3
Crossbred
cows
10.1
(65%)6.87 25.4 22.8
Buffaloes35.5
(67.2%)4.57 59.2 53.3
Goats 28.9 0.37 3.9 3.5
Issues and Constraints
Feed and fodder availability
Poor per capita milk yield
Livestock health
Livestock infertility
Clean milk and Meat Production
Climate Change
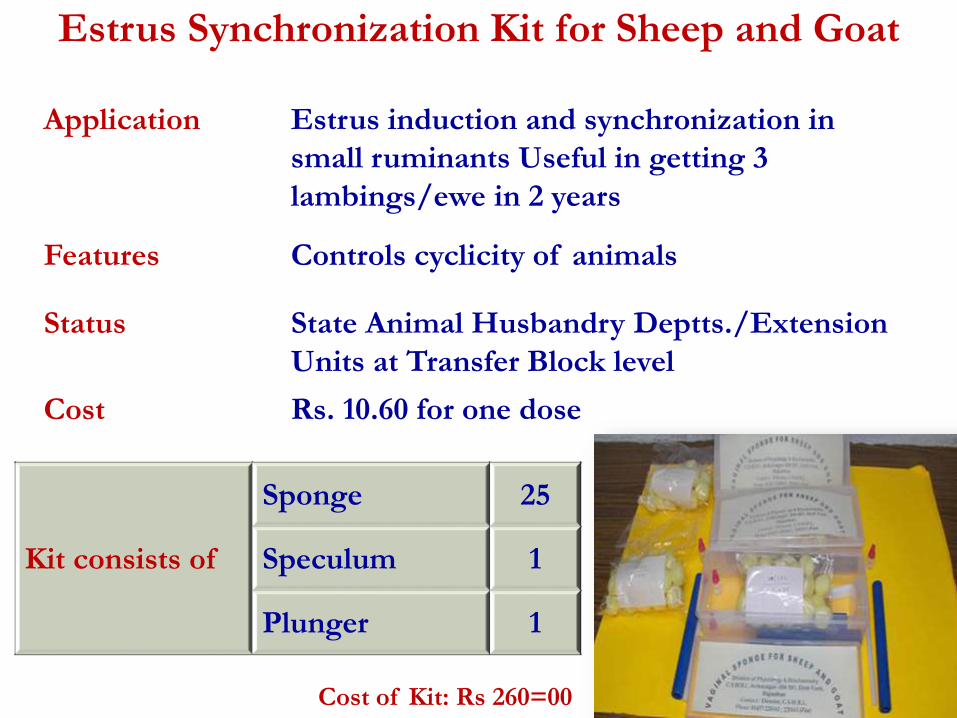
Cost of Kit: Rs 260=00
Estrus Synchronization Kit for Sheep and Goat
Application Estrus induction and synchronization in
small ruminants Useful in getting 3
lambings/ewe in 2 years
Features Controls cyclicity of animals
Status State Animal Husbandry Deptts./Extension
Units at Transfer Block level
Cost Rs. 10.60 for one dose
Kit consists of
Sponge 25
Speculum 1
Plunger 1

A farmer Shri Suresh Kumar, Village Kunjpura, Karnal, Haryana with his buffalo
which was successfully treated for anestrus and administered ovsynch protocol.
The animal conceived and delivered a calf

Buffalo which had not conceived for 5 years belonging to Mr. Suresh Pal, s/o
Mr. Mahiram, Village - Pundrak was treated with ovsynch and declared pregnant
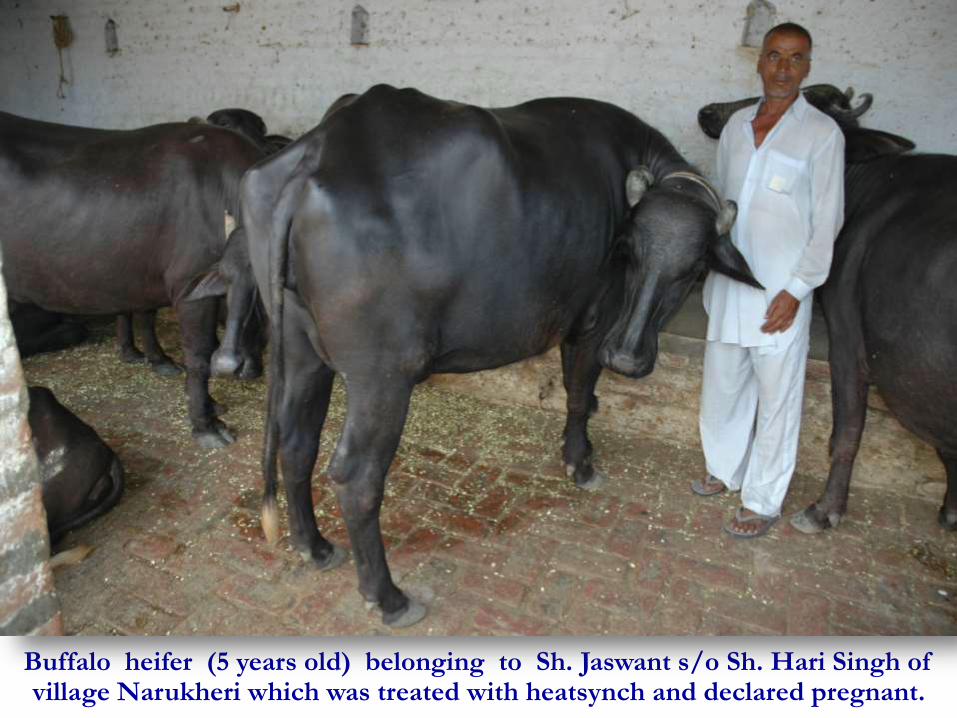
Buffalo heifer (5 years old) belonging to Sh. Jaswant s/o Sh. Hari Singh of village Narukheri which was treated with heatsynch and declared pregnant.
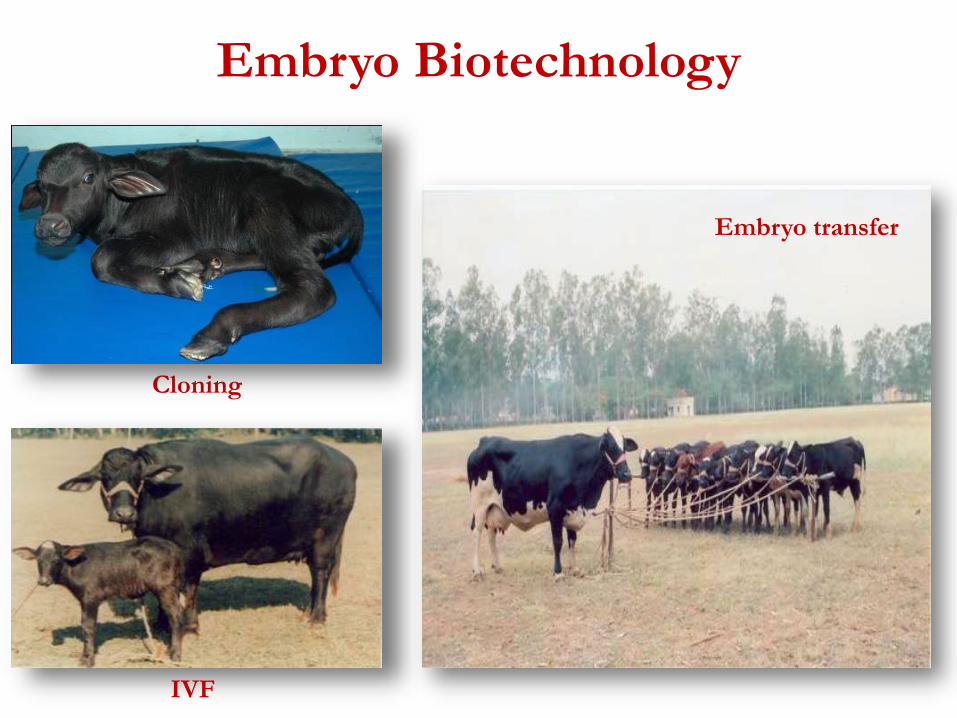
Embryo Biotechnology
Cloning
Embryo transfer
IVF

55
Identical Twins of Sahiwal from Split Embryos First ever IVF goat kid in
India
World’s first cloned buffalo calf was
produced using economical Handmade
Cloning Technique
World’s second cloned buffalo calf
named ‘Garima’ was produced using
Handmade cloning technique
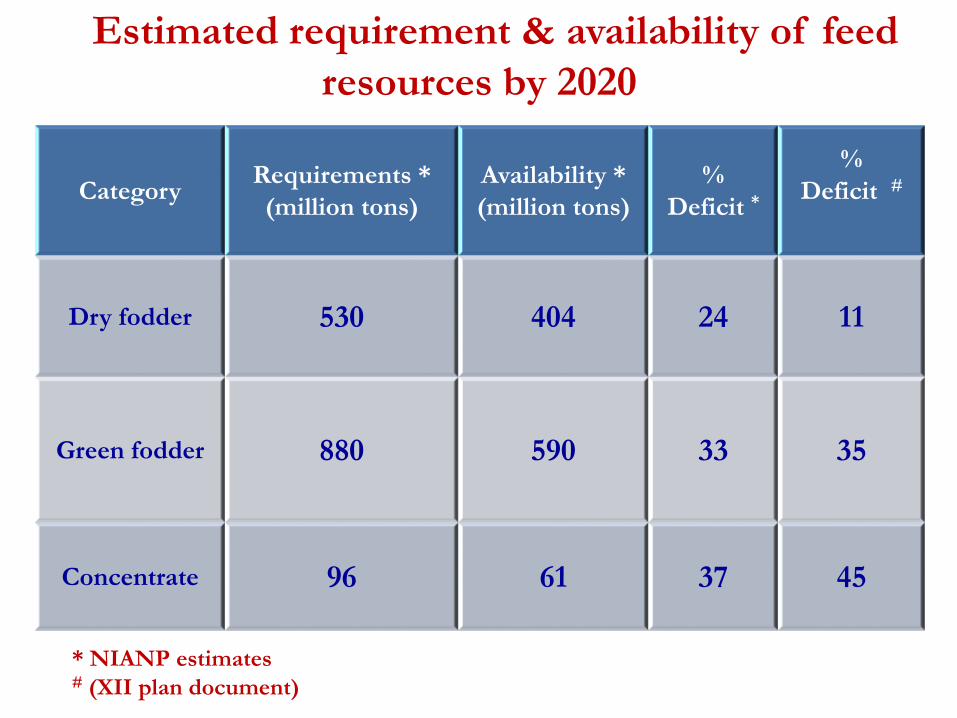
Estimated requirement & availability of feed
resources by 2020
CategoryRequirements *
(million tons)
Availability *
(million tons)
%
Deficit *
%
Deficit #
Dry fodder 530 404 24 11
Green fodder 880 590 33 35
Concentrate 96 61 37 45
* NIANP estimates# (XII plan document)
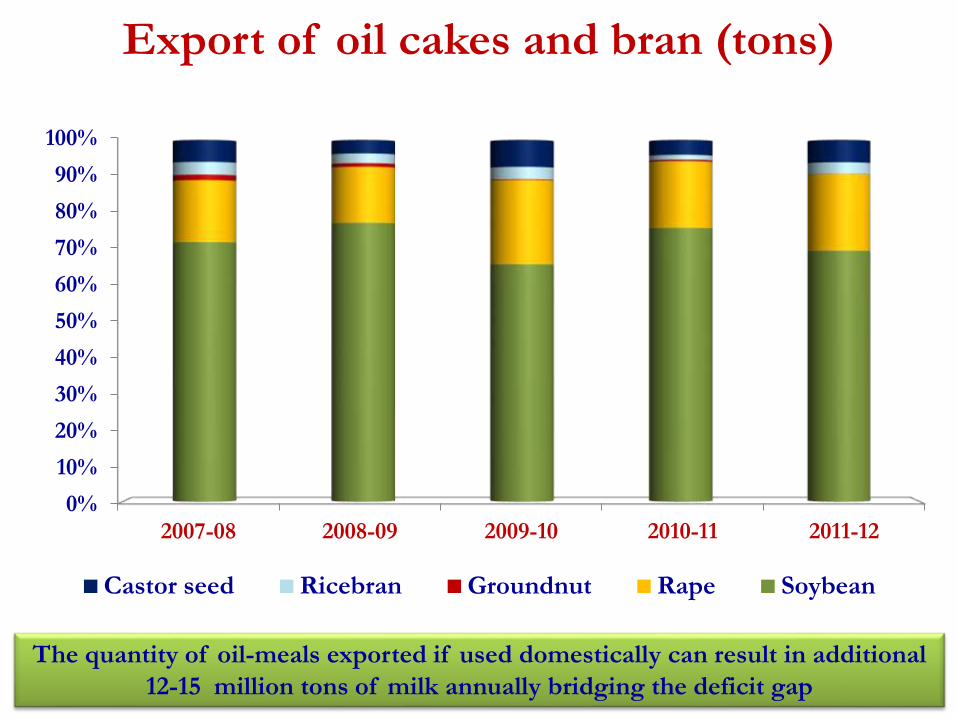
Export of oil cakes and bran (tons)
The quantity of oil-meals exported if used domestically can result in additional
12-15 million tons of milk annually bridging the deficit gap
0%
10%
20%
30%
40%
50%
60%
70%
80%
90%
100%
2007-08 2008-09 2009-10 2010-11 2011-12
Castor seed Ricebran Groundnut Rape Soybean

Changes in the area under fodder, forest, fallow, pasture and cultivable wasteland
Category & area (million Ha) 1990 2010 2020*% change over
1990
Gross cropped areas
(Excluding fodder crops)174.1 188.1 196.8 13.0
Fodder crops 8.3 7.9 7.09 -14.2
Forest 67.4 69.6 69.3 2.8
Permanent pastures & grazing 11.3 10.2 9.5 -16.0
Misc. tree cops & groves not
included3.8 3.3 3.1 -17.1
Cultivable wasteland 15.1 12.9 11.7 -22.2
Current fallow 13.7 15.7 14.4 5.1
Other fallow 10.3 9.8 9.8 -4.7
Declining fodder area, CPRs and plateau in the area & productivity of food crops. Waste and fallow lands are under exploited due to labour shortage, uncertain rainfall and increased cost of inputs
* NIANP Projections
CONSTRAINTS

Concentrate FeedTechnology options
Strategic supplementation of limiting nutrients
Ration balancing with local feed resources
Alternate feed resources
Researchable issues
Precision feeding
Exploring newer unconventional feeds
Enhancing bio-availability of nutrients
Policy issues
Export of oil cakes and by products
Quality and safety assurance of animal feeds
APPROACHES
Alternate feeds
Unconventional cakes

Dry roughage
Technology options
Popularization of chaffing, baling
Urea-treatment process
Complete feed block technology
Researchable issues
Food-feed crops
Straw quality assessment
Lignin biodegradation
Appropriate farm machinery for minimizing biomass
loss
Policy issues
Incentives for better crop residue management to
prevent the burning/alternate uses
Fodder ware houses
Subsidizing/custom hiring of the machineries for better
fodder management
APPROACHES

APPROACHES
Fruit & vegetable waste
Azolla
Green Fodder
Technology options
Silage and hay making
Azolla cultivation
Varieties for different agro-climatic zones
Improved cropping system
Researchable issues
Hydroponics
Newer varieties (higher yield, sustain
environmental & soil stress)
Policy issues
Better utilization of common property resources
Strengthening linkage between ICAR-DAHDF-
Milk Federation-NGOs
Strengthening of fodder seed chain
NSC & SSC to be mandated to promote fodder
seeds

Hydroponic green feed production in poly house system

Application Complete feed with all nutrients for improving
production
Features Locally available feed resources can beutilized
to prepare balanced ration . Easy to handle and
transport. Aids in resource based feeding
Status Commercialized
Cost Rs. 16-18 for 3.5 Kg Block
Feed Block for livestock

Bypass Protein (UDP) Feed
Application By incorporating 50% of total protein as by-pass
protein in concentrate mixture/ compound feed
Features Useful for high producing animals (>10 litres)
Status Available commercially
Cost Treatment cost Rs. 60 to 80 per 100 kg
protein supplement

Area Specific Mineral Mixture
Application As feed supplement
Features Provides specific deficient micronutrients and
improves productive and reproductive efficiency
by 20% and 50-60% respectively
Mode of
Transfer
Through milk federations/Feed
manufacturers/AH departments/extension units
at block level
Cost Rs. 0.63 for 40g
i.e. dose/adult/day

Features Antigen/ Antibody based kits for diseases like
FMD, PPR, Blue Tongue, Brucella, IBR, etc.
Status Some kits commercialized, others awaiting
commercialization
Economic
Benefits
Prevention of loss due to
diseases with resultant
economic benefits
Animal disease Diagnostic Kits

DEGCURE MIXTURE for treating
Selenium toxicity in animals
Application To be supplemented in feed or mixing
with jaggery or dough @ 30 g/day
for 30 days
Features To counter Selenium toxicity in
buffaloes
Status Technology awaiting transfer
Cost Rs. 30/kg mixture

Herbal drug for skin diseases
Application Herbal ointment to be applied on the infected
part of the skin locally once a day for 5-7 days
Features Named as Olinall’ the treatment is effective for
all kinds of skin diseases including fungal
diseases and wounds
Status Technology transferred to Pvt. Industries
Economics
Benefits
Cost effective treatment, Easy to apply, broad
spectrum for skin diseases

Animal Products
Animal Products Technology
Low cholesterol ghee, Mango Lassi with
extended shelf life, Ghee, fortified with herbs
developed.
Indigenous technology for production of
Rasmalai, kulfi, kheer mix, gulab jamun mix
with longer shelf life
Arjuna Ghee
Low CholesterolGhee
Instant Rasmalai Mix
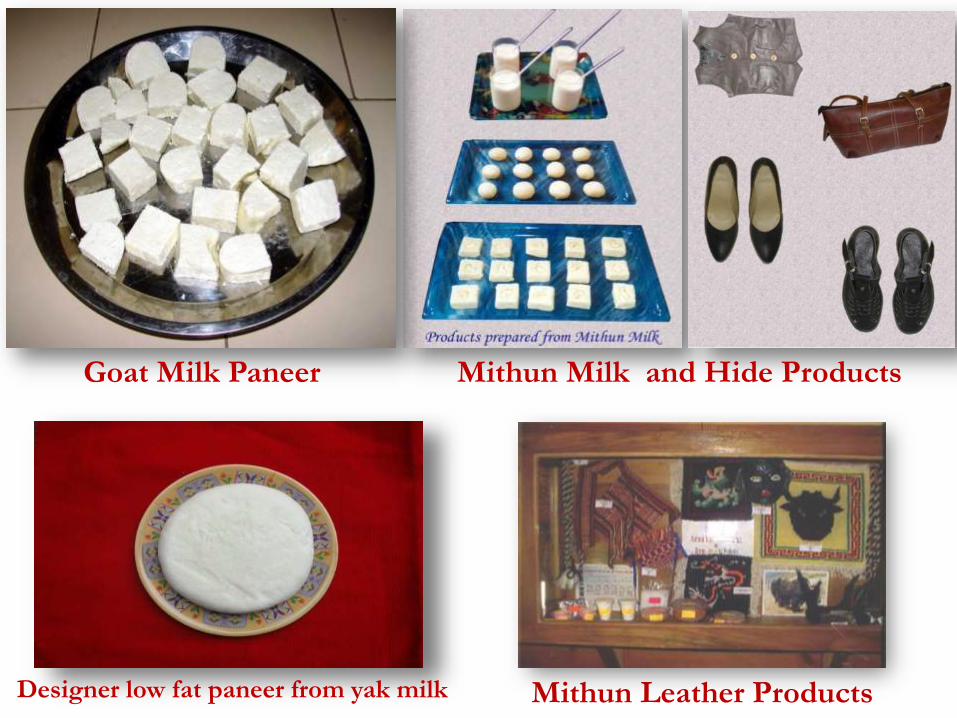
Mithun Leather Products
Goat Milk Paneer Mithun Milk and Hide Products
Designer low fat paneer from yak milk
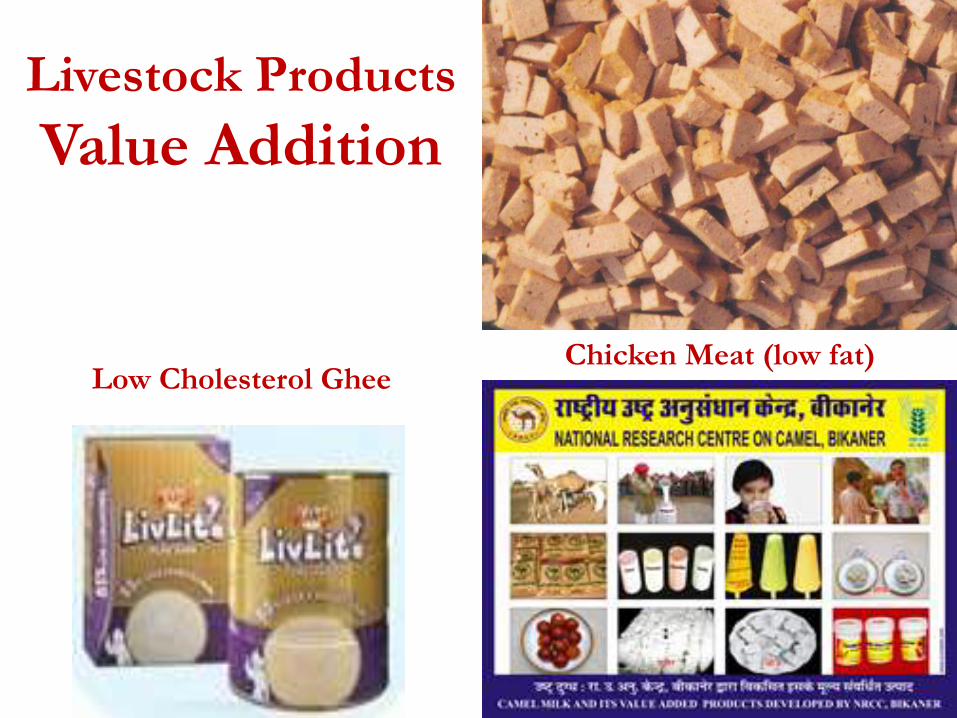
Livestock Products
Value Addition
Low Cholesterol Ghee Chicken Meat (low fat)
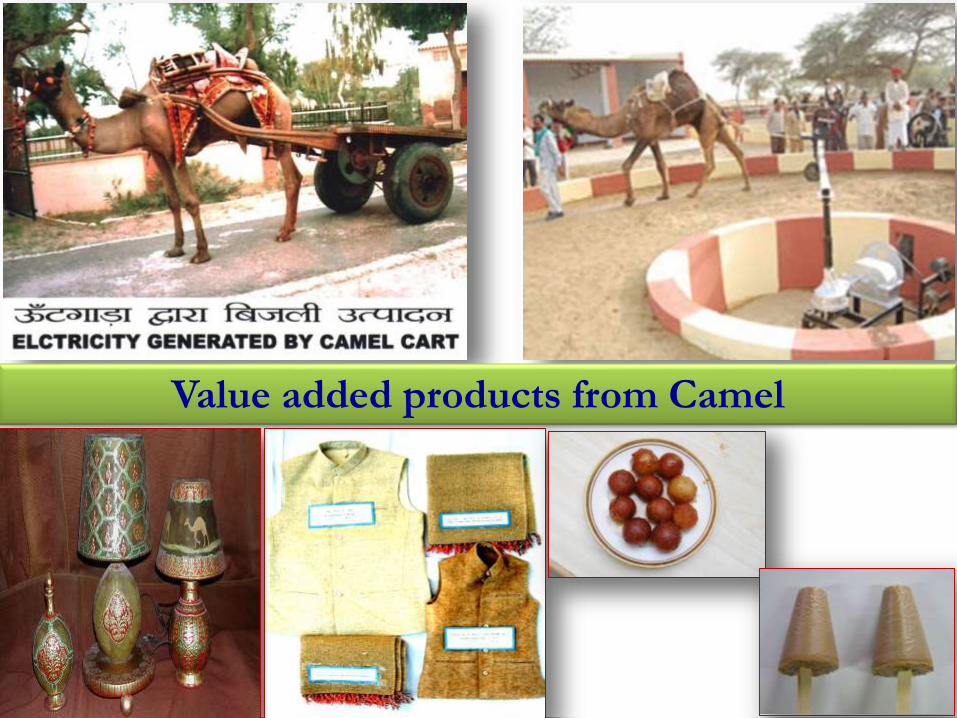
Value added products from Camel

Preservation of eggs through Oil-coating
Application Eggs are spray-coated with edible
vegetable oil containing anti-oxidant
or liquid paraffin
Features Eggs can be stored for 30 days at
ambient temperature (31C) and 120
days at refrigeration (5C)
temperature
Status Awaiting commercialization. Can be
taken up by Commercial houses/egg
processing sector
Cost Oil-coating cost Rs. 1.30/100 eggs

Pickled Eggs
Application Simple method for pickling of quail/chicken eggs
increased shelf life
Features Process can be easily practiced in rural areas much
investment, special skill and dependence on
refrigeration
Status Awaiting commercialization. Can be taken up by
Commercial entrepreneurship/ egg processing
sector
Cost Rs. 10/10 pickled quail eggs
Rs. 30/10 pickled chicken eggs

Production of Non-woven Wool Blended Felt
Application Utilization of Inferior grade rabbit wool and
length crossbred sheep wool for production of
superior quality lightweight felts
Features Felts have excellent softness, porosity or air-
permeability and absorbency. Can either be
used in the household or as medical textiles
(wound dressing, absorption padding) and
jackets
Status Can be taken up as a cottage industry
Cost of
production
Rs. 10 per sq. ft
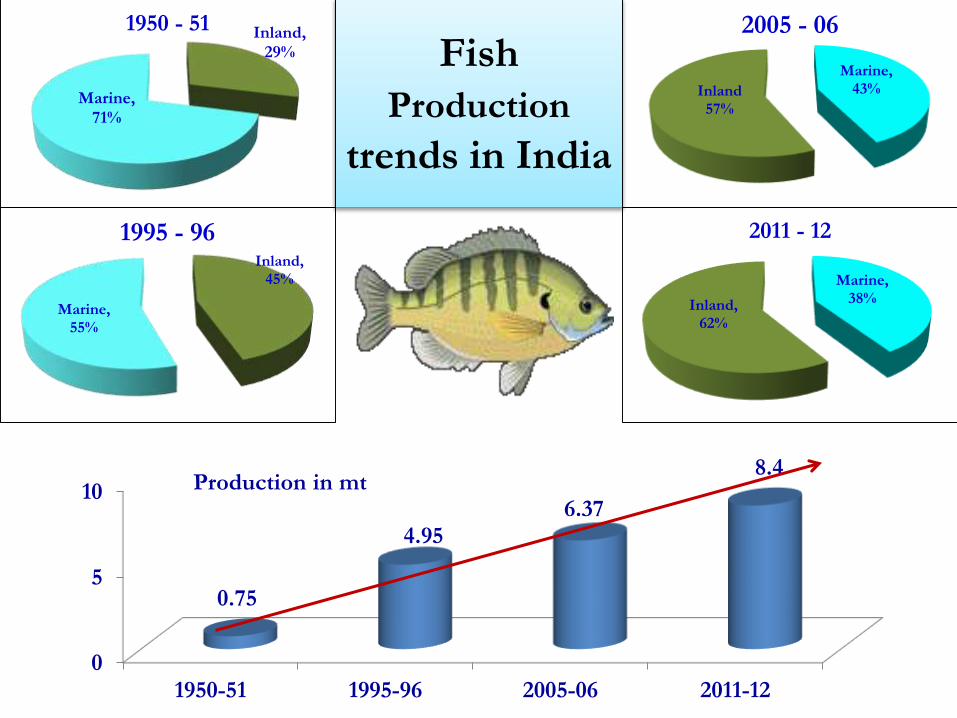
0
5
10
1950-51 1995-96 2005-06 2011-12
0.75
4.956.37
8.4
Fish
Production
trends in India
Inland, 29%
Marine, 71%
1950 - 51
Inland, 45%
Marine, 55%
1995 - 96
Marine, 43%Inland
57%
2005 - 06
Marine, 38%Inland,
62%
2011 - 12
Production in mt

Exclusive
Economic
Zone of
India

Potential of Fishery Resources in the Indian
Exclusive Economic Zone
58%35%
1% 6%
0-50 50-200 200-500 Oceanic
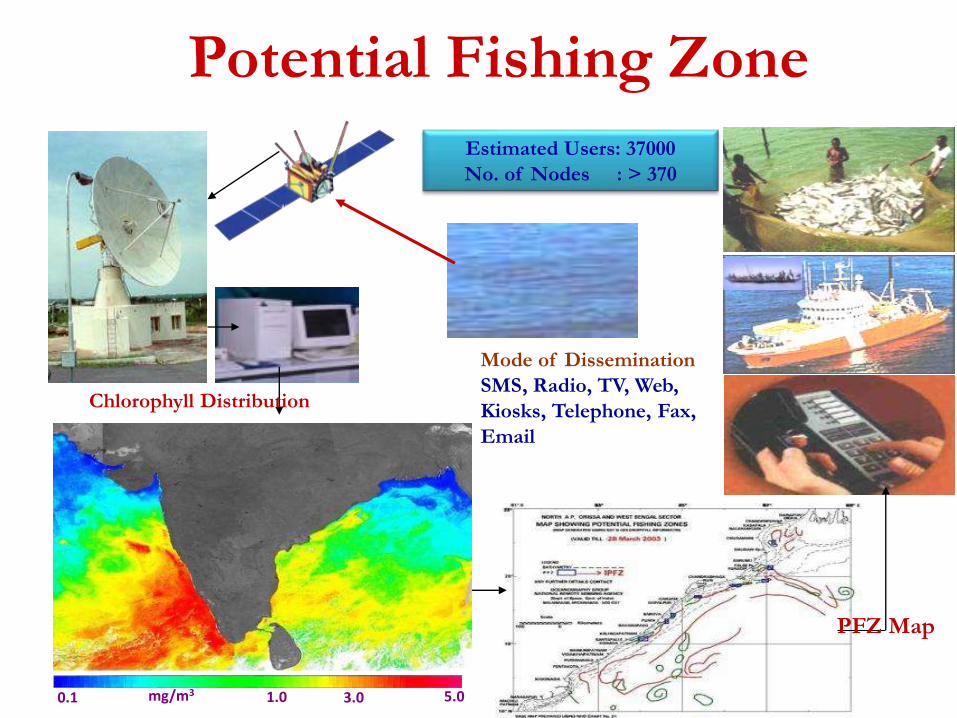
Potential Fishing Zone
Chlorophyll Distribution
PFZ Map
0.1 mg/m3 5.03.01.0
Estimated Users: 37000
No. of Nodes : > 370
Mode of Dissemination
SMS, Radio, TV, Web,
Kiosks, Telephone, Fax,
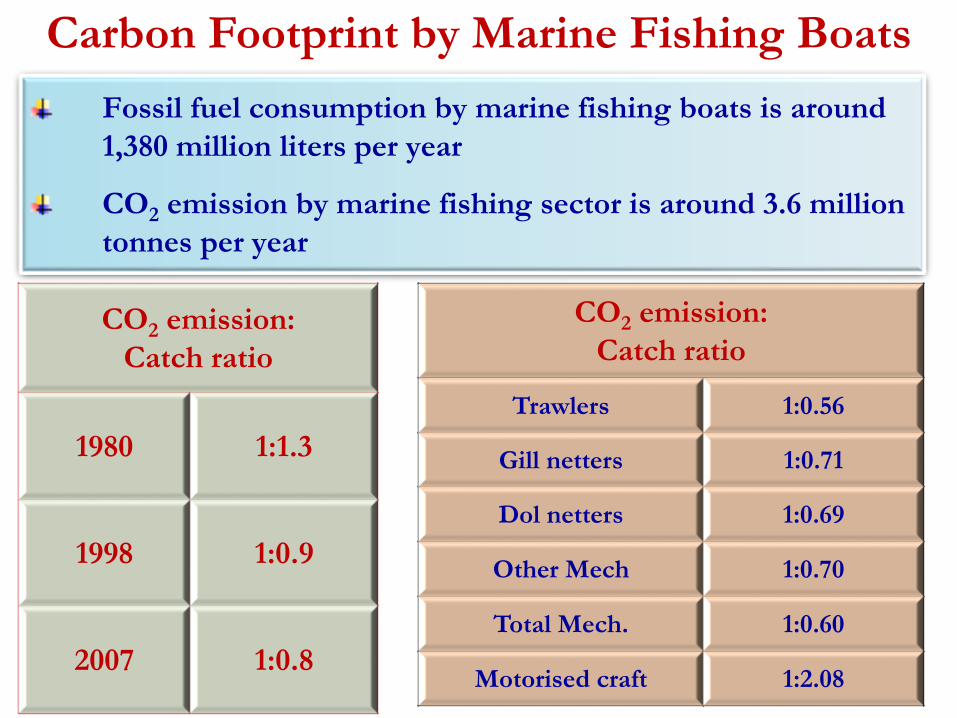
Carbon Footprint by Marine Fishing Boats
CO2 emission:
Catch ratio
1980 1:1.3
1998 1:0.9
2007 1:0.8
CO2 emission:
Catch ratio
Trawlers 1:0.56
Gill netters 1:0.71
Dol netters 1:0.69
Other Mech 1:0.70
Total Mech. 1:0.60
Motorised craft 1:2.08
Fossil fuel consumption by marine fishing boats is around
1,380 million liters per year
CO2 emission by marine fishing sector is around 3.6 million
tonnes per year

Gold Fish –
Fish Gold
Annual Global trade:
US $ 900 million

AQUA TOURISM
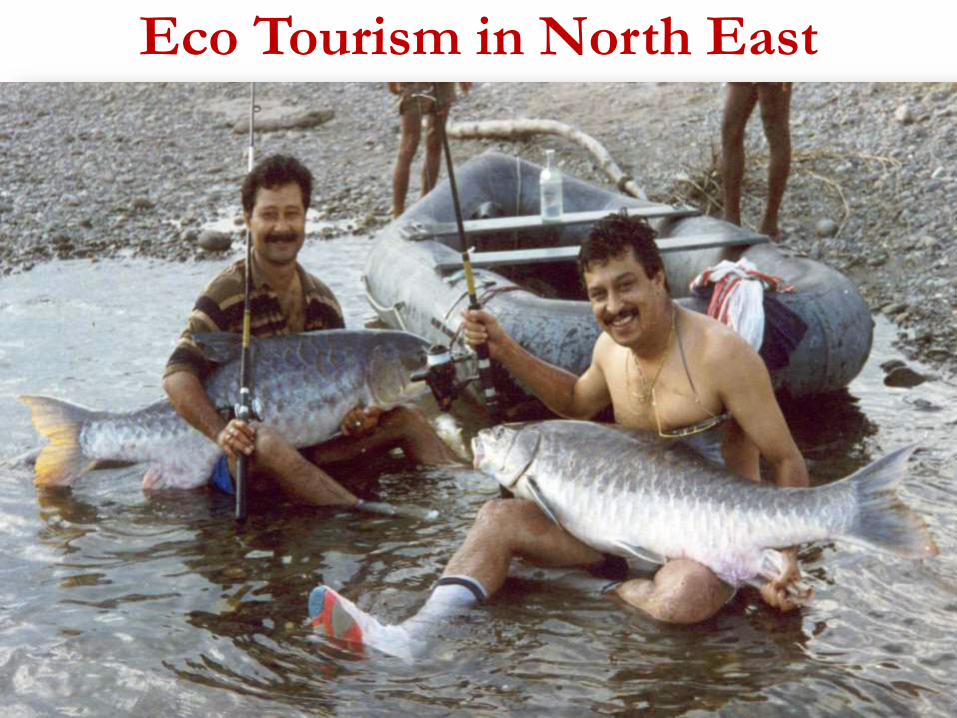
Eco Tourism in North East

Geographic shift of fish in
River Ganga
A shift in geographical distribution
of warm water Gangetic fishes, G. giuris P. ticto, X. cancila, M. vittatus, Catla catla mainly
inhabiting middle and lower
Ganga, towards upper Ganga at
Haridwar and above
Haridwar stretch during the period
1970-86 recorded annual mean
minimum water temperature
(13ºC), while during the period
1987-2003 it increased to 14.5ºC, an
increase of 1.5ºC
A congenial habitat for these warm water fishes
Impact on Inland fisheries

Advancement of breeding period
Fish seed hatchery in district of North 24 Parganas reported an
advancement of the breeding season by more than a month in the
last two decades
Indian major carps breeding started during 24-31 May during 1980
where as during 2005 all the hatcheries started breeding programme
during 7-14 April
It shows an extended breeding period by 45-60days with breeding
season extending from 110-120 to 160-170 days at present
Advanced Breeding Period of IMC at
different hatcheries of 24 Pgs (N)

Multiple breeding
Extension of spawning season –
(Year-round seed)
2-3 folds increase in spawn
production
Reduction in broodstock
requirement
Cryopreservation of carp milt
Protocol developed for Carp
spermatozoa
Used in several hatcheries for
reduction of inbreeding

Carp breeding and Hatchery Management
Brood stock management:
Density, water, feed, health
Use of exogenous hormones for
induced breeding:
Pituitary extract
LHRH-A
Ovaprim, Ovatide, Wova-FH
Development of different hatchery
systems for mass-scale seed production:
Glass jar hatchery
Eco-hatchery
Portable FRP hatchery
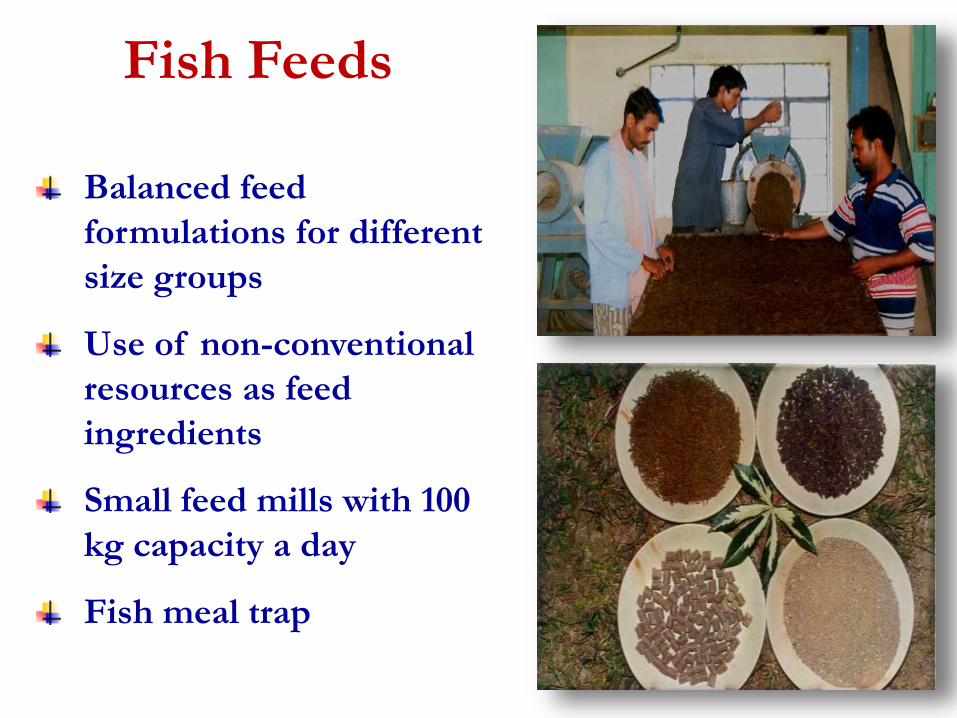
Balanced feed
formulations for different
size groups
Use of non-conventional
resources as feed
ingredients
Small feed mills with 100
kg capacity a day
Fish meal trap
Fish Feeds
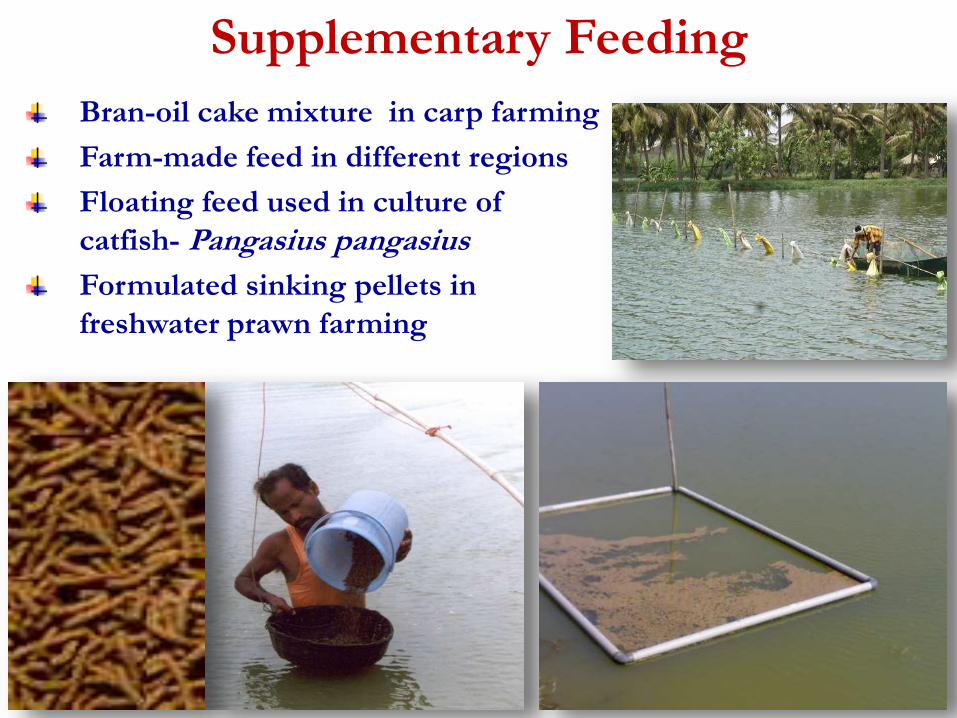
Bran-oil cake mixture in carp farming
Farm-made feed in different regions
Floating feed used in culture of
catfish- Pangasius pangasius
Formulated sinking pellets in
freshwater prawn farming
Supplementary Feeding

Feed MillsSeveral commercial feed plants established in Chhattisgarh and
Andhra Pradesh – sinking and floating petllets
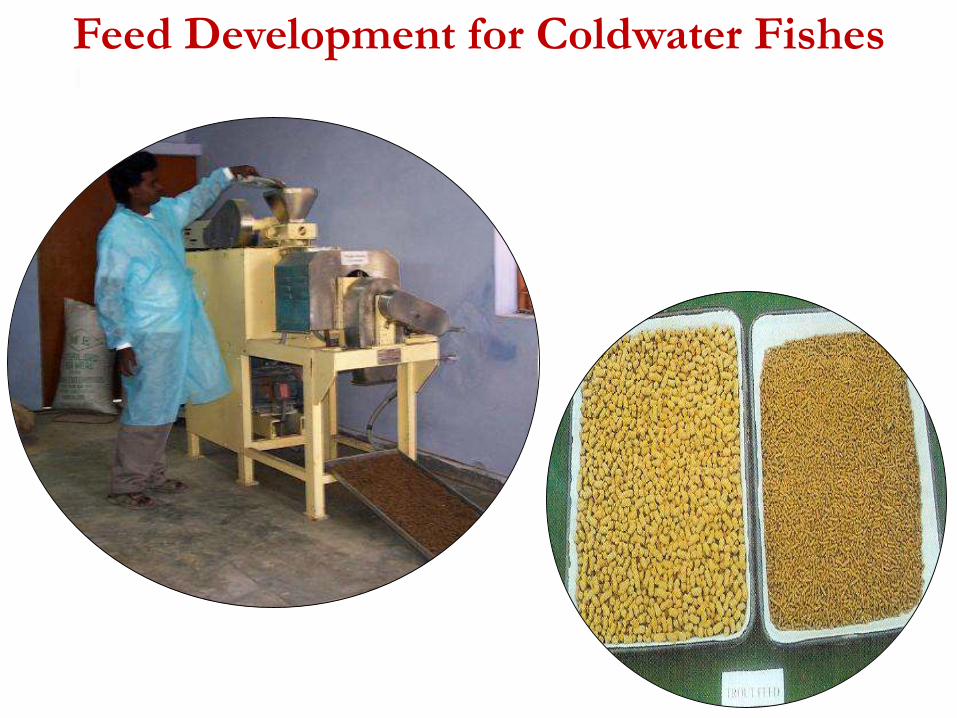
Feed Development for Coldwater Fishes

Seabass Formulated Feed –
CIBA BHETKIAHAR

Present and projected use of feeds and feed ingredient and the requirements by
2020 for freshwater aquaculture and marine shrimp culture in India
Major Feed/Feed Ingredients Present use per annum
(tonnes)
Projected requirement per
annum by 2020 (tonnes)
Freshwater aquaculture
Rice bran & wheat bran 85 800 163 020
Oil cakes 5 980 11 370
Marine ingredients (for prawn feeds) 6 000 10 000
Others 2 600 4 940
Shrimp Culture
Formulated feed 193 500 307 500
Fishmeal 36 000 73 800
Squid meal 2 700 5 535
Shrimp meal 11 250 23 062
Mantis shrimp meal 15 000 30 750
Soybean meal 33 000 67 650
Cereal flour 30 000 61 500
Fish oil 4 500 9 225
Lecithin 750 1 537
Binders 1 500 3 075
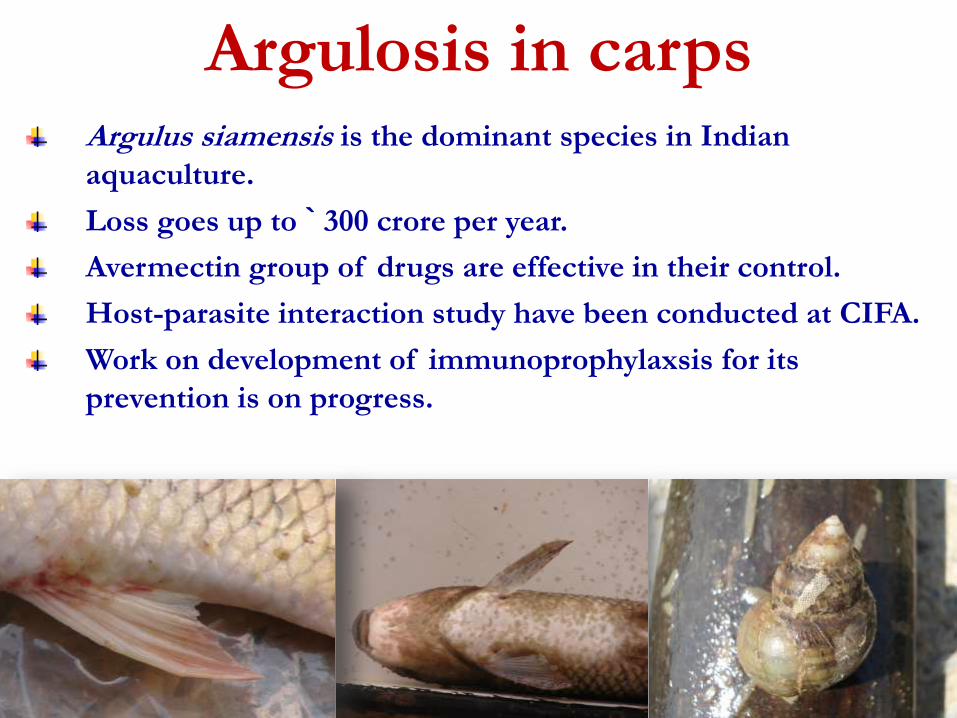
Argulosis in carpsArgulus siamensis is the dominant species in Indian
aquaculture.
Loss goes up to ` 300 crore per year.
Avermectin group of drugs are effective in their control.
Host-parasite interaction study have been conducted at CIFA.
Work on development of immunoprophylaxsis for its
prevention is on progress.

It was first reported in May, 1988 in India.
More than 30 species of fish are recorded to be
infected.
Causative agent: Oomycetes Aphanomyces invadans
Recurrence of this disease has been reported again in
northern parts of India.
Epizootic Ulcerative Syndrome

Common and most prevalent
bacterial pathogen in fish culture
May cause outbreaks
Both serological and molecular
diagnostics are available.
No vaccine available so far.
Selection programme has generated
one disease resistant variety of rohu
with selection response of 58% after
second generation of selection.
Aeromonas hydrophilainfection in fish

Loss was more than Rs 300
crore/annum during 2004-05
Caused by M. rosenbergii nodavirus
and associated with extra small virus
OIE Reference Laboratory in Vellore,
India
CIFA, CIBA and CIFE have developed
diagnostics for this disease besides
other Labs of India
Studies have proved recombinant
protein of MrNV for reducing viral
load in infected prawns.
White tail disease in M. rosenbergii
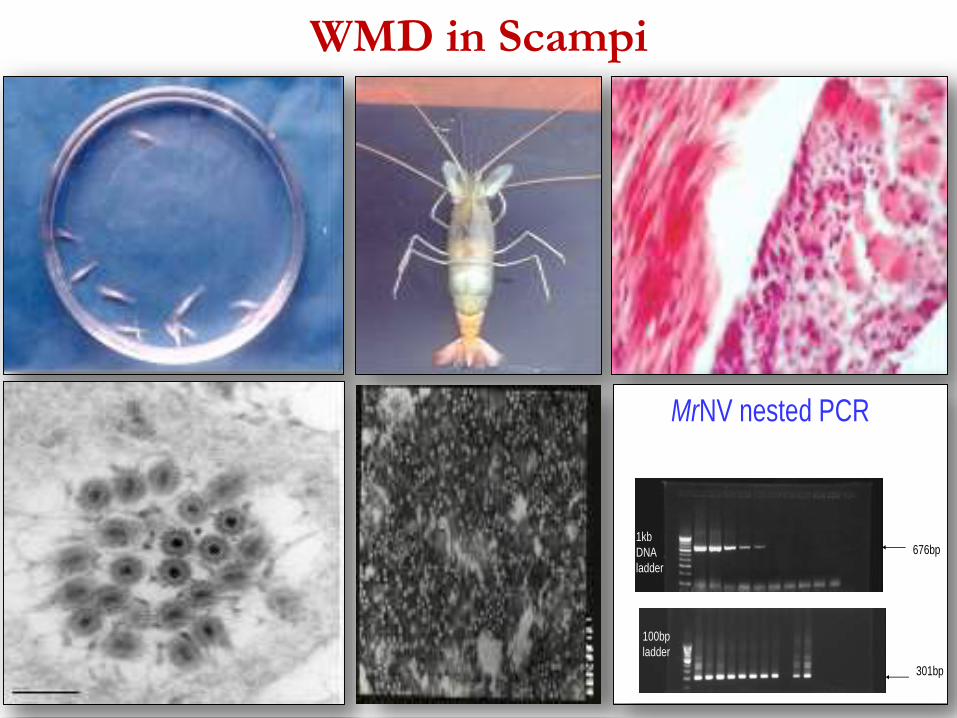
WMD in Scampi
MrNV nested PCR
676bp
301bp
1kb
DNA
ladder
100bp
ladder

Viral Disease in Fish & Shrimp
WSSV in shrimp
Taura syndrome (TS) serious viral disease
in shrimp
Lymphocystis disease (LCD)
Loose shell Syndrome (LSS)
Infectious pancreatic necrosis (IPN)
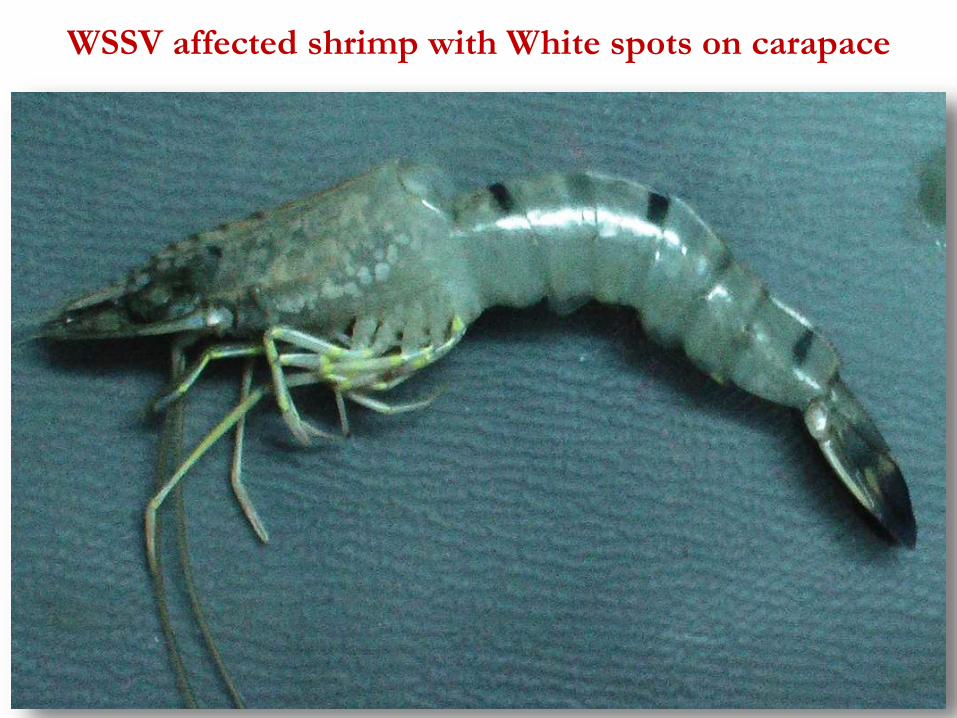
WSSV affected shrimp with White spots on carapace

Iridovirus infection in Seabass showing
highly reduced visceral organs

Gross signs viz., Size variation and dark
discoloration seen in MSGS shrimp
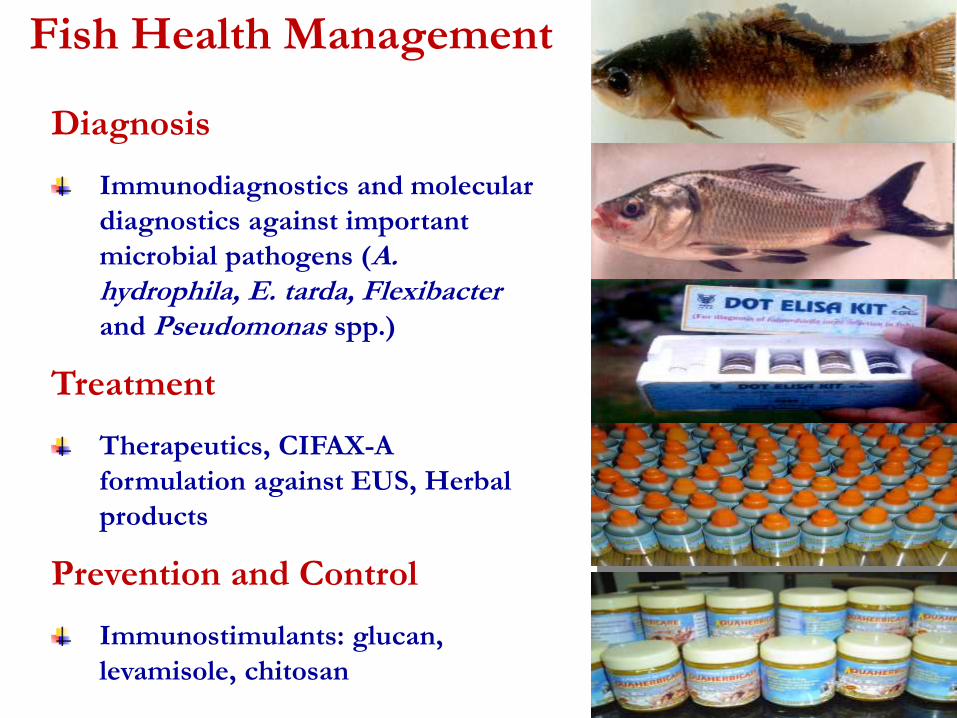
Diagnosis
Immunodiagnostics and molecular
diagnostics against important
microbial pathogens (A. hydrophila, E. tarda, Flexibacterand Pseudomonas spp.)
Treatment
Therapeutics, CIFAX-A
formulation against EUS, Herbal
products
Prevention and Control
Immunostimulants: glucan,
levamisole, chitosan
Fish Health Management

Diagnostics developed at ICAR
Institutes
PCR-based diagnostics for
white spot virus of shrimp
(Monodon baculovirus)
Immunodiagnostics (ELISA
and latex agglutination kits)
for Edwardsiella tarda,
Aeromonas hydrophila,
Pseudomonas fluorescens, Vibrio alginolyticus & latex
agglutination kit for white spot
virus of shrimp
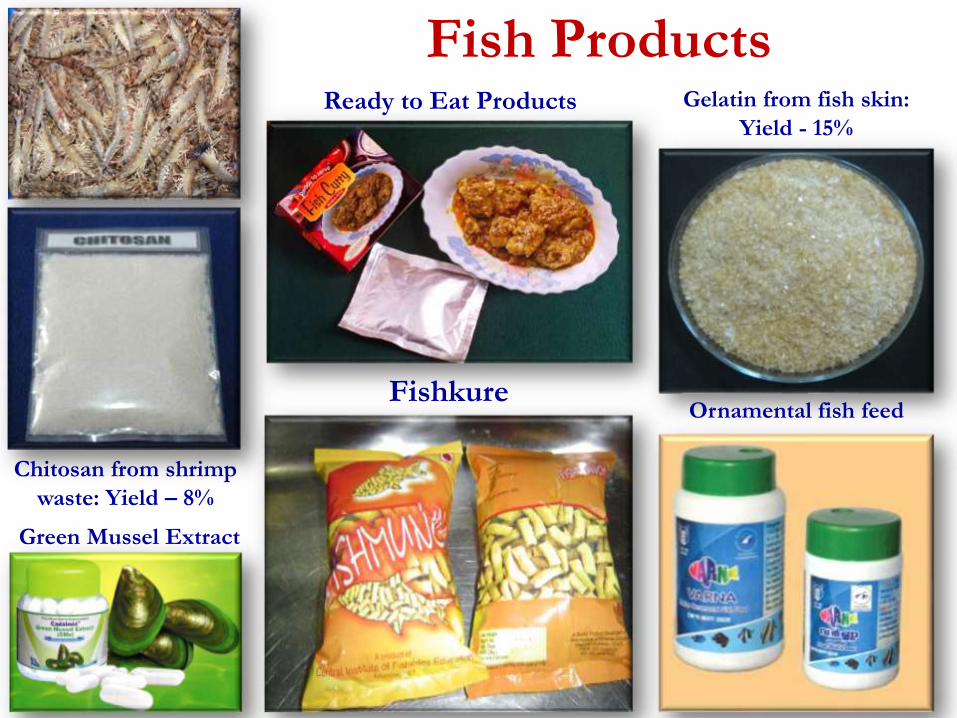
Fish ProductsGelatin from fish skin:
Yield - 15%
Green Mussel Extract
Chitosan from shrimp
waste: Yield – 8%
Ready to Eat Products
Ornamental fish feedFishkure

THANK YOU


![Grundsätze ordnungsmäßiger Buchführung beim IT …...Überarbeitung GoBS im AWV AK 3.4 Seite 4 von 34 Entwurfsstand: 13.10.2012 [9] Die vorliegenden Grundsätze ordnungsmäßiger](https://img.dokumen.tips/doc/110x75/5f103b0c7e708231d4481601/grundstze-ordnungsmiger-buchfhrung-beim-it-oeberarbeitung-gobs-im-awv.jpg)