Embed Size (px)
Citation preview
Hosted by:
John King
Barclays Capital
15 April 2013
The ISG Outsourcing Index, EMEA
First Quarter 2013
Market Data and Insights

© 2013
Information Services
Group, Inc.
All Rights Reserved
isg-one.com
*Contracts with ACV ≥ €4M
2
Covering the state of the outsourcing industry for global, commercial contracts.*
Welcome to the 42nd Quarterly ISG Outsourcing Index EMEA
Bernd SchaeferPartner
John Keppel
President & Chief
Marketing Officer
Dr. David Howie
Partner
© 2013
Information Services
Group, Inc.
All Rights Reserved
isg-one.com
*Contracts with ACV ≥ €4M
3
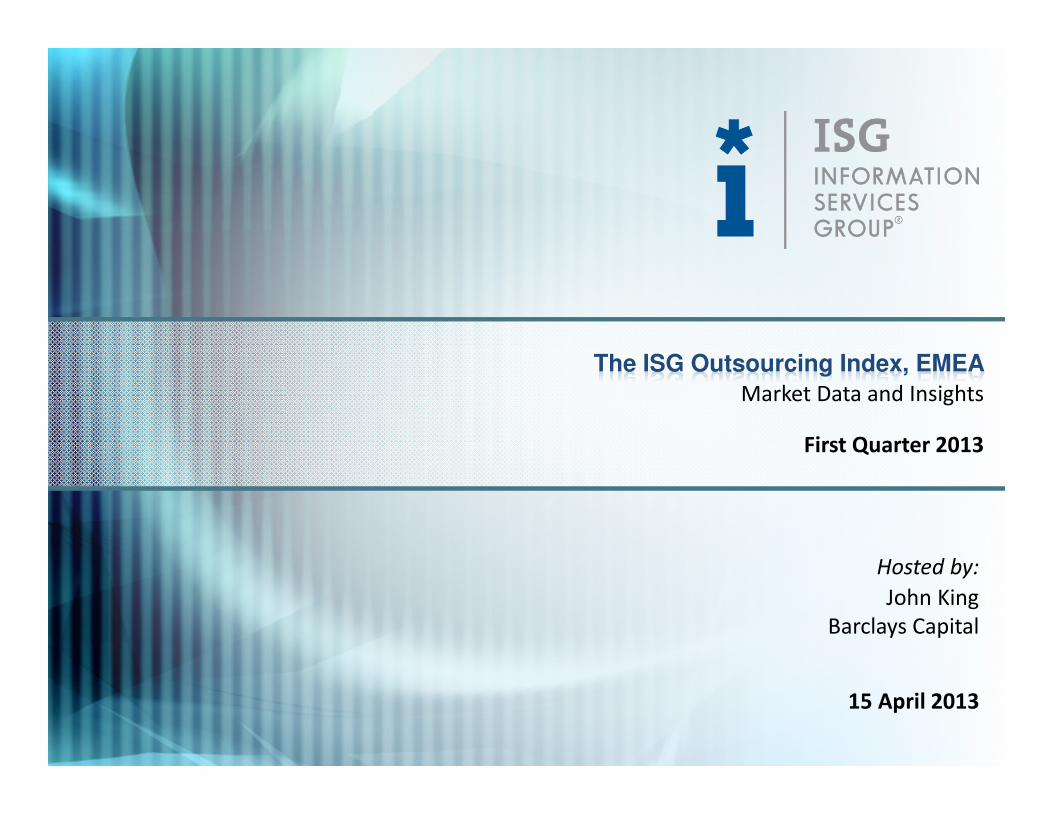
At A Glance
“ “
BROADER MARKET SAGGED IN 1Q13, BOTH Q/Q AND Y/Y
MEGA-RELATIONSHIPS WERE UP OVER 50% Y/Y,
BUT SMALL AWARDS SHOWED CONSIDERABLE WEAKNESS
BPO MAINTAINED RECENT STRENGTH, WITH ACTIVITY UP Q/Q,
BUT ITO RESULTS FELL SIGNIFICANTLY Y/Y
MATURE MARKETS IN AMERICAS AND EMEA DECLINED SHARPLY Y/Y
HEALTHY INCREASE IN ASIA PACIFIC PERFORMANCE,
WITH POSITIVE RESULTS IN AUSTRALIA/NEW ZEALAND
1Q13 1Q Y/Y 1Q Q/Q 1Q13 1Q Y/Y 1Q Q/Q
Scorecard ACV (€B)* Change Change Counts Change Change
Global Market € 3.1 -27% -24% 223 -24% -16%
New Scope € 1.7 -31% -37% 166 -22% -9%
Restructurings € 1.4 -22% 1% 57 -28% -30%
Mega-relationships € 1.0 54% 4% 7 -13% -79%
ITO € 1.9 -35% -28% 127 -34% -30%
BPO € 1.2 -10% -18% 96 -3% 16%
Americas € 1.2 -39% -15% 90 -38% -16%
EMEA € 1.5 -20% -30% 105 -15% -17%
Asia Pacific € 0.4 8% -23% 28 22% -7%

© 2013
Information Services
Group, Inc.
All Rights Reserved
isg-one.com
*Contracts with ACV ≥ €4M
4
ACV of just over €4B was down 27% Y/Y and 24% Q/Q. However, the trailing 12-
month ACV was on par with the previous 12 month period, tempering results.
Broader Market ACV (€B)*
New Scope vs. Restructuring ACV(B)*
Broader Market Contract Award Trends
Broader Market Counts
223 264
292
349
259
Avg of Prior
1Qs
300
1Q134Q3Q2Q1Q124Q3Q2Q1Q114Q3Q2Q1Q10
€ 3.1€ 4.3€ 4.3
€ 4.9
Avg of Prior 1Qs
€ 4.5
1Q134Q3Q2Q1Q124Q3Q2Q1Q114Q3Q2Q1Q10
€ 1.7
€ 2.7 € 2.5
€ 3.2
€ 1.4 € 1.4 € 1.8
€ 1.1
1Q134Q3Q2Q1Q124Q3Q2Q1Q11
New Scope Restructuring

© 2013
Information Services
Group, Inc.
All Rights Reserved
isg-one.com
*Contracts with ACV ≥ €4M
5
Mega-relationships, deals with ACV of €80M+, were up 54% Y/Y and 4% Q/Q. Mid to
small sized awards dipped, but the trailing 12-month compare was stable.
Mega-relationships in 8 Quarter Increments
New Scope vs. Restructuring Counts
Broader Market Contract Trends for the Largest Deals
ACV (€B)* by Bands
31
37
48
31
22
13
2Q11 - 1Q13
2Q09 - 1Q11
2Q07 - 1Q09
New Scope Restructuring
1.9
3.23.12.93.7
3.33.12.8
3.8
0.20.70.90.70.90.70.80.4
0.8
1.00.91.21.7
0.6
1.91.4
0.70.5
1Q134Q3Q2Q1Q124Q3Q2Q1Q11
€ 4 - 79M € 40-79M € 80M +

© 2013
Information Services
Group, Inc.
All Rights Reserved
isg-one.com
*Contracts with ACV ≥ €4M
6
EMEA ACV of €1.5B was down 32% Q/Q and 21% Y/Y. Restructuring ACV grew
modestly while New Scope ACV fell sharply.
EMEA ACV (€B)*
EMEA New vs. Restructuring ACV(€B)*
EMEA Contract Award Trends
EMEA Counts by ACV Band
€ 1.5 € 2.2 € 2.3
€ 1.9 € 1.9
€ 3.0 € 2.5
€ 1.8 € 2.2
€ 2.8
€ 1.6 € 1.9
€ 2.4
Avg of Prior 1Qs
€ 2.2
1Q134Q3Q2Q1Q124Q3Q2Q1Q114Q3Q2Q1Q10
€ 0.74
€ 1.50
€ 1.31
€ 1.65
€ 0.75
€ 0.70 € 0.60 € 0.55
1Q134Q3Q2Q1Q124Q3Q2Q1Q11
New Scope Restructuring
81916982839796
76
129
212932213731212533
374538432
1Q134Q3Q2Q1Q124Q3Q2Q1Q11
€ 4 - 15M €16 - 79M € 80M +

© 2013
Information Services
Group, Inc.
All Rights Reserved
isg-one.com
*Contracts with ACV ≥ €4M
7
The UK and DACH had weak 1Q13 results. However, Nordics and Benelux, held
steady.
EMEA Contract Award Trends Detail
EMEA Sub-region ACV (€B)* EMEA Industry ACV (€B)*
€ 0.72
€ 0.31 € 0.33
€ 0.29
€ 0.03
€ 0.09 € 0.08 € 0.05
€ 0.50
€ 0.22
€ 0.35
€ 0.30
€ 0.04
€ 0.02 € 0.05
€ 0.06
€ -
€ 0.1
€ 0.2
€ 0.3
€ 0.4
€ 0.5
€ 0.6
€ 0.7
€ 0.8
€ 0.9
UK &
Ireland
DACH Nordics Benelux France Southern
Europe
Africa &
Middle
East
E. Europe
& Russia
Prior 5 Like-Qtr Range Prior 5 Like-Qtr Avg 1Q12 1Q13
€ 0.54
€ 0.51
€ 0.34
€ 0.28
€ 0.24
€ 0.10
€ 0.05
€ 0.05
€ 0.37
€ 0.38
€ 0.33
€ 0.18
€ 0.06
€ 0.09
€ 0.06
€ 0.06
Manufacturing
Financial Services
Energy
Travel, Transport,
Leisure
Telecom & Media
Business Services
Retail
Healthcare &
Pharma
Prior 5 Like-Qtr Avg 1Q13

© 2013
Information Services
Group, Inc.
All Rights Reserved
isg-one.com
*Contracts with ACV ≥ €4M
8
ITO ACV of €1.1B was down 15% Q/Q and 8% Y/Y. Contract numbers fell to their
lowest point since 4Q 2008.
EMEA ITO Annual ACV (€B)*
EMEA ITO New vs. Restructuring ACV (€B)*
EMEA ITO Contract Award Trends
€ 1.1 € 1.3 € 1.6
€ 1.1 € 1.2
€ 2.3 € 2.0
€ 1.2 € 1.6
€ 2.5
€ 1.2 € 1.7
€ 2.0
Avg of Prior Qs
€ 1.4
1Q134Q3Q2Q1Q124Q3Q2Q1Q114Q3Q2Q1Q10
EMEA ITO Counts
66
84
122
67
Avg of Prior
Qs
91
1Q134Q3Q2Q1Q124Q3Q2Q1Q114Q3Q2Q1Q10
€ 0.55
€ 0.82 € 0.80
€ 1.18
€ 1.10
€ 0.59
€ 0.45 € 0.45 € 0.43
€ 0.92
1Q134Q3Q2Q1Q124Q3Q2Q1Q114Q3Q2Q1Q10
New Scope Restructuring

© 2013
Information Services
Group, Inc.
All Rights Reserved
isg-one.com
*Contracts with ACV ≥ €4M
9
While BPO contract numbers remained buoyant in the first quarter, ACV fell due to
the absence of large BPO deals in the region.
EMEA BPO Annual ACV (€B)*
EMEA BPO New vs. Restructuring ACV (€B)*
EMEA BPO Contract Award Trends
EMEA BPO Counts
39 39 39 42
29
Avg of Prior
1Qs
37
1Q134Q3Q2Q1Q124Q3Q2Q1Q114Q3Q2Q1Q10
€ 0.39
€ 0.93
€ 0.66 € 0.77
€ 0.66 € 0.66 € 0.54
€ 0.64 € 0.59
€ 0.30 € 0.41
€ 0.28 € 0.35
Avg of Prior 1Qs
€ 0.53
1Q134Q3Q2Q1Q124Q3Q2Q1Q114Q3Q2Q1Q10
€ 0.21
€ 0.68
€ 0.51 € 0.47
€ 0.25
€ 0.19
€ 0.25
€ 0.15 € 0.12 € 0.10
1Q134Q3Q2Q1Q124Q3Q2Q1Q114Q3Q2Q1Q10
New Scope Restructuring

© 2013
Information Services
Group, Inc.
All Rights Reserved
isg-one.com
*Contracts with ACV ≥ €4M
10
The top service providers based on 1Q13 ACV or TTM ACV awarded
Top Service Providers in EMEA
Note: Service providers in alphabetical order; no rankings implied.
Placements based on ACV from commercial contract awards sourced from ISG Contracts Knowledgebase ®.
Accenture
AT&T
Atos
BT
Capgemini
CGI
CSC
Evry
HCL
HP
IBM
Infosys
ISS Global A/S
Jones Lang LaSalle
Mahindra Satyam
MITIE
Serco
TCS
T-Systems
Xchanging
Trailing 12 Months
EMEA Top 20
Accenture
AT&T
Capgemini
CGI
Communisis
Evry
Genpact
HCL
HP
Infosys
Lottomatica
Nokia
SQS
Swisscom
TCS
Thales
Tieto
Virtusa
Xchanging
Xerox
1Q13
EMEA Top 20

© 2013
Information Services
Group, Inc.
All Rights Reserved
isg-one.com
*Contracts with ACV ≥ €4M
11
Americas ACV of €1.2B was down 39% Y/Y and 15% Q/Q. Americas BPO is up 17%
Y/Y and 50% Q/Q, outperforming the ITO sector for the first time.
Americas ACV (€B)*
Americas New vs. Restructuring ACV(€B)*
Americas Contract Award Trends
Americas ITO vs. BPO ACV (€B)*
€ 0.52
€ 0.99
€ 1.44
€ 0.87
€ 0.72
€ 0.49 € 0.63 € 0.74
1Q134Q3Q2Q1Q124Q3Q2Q1Q11
ITO ACV BPO ACV
€ 1.2€ 1.5€ 1.4€ 1.5
€ 2.1€ 1.8€ 1.6€ 1.4€ 1.6€ 0.9
€ 1.6€ 2.3€ 2.3
Avg of Prior 1Qs
€ 2.0
1Q134Q3Q2Q1Q124Q3Q2Q1Q114Q3Q2Q1Q10
€ 0.62
€ 0.95
€ 0.84
€ 1.11
€ 0.59 € 0.53
€ 1.23
€ 0.50
1Q134Q3Q2Q1Q124Q3Q2Q1Q11
New Scope Restructuring

© 2013
Information Services
Group, Inc.
All Rights Reserved
isg-one.com
*Contracts with ACV ≥ €4M
12
The U.S. contributed most to the drop in the Americas ACV, down 43% Y/Y and 24%
Q/Q. Mexico continues to enjoy large-deal activity, boosting the ACV numbers.
Americas Contract Award Trends Detail
Americas Sub-region ACV (€B)* Americas Industry ACV (€B)*
€ 1.85
€ 1.08
€ -
€ 0.5
€ 1.0
€ 1.5
€ 2.0
€ 2.5
US
€ 0.19
€ 0.01
€ 0.02
€ -
€ 0.08
€ 0.02
€ 0.00
€ 0.08
€ -
€ 0.02
€ 0.04
€ 0.06
€ 0.08
€ 0.10
€ 0.12
€ 0.14
€ 0.16
€ 0.18
€ 0.20
Canada Brazil Other
LatAm
Mexico
Prior 5 Like-Qtr Range Prior 5 Like-Qtr Avg 1Q12 1Q13
€ 0.53
€ 0.30
€ 0.22
€ 0.20
€ 0.25
€ 0.10
€ 0.09
€ 0.09
€ 0.16
€ 0.28
€ 0.43
€ 0.09
€ 0.16
€ 0.02
€ 0.05
€ 0.07
Manufacturing
Financial Services
Telecom & Media
Business Services
Healthcare &
Pharma
Retail
Energy
Travel, Transport,
Leisure
Prior 5 Like-Qtr Avg 1Q13
© 2013
Information Services
Group, Inc.
All Rights Reserved
isg-one.com
*Contracts with ACV ≥ €4M
13
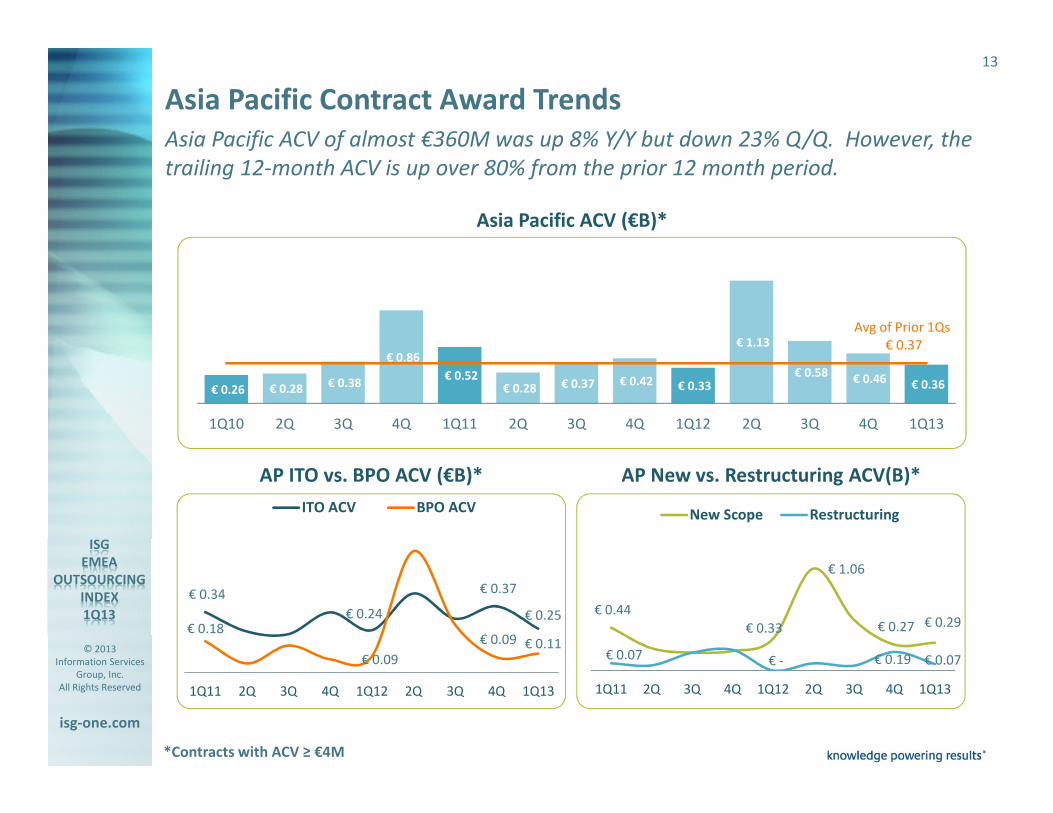
Asia Pacific ACV of almost €360M was up 8% Y/Y but down 23% Q/Q. However, the
trailing 12-month ACV is up over 80% from the prior 12 month period.
Asia Pacific ACV (€B)*
AP New vs. Restructuring ACV(B)*
Asia Pacific Contract Award Trends
AP ITO vs. BPO ACV (€B)*
€ 0.25
€ 0.37
€ 0.24
€ 0.34
€ 0.11 € 0.09
€ 0.09
€ 0.18
1Q134Q3Q2Q1Q124Q3Q2Q1Q11
ITO ACV BPO ACV
€ 0.29 € 0.27
€ 1.06
€ 0.33
€ 0.44
€ 0.07 € 0.19 € -€ 0.07
1Q134Q3Q2Q1Q124Q3Q2Q1Q11
New Scope Restructuring
€ 0.36 € 0.46 € 0.58
€ 1.13
€ 0.33 € 0.42 € 0.37 € 0.28 € 0.52
€ 0.86
€ 0.38 € 0.28 € 0.26
Avg of Prior 1Qs
€ 0.37
1Q134Q3Q2Q1Q124Q3Q2Q1Q114Q3Q2Q1Q10

© 2013
Information Services
Group, Inc.
All Rights Reserved
isg-one.com
*Contracts with ACV ≥ €4M
14
Australia/New Zealand and Japan posted positive results due to several large
awards. Energy and Travel & Transport were up over historical averages.
Asia Pacific Contract Award Trends Detail
Asia Pacific Sub-region ACV (€B)* AP Industry ACV (€B)*
€ 0.08
€ 0.05
€ 0.11
€ 0.03
€ 0.06
€ -
€ 0.12
€ 0.07
€ 0.14
€ 0.01 € 0.01
€ -
€ 0.05
€ 0.10
€ 0.15
€ 0.20
€ 0.25
ANZ India and
South Asia
Japan ASEAN Greater
China
South Korea
Prior 5 Like-Qtr Range Prior 5 Like-Qtr Avg 1Q12 1Q13
€ 0.09
€ 0.09
€ 0.07
€ 0.04
€ 0.02
€ 0.02
€ 0.01
€ 0.001
€ 0.01
€ 0.07
€ 0.05
€ 0.08
€ 0.13
€ 0.00
€ 0.00
€ -
Telecom &
Media
Manufacturing
Financial
Services
Travel,
Transport,
Leisure
Energy
Business
Services
Retail
Healthcare &
Pharma
Prior 5 Like-Qtr Avg 1Q13

Special Topic for First Quarter 2013
John KeppelPresident & Chief
Marketing Officer

© 2013
Information Services
Group, Inc.
All Rights Reserved
isg-one.com
*Contracts with ACV ≥ €4M
16
Western-heritage Providers
Leading Providers Experience Shift in Market Share
13%
12%
ACV
Awards
Awards
ACV
Market Share Shifts 2009 - 2012
India-heritage Providers
9%
7%
CAGR Disparity
2005 - 2012
India-heritage
�32%
�16%
�7%�0.4%
Western-heritage
2005 2009 2012

© 2013
Information Services
Group, Inc.
All Rights Reserved
isg-one.com
*Contracts with ACV ≥ €4M
17
3Make New Inroads into the Global Public Sector Markets
13%
Opportunities and Challenges for Short-term Growth
Continue Winning in the MatureUK and US Restructuring Markets
4%
20%
2005 2009 2012
Increase European Market Sharevia Enhanced Offshore Value Prop
India-heritage Restructuring ACV Market Share
1
7%
2005-08 2009-12
Capitalize on BPO Growth via Investment in Vertical Solutions
India-heritage EuropeanACV Market Share
India-heritage BPO ACVMarket Share
16%
36%
2005 2009 2012
$$$$
4
2
$$$$ $$$
Investment Investment

© 2013
Information Services
Group, Inc.
All Rights Reserved
isg-one.com
*Contracts with ACV ≥ €4M
18
Staying Ahead: What got you here will not get you there.
Long-term, the best defense may be a good offense, a challenge for western
providers with high overhead, India-heritage providers need long-term growth
engines to stay on trajectory.
Capturing the Expected Growth in the Mid-Market� India-heritage Providers have proven offshoring credentials
� Western providers have started to create dedicated mid-market organizations
Lower Cost of Switching Puts Everybody on Notice � Equal threat to all providers, no matter their heritage
� Incumbency advantage disappearing as transitions become less painful
ITO ChallengeGet familiar with the new buyers of emerging technologies, who sit outside
the CIO’s organization.
BPO Challenge Pay for performance, rather than for bodies, is becoming the norm. Pricing
based on labor mark-up is becoming less attractive.€

© 2013
Information Services
Group, Inc.
All Rights Reserved
isg-one.com
*Contracts with ACV ≥ €4M
19
� Market continues to struggle to regain traction with soft spots in ACV
smaller deal space and in New Scope
� ITO performance is weak and BPO remains the bright spot
� Trailing 12 months is encouraging and the Mega-relationship market
was strong
� EMEA New Scope activity fell unexpectedly but restructurings rose.
Financial Services was off and BPO ACV fell while contract awards
remained strong
� Americas saw decline in the US market and a low number of ITO
contracts. BPO gains rise above ITO in the region.
� Asia Pacific held steady, with ACV and activity increasing Y/Y, and
positive results in Australia/New Zealand.
� Keep expectations in check for 2Q13 with softness in the overall market
� Positive signs point to a healthier outlook for the full year
� Strength in BPO
� Positivity in the emerging markets in the last 12 months
� Impact of timing on deal flow should eventually rebound
1Q13 ISG Outsourcing Index Summary and Outlook
summarymarket
outlookmarket

© 2013
Information Services
Group, Inc.
All Rights Reserved
isg-one.com
*Contracts with ACV ≥ €4M
20
Please contact us with your questions and comments.
Learn More
--- Media Contacts ---
► John Keppel
President & Chief Marketing Officer
+44 (0)7879 432 212
blog.isg-one.com
► Denise Colgan
Marketing Director, EMEA, ISG
+44 1737 371523
► Louise Fernley
Cohn & Wolfe for ISG
+44 207 331 5365

First Quarter 2013
© 2013
Information Services
Group, Inc.
All Rights Reserved
isg-one.com
*Contracts with ACV ≥ €4M
22
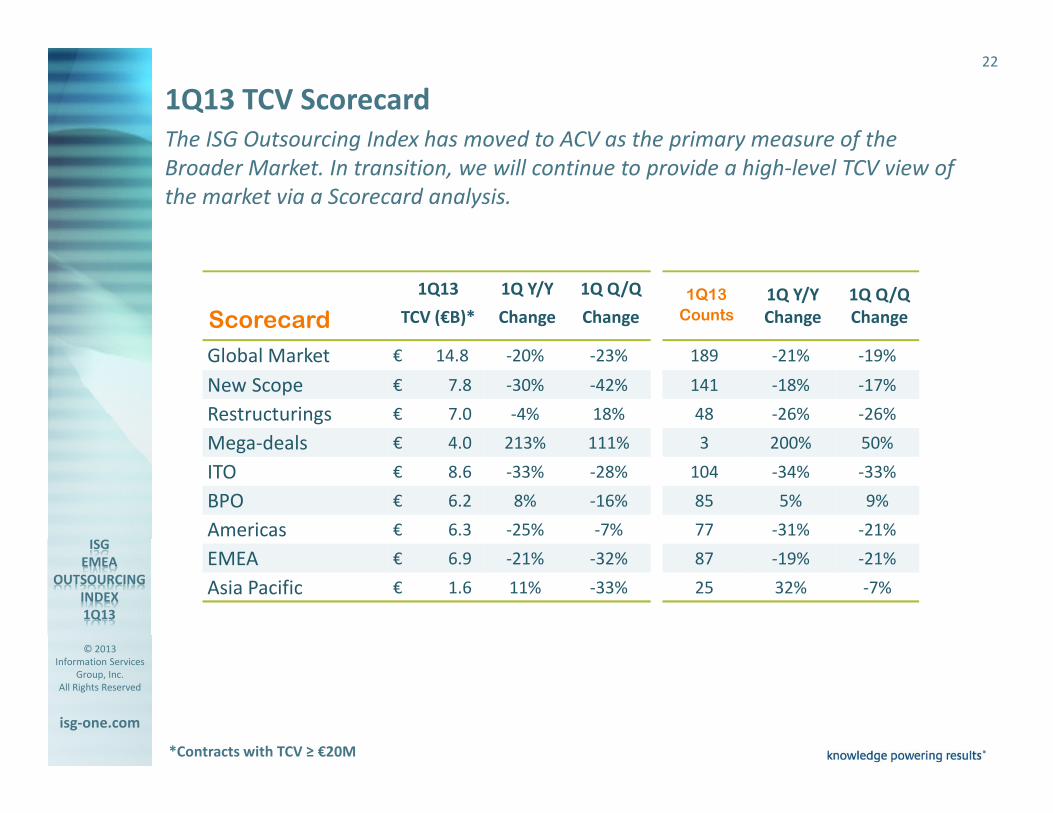
The ISG Outsourcing Index has moved to ACV as the primary measure of the
Broader Market. In transition, we will continue to provide a high-level TCV view of
the market via a Scorecard analysis.
1Q13 TCV Scorecard
*Contracts with TCV ≥ €20M
1Q13 1Q Y/Y 1Q Q/Q Counts Change Change
189 -21% -19%
141 -18% -17%
48 -26% -26%
3 200% 50%
104 -34% -33%
85 5% 9%
77 -31% -21%
87 -19% -21%
25 32% -7%
1Q13 1Q Y/Y 1Q Q/Q
Scorecard TCV (€B)* Change Change
Global Market € 14.8 -20% -23%
New Scope € 7.8 -30% -42%
Restructurings € 7.0 -4% 18%
Mega-deals € 4.0 213% 111%
ITO € 8.6 -33% -28%
BPO € 6.2 8% -16%
Americas € 6.3 -25% -7%
EMEA € 6.9 -21% -32%
Asia Pacific € 1.6 11% -33%

www.isg-one.com
Information Services Group is a leading technology insights, market intelligence and advisory services company, serving more
than 450 clients around the world to help them achieve operational excellence. ISG supports private and public sector
organizations to transform and optimize their operational environments through research, benchmarking, consulting and
managed services, with a focus on information technology, business process transformation, program management services and
enterprise resource planning. Clients look to ISG for unique insights and innovative solutions for leveraging technology, the
deepest data source in the industry, and more than five decades of experience of global leadership in information and advisory
services. Based in Stamford, Conn., the company has more than 800 employees and operates in 21 countries.
knowledge powering results®