Embed Size (px)
Citation preview

Marcelo Pereira de CarvalhoCEO - AgriPoint
9 de maio de 2014
What will be the role of Brazil in
the coming years?

AgriPoint
A company in the information business for agricultural sectors, with dairying being the main area.

Our services/products for the dairy sector

Forecasts/Previsões
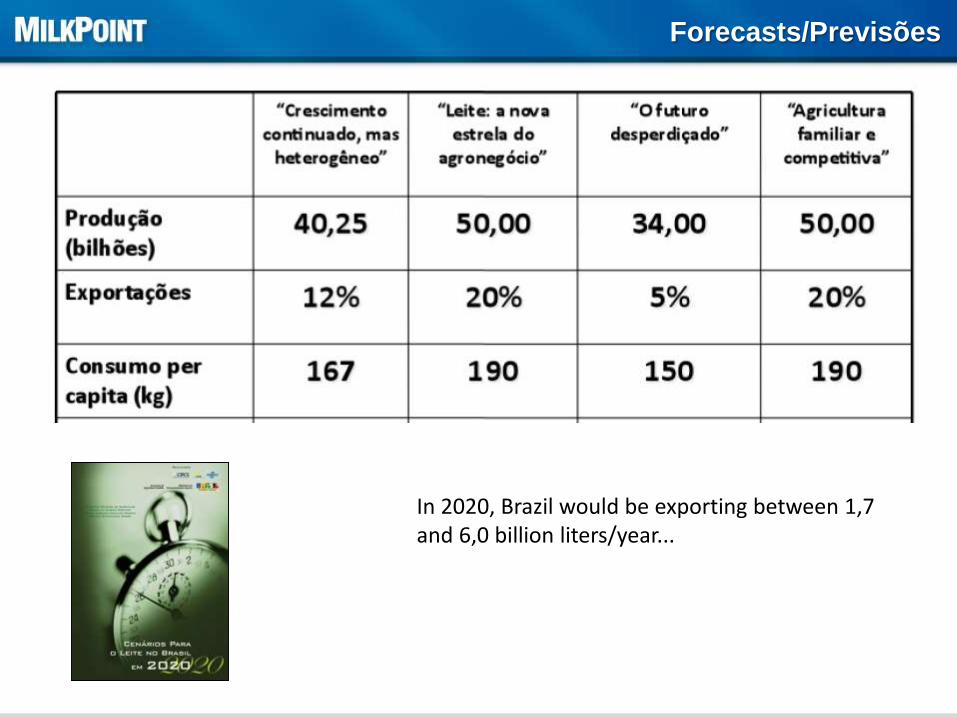
Forecasts/Previsões
In 2020, Brazil would be exporting between 1,7 and 6,0 billion liters/year...
It’s not east to make forecasts...
• The time frame they are done affect our
perceptions and therefore the results
• Many different and uncontrollable variables
• We live in a moment of significant changes
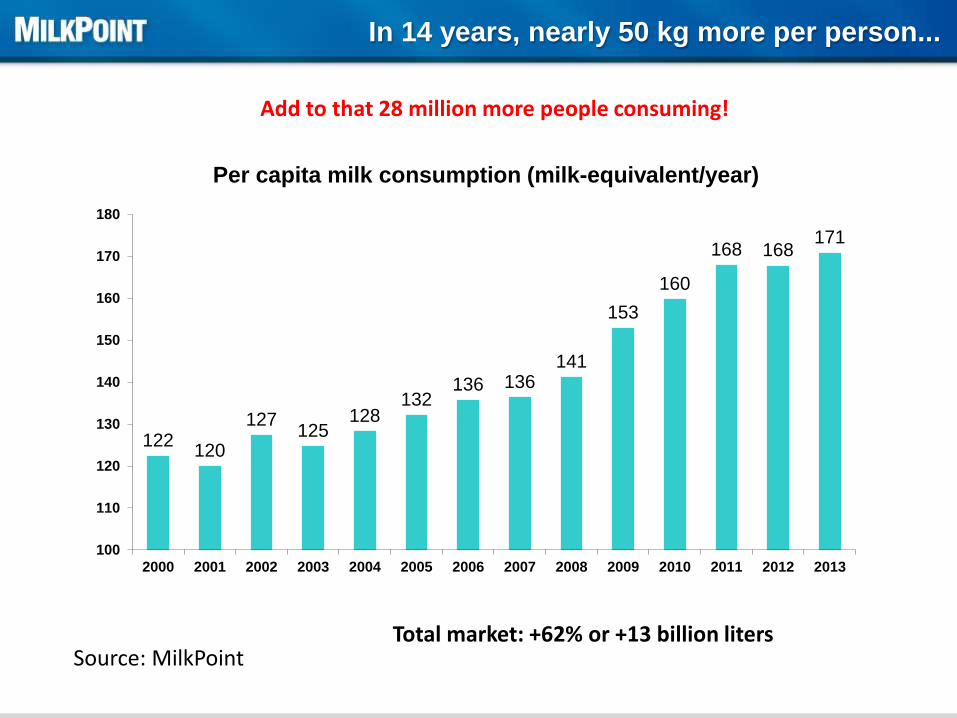
In 14 years, nearly 50 kg more per person...
122120
127125
128132
136 136141
153
160
168 168171
100
110
120
130
140
150
160
170
180
2000 2001 2002 2003 2004 2005 2006 2007 2008 2009 2010 2011 2012 2013
Per capita milk consumption (milk-equivalent/year)
Source: MilkPoint
Add to that 28 million more people consuming!
Total market: +62% or +13 billion liters

Market growth dynamics
3.12%
2.26%
1.64%1.46%
3.18%3.13%
5.56%
1.34%
1.76%
4.27%
4.42%
5.08%
1.01%
3.38%
4.02%
0.00%
1.00%
2.00%
3.00%
4.00%
5.00%
6.00%
1989-2000
2001-2006
2007-2013
Source: MilkPoint
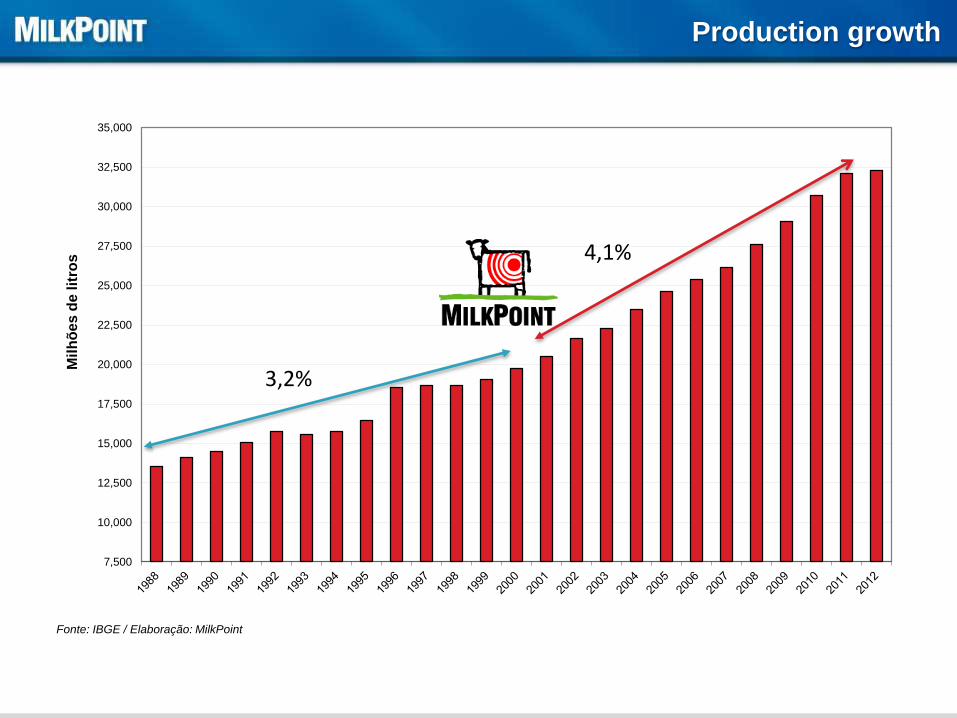
Production growth
7,500
10,000
12,500
15,000
17,500
20,000
22,500
25,000
27,500
30,000
32,500
35,000
Mil
hõ
es d
e lit
ros
Fonte: IBGE / Elaboração: MilkPoint
4,1%
3,2%

How much of our consumption is produced internally
88%
90%
92%
94%
96%
98%
100%
102%
104%
2000 2001 2002 2003 2004 2005 2006 2007 2008 2009 2010 2011 2012 2013
Self-sufficiency Index (production/consumption)
Source: MilkPoint
Can Brazil be considered a structural importer?
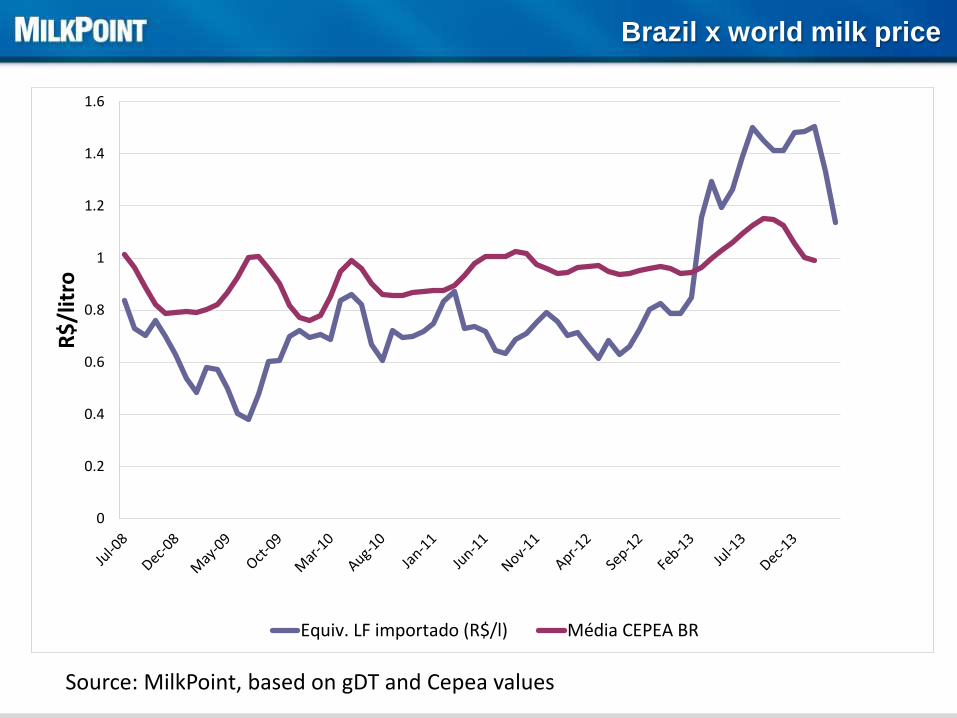
Brazil x world milk price
Source: MilkPoint, based on gDT and Cepea values
0
0.2
0.4
0.6
0.8
1
1.2
1.4
1.6
R$
/lit
ro
Equiv. LF importado (R$/l) Média CEPEA BR
• Trade policy: 27% tax for WMP distort the
market – will it be kept?
• No clear trend regarding being either a large
importer or a large exporter
• Exchange rates and world prices impact this
status
Brazil’s role regarding dairy trade

• Consumption will growth less in the future
• Production will also growth less in the next
years
What can we expect?
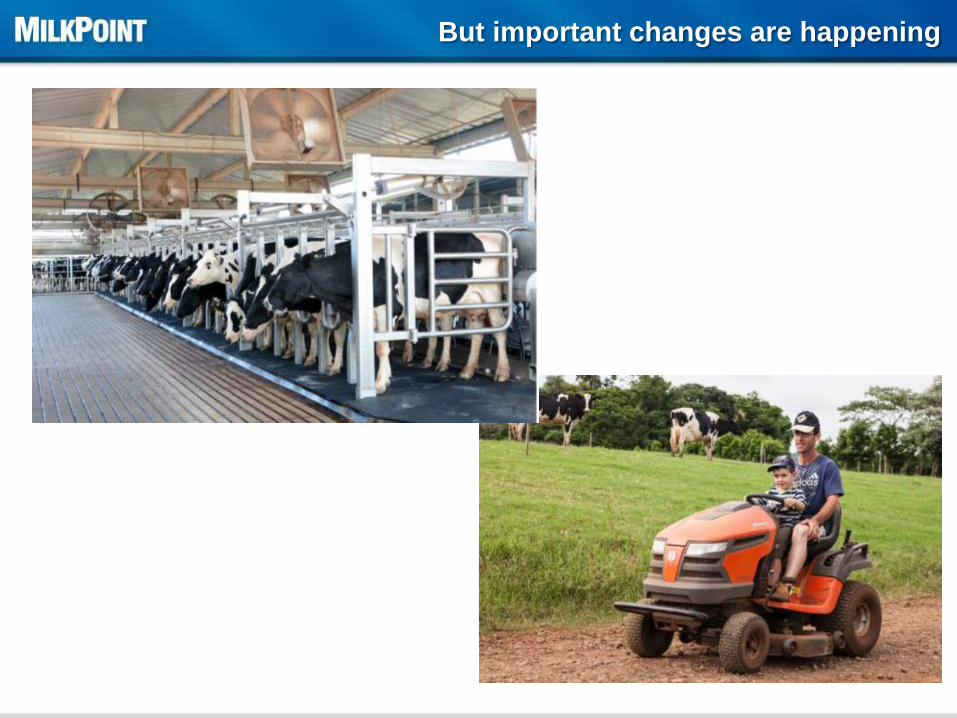
But important changes are happening
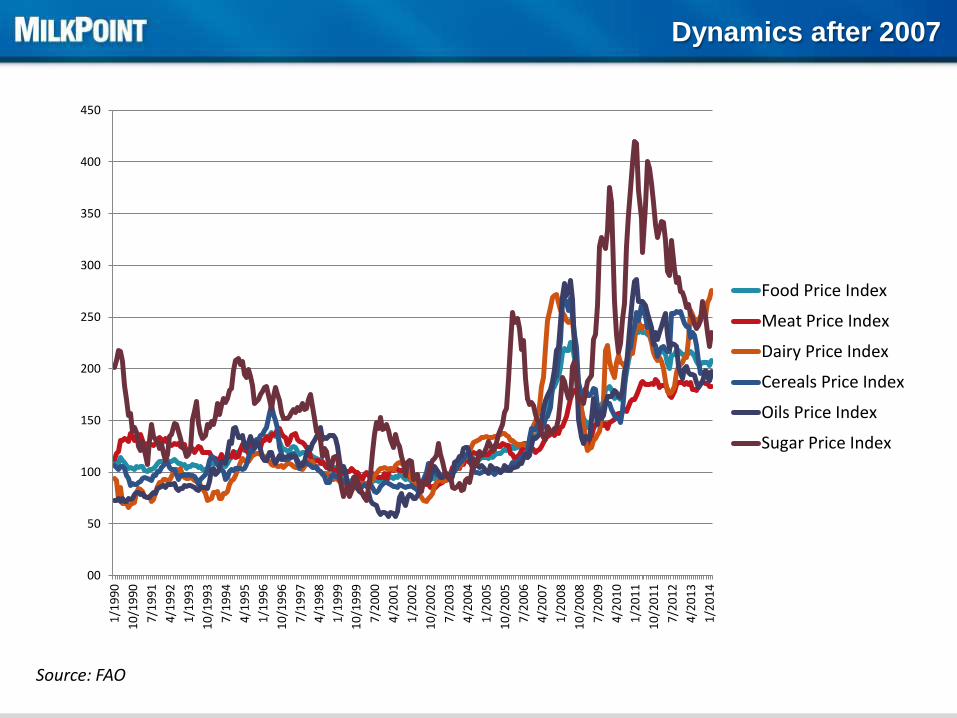
Dynamics after 2007
00
50
100
150
200
250
300
350
400
4501
/19
90
10
/19
90
7/1
99
1
4/1
99
2
1/1
99
3
10
/19
93
7/1
99
4
4/1
99
5
1/1
99
6
10
/19
96
7/1
99
7
4/1
99
8
1/1
99
9
10
/19
99
7/2
00
0
4/2
00
1
1/2
00
2
10
/20
02
7/2
00
3
4/2
00
4
1/2
00
5
10
/20
05
7/2
00
6
4/2
00
7
1/2
00
8
10
/20
08
7/2
00
9
4/2
01
0
1/2
01
1
10
/20
11
7/2
01
2
4/2
01
3
1/2
01
4
Food Price Index
Meat Price Index
Dairy Price Index
Cereals Price Index
Oils Price Index
Sugar Price Index
Source: FAO
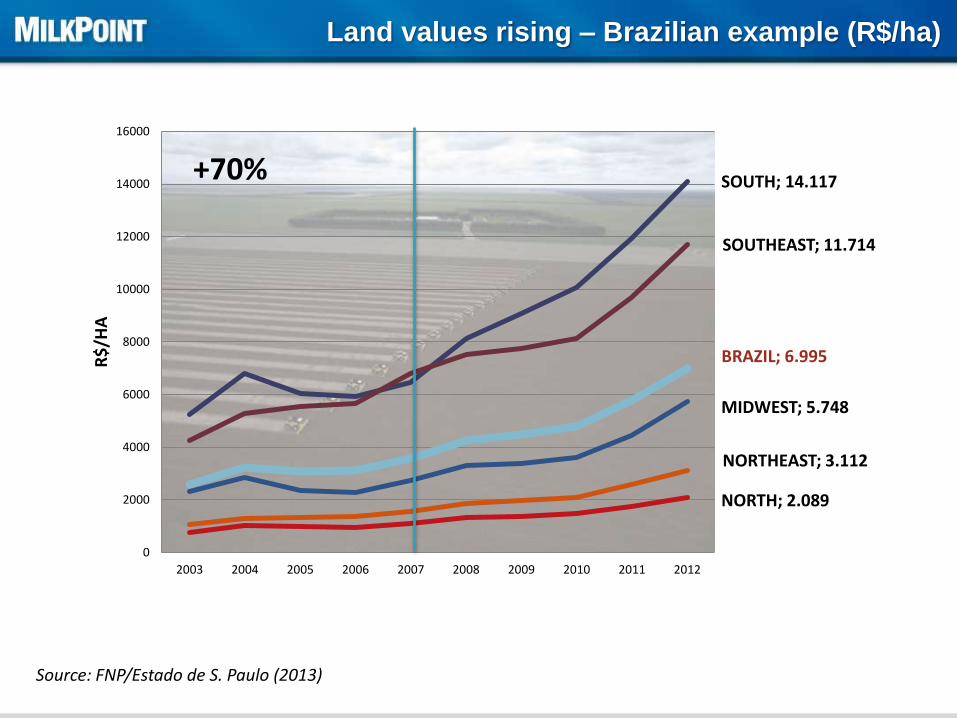
Land values rising – Brazilian example (R$/ha)
Source: FNP/Estado de S. Paulo (2013)
NORTH; 2.089
NORTHEAST; 3.112
MIDWEST; 5.748
SOUTH; 14.117
SOUTHEAST; 11.714
BRAZIL; 6.995
0
2000
4000
6000
8000
10000
12000
14000
16000
2003 2004 2005 2006 2007 2008 2009 2010 2011 2012
R$
/HA
+70%
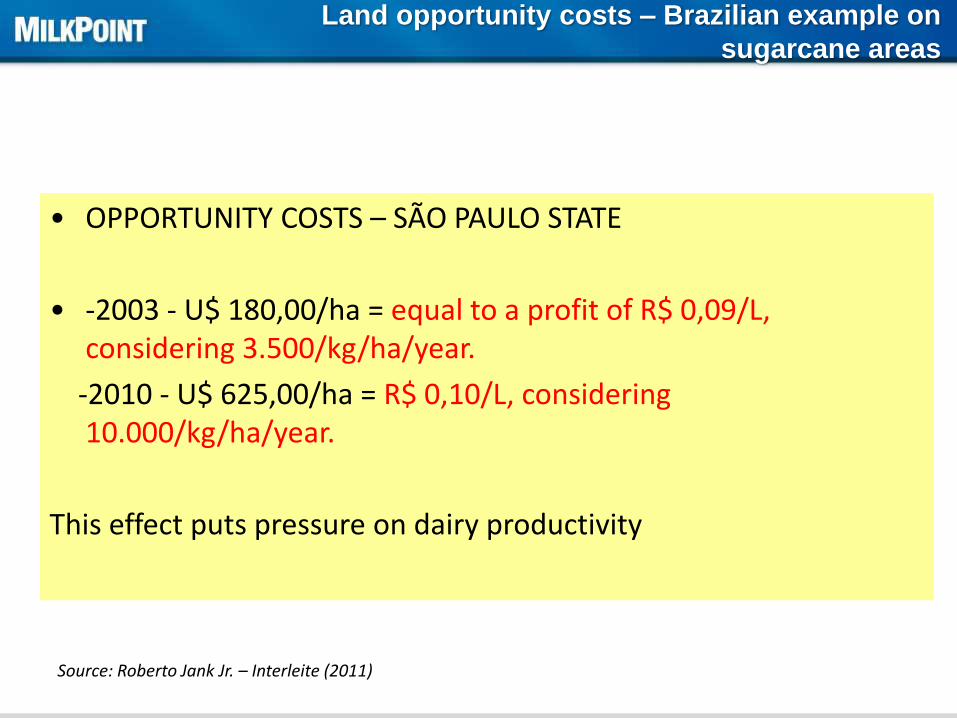
Land opportunity costs – Brazilian example on
sugarcane areas
• OPPORTUNITY COSTS – SÃO PAULO STATE
• -2003 - U$ 180,00/ha = equal to a profit of R$ 0,09/L, considering 3.500/kg/ha/year.
-2010 - U$ 625,00/ha = R$ 0,10/L, considering 10.000/kg/ha/year.
This effect puts pressure on dairy productivity
Source: Roberto Jank Jr. – Interleite (2011)
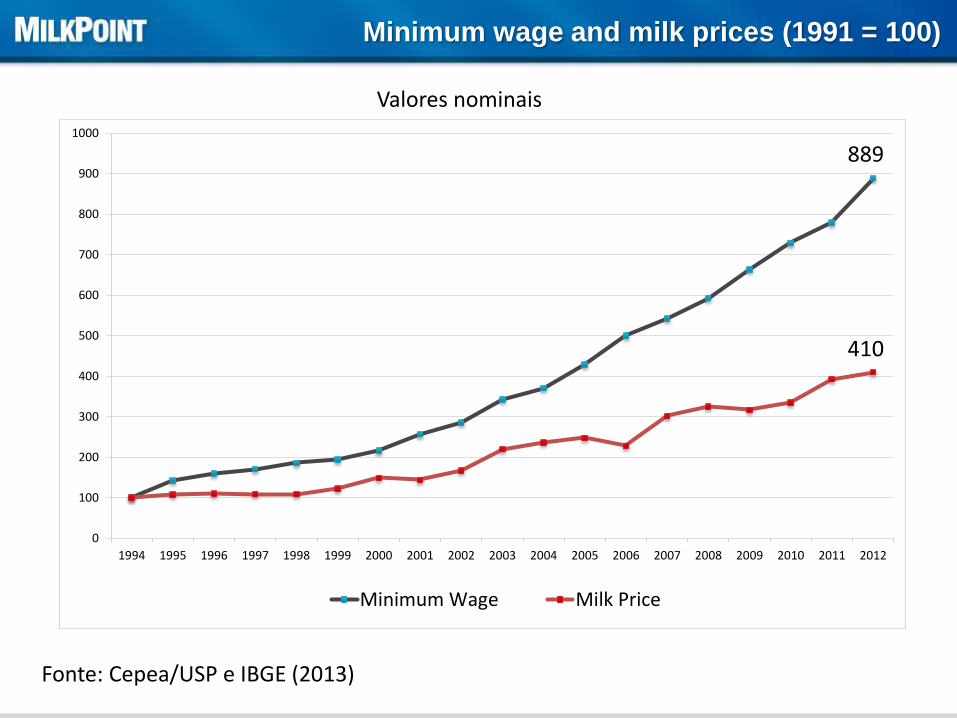
Fonte: Cepea/USP e IBGE (2013)
Minimum wage and milk prices (1991 = 100)
779
393
Valores nominais
0
100
200
300
400
500
600
700
800
900
1000
1994 1995 1996 1997 1998 1999 2000 2001 2002 2003 2004 2005 2006 2007 2008 2009 2010 2011 2012
Minimum Wage Milk Price
410
889
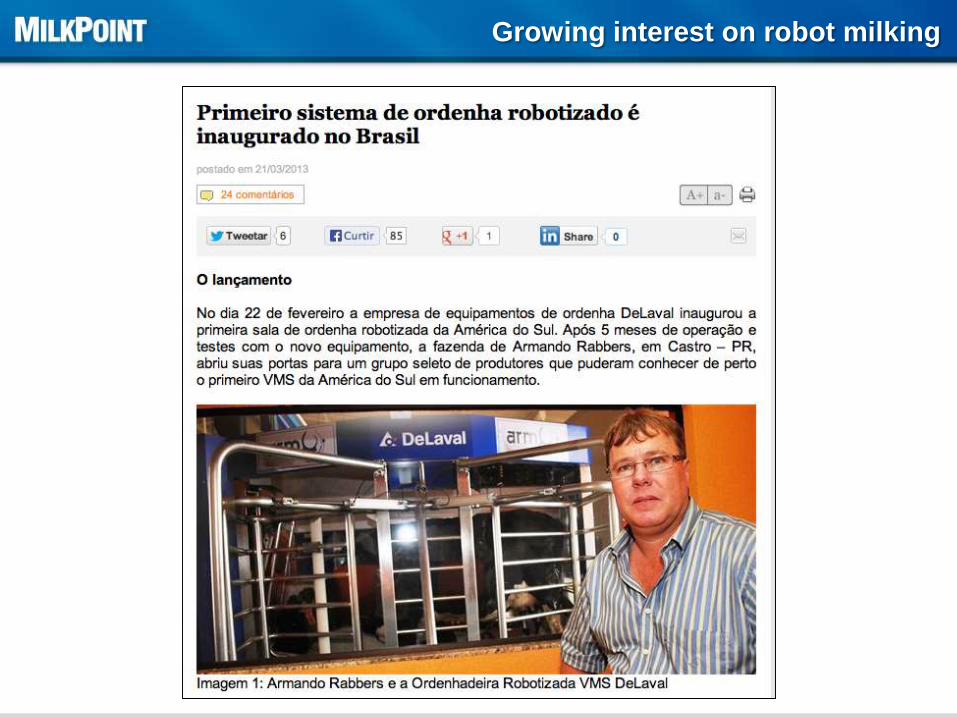
Growing interest on robot milking

Survey on number/profile of dairy producers
• 48 dairy companies
• June/July 2013
• 17,5 million liters/day
• 30% of inspected production

Survey on number/profile of dairy producers
Considering total inspected production
Number of Producers Volume
Ranges liters/day Number % Liters/day %
Up to 250 168.463 67% 14.062.050 23%
250-500 46.637 19% 12.679.935 21%
500-1000 22.668 9,0% 12.432.707 20%
1000-3000 10.821 4,3% 13.668.693 22%
More than 3000 2.194 0,9% 8.357.996 14%
Total 250.782 100% 61.201.381 100%
Average: 249 kg/day
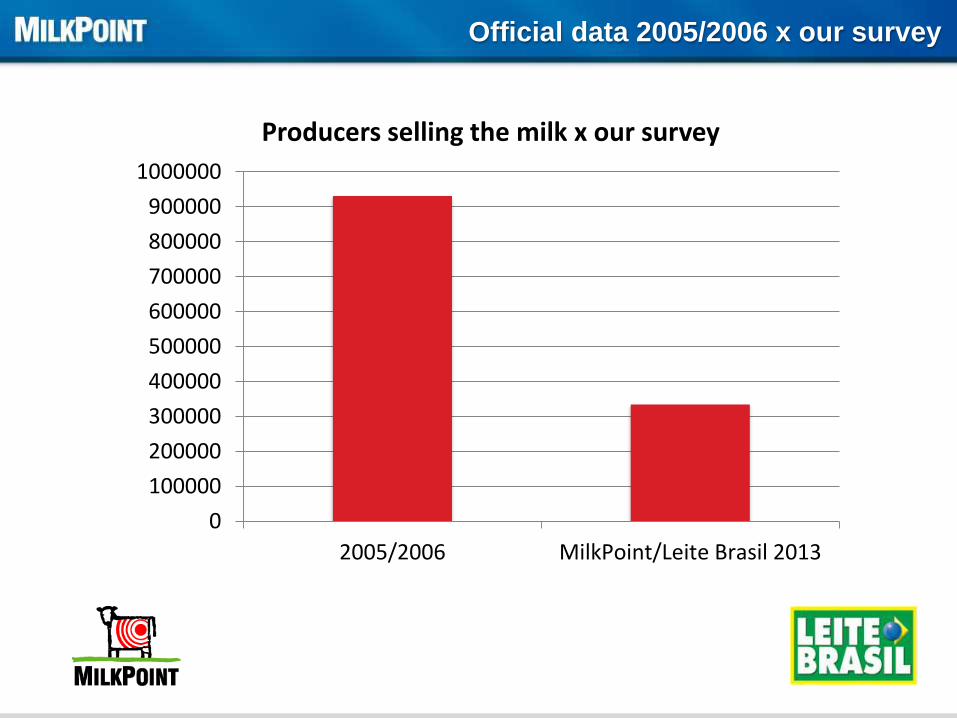
Official data 2005/2006 x our survey
0
100000
200000
300000
400000
500000
600000
700000
800000
900000
1000000
2005/2006 MilkPoint/Leite Brasil 2013
Producers selling the milk x our survey

Official data 2005/2006 x our survey
0
100000
200000
300000
400000
500000
600000
700000
800000
900000
1000000
2005/2006 MilkPoint/Leite Brasil 2013
Producers selling the milk x our survey
Every 6 minutes a producer left the
business!

• Population income raised and unemployment rate fell steadily to
less that 5% higher consumption but also labor and sucession
challenges in farms
• Higher land opportunity costs improve productivity or leave
• Investments in processing capacity aiming domestic market
and exports
• Import tax shielded (to some extent) Brazilian market to what was
happening in the world artificially high internal prices
• But production lagged behind consumption market were tight
and industries were pressured
Dynamics after 2007
0.500
0.600
0.700
0.800
0.900
1.000
1.100
1.200
1.300
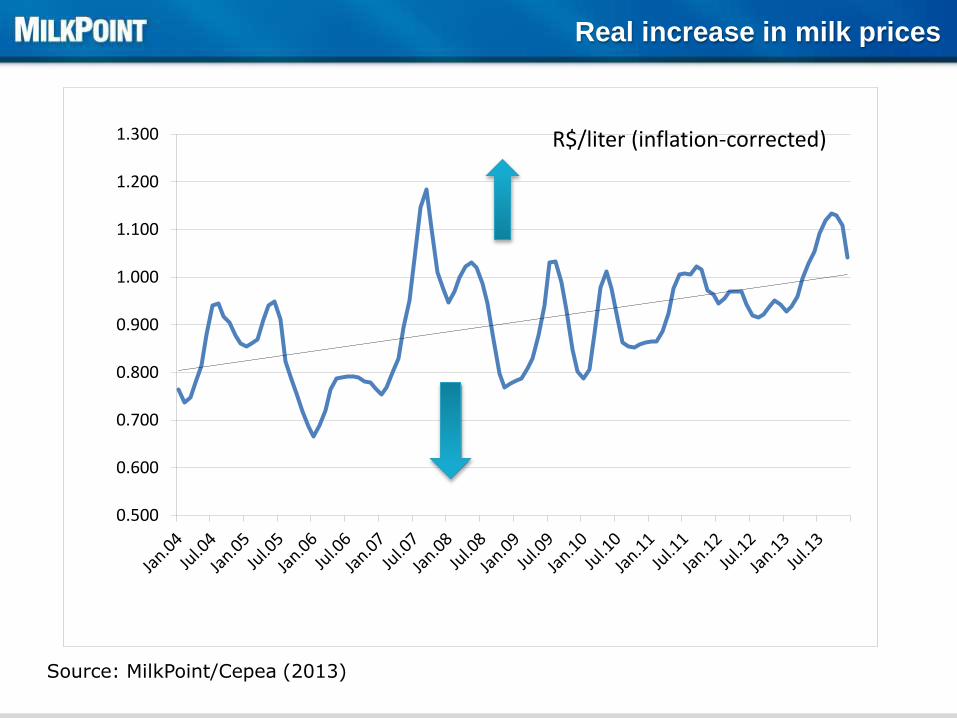
Real increase in milk prices
Source: MilkPoint/Cepea (2013)
R$/liter (inflation-corrected)
• Averages hide a big range in prices received by dairy farmers
• Within the same region, there may be producers getting R$
0,80/liter up to R$ 1,30/liter
– Volume
– Quality
– Influence, etc
• Are they in the same business?
• Efficient large farmers do have a good business!
Dynamics after 2007

Top 100 grew nearly 10% in 2013
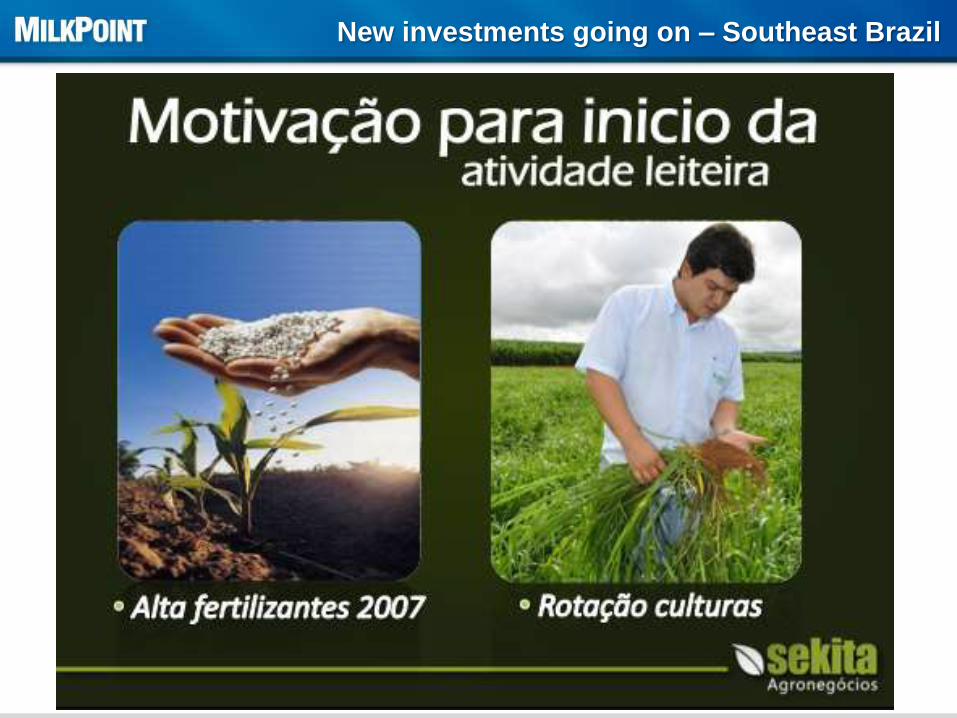
New investments going on – Southeast Brazil

New investments going on – Midwest Brazil
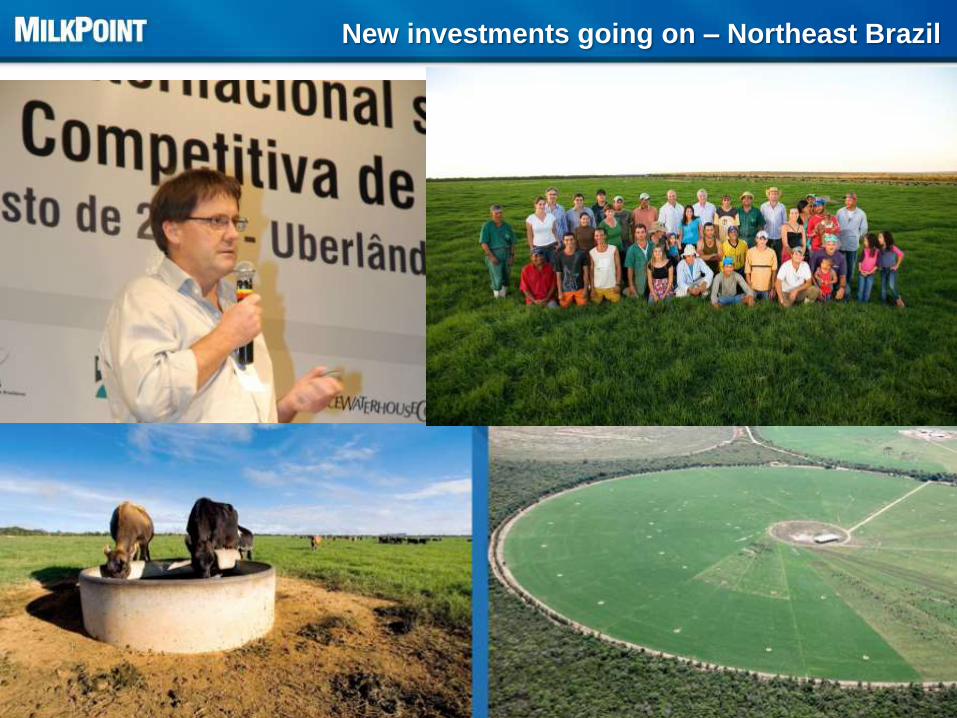
New investments going on – Northeast Brazil

Progressive producers – South Brazil

Midwest Brazil
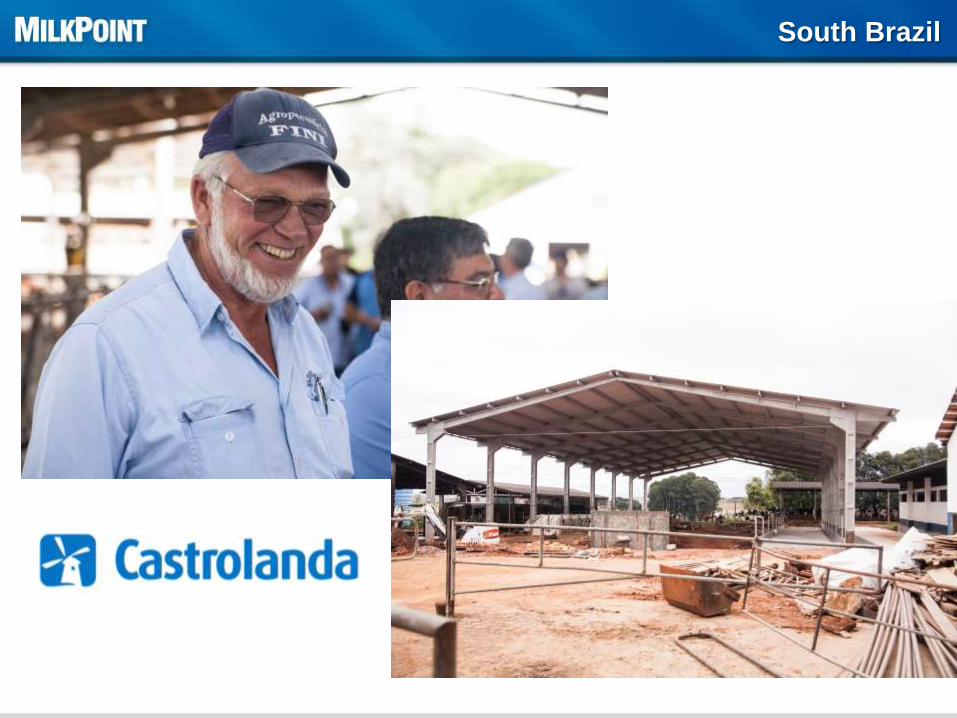
South Brazil
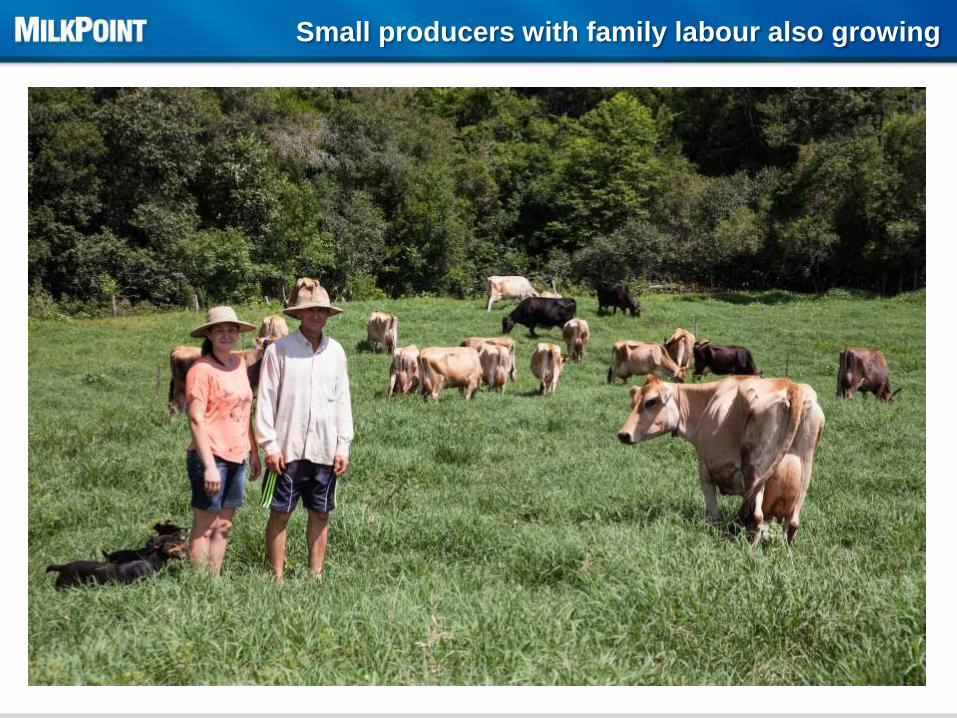
Small producers with family labour also growing

Small producers with family labour also growing

•How long it will last for?
But...

Real retail prices for a mix of dairy products
0.00
0.50
1.00
1.50
2.00
2.50
3.00
1.9
.06
1.1
1.0
6
1.1
.07
1.3
.07
1.5
.07
1.7
.07
1.9
.07
1.1
1.0
7
1.1
.08
1.3
.08
1.5
.08
1.7
.08
1.9
.08
1.1
1.0
8
1.1
.09
1.3
.09
1.5
.09
1.7
.09
1.9
.09
1.1
1.0
9
1.1
.10
1.3
.10
1.5
.10
1.7
.10
1.9
.10
1.1
1.1
0
1.1
.11
1.3
.11
1.5
.11
1.7
.11
1.9
.11
1.1
1.1
1
1.1
.12
1.3
.12
1.5
.12
1.7
.12
1.9
.12
1.1
1.1
2
1.1
.13
1.3
.13
1.5
.13
1.7
.13
1.9
.13
1.1
1.1
3
Composto Varejo Composto Indústria ProdutorFonte: CEPEA, MilkPoint; Elaboração: MilkPoint
R$/liter – inflation corrected

Industry lost margin to producers and retailers
0.93
0.86 0.86
0.95 0.94
1.04
0.760.78 0.77
0.670.62
0.71
0.610.64
0.590.64
0.71
0.75
0.40
0.50
0.60
0.70
0.80
0.90
1.00
1.10
2008 2009 2010 2011 2012 2013
% Produtor
% Indústria
% Varejo
Fonte: CEPEA e MilkPoint (2013)
Inflation-corrected values for a mix of UHT, pasteurized, powder milk and cheese
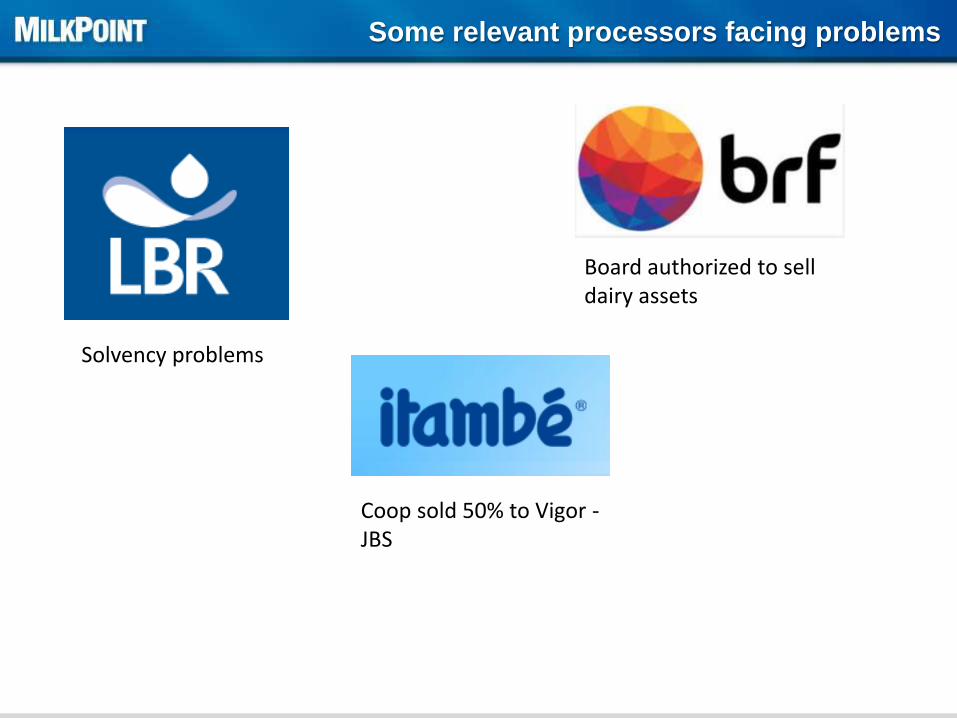
Some relevant processors facing problems
Solvency problems
Coop sold 50% to Vigor -JBS
Board authorized to sell dairy assets

New players studying Brazil, but only a minor deal ocurred

What to expect?

• Large price ranges will continue
• This, coupled with opportunity costs, will lead to a
structural change in production
• Many will leave the business, but production will keep
growing
• How many will be producing milk in 10 years? Good
question!
• Production will grow less – 2-3% in average, compared
to >4% from 2007-2013
• Brazil will still be an opportunistic exporter and a minor
importer, unless...
• Import taxes are removed (if so, the change will be more
dramatic and faster!)
What to expect?
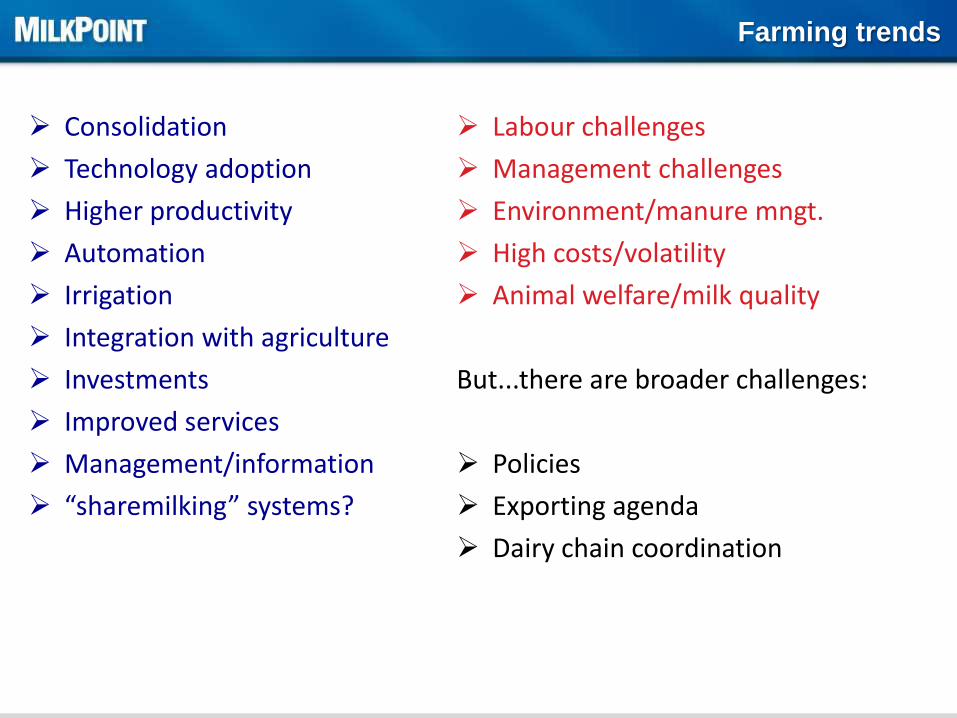
Farming trends
Consolidation
Technology adoption
Higher productivity
Automation
Irrigation
Integration with agriculture
Investments
Improved services
Management/information
“sharemilking” systems?
Labour challenges
Management challenges
Environment/manure mngt.
High costs/volatility
Animal welfare/milk quality
But...there are broader challenges:
Policies
Exporting agenda
Dairy chain coordination