Embed Size (px)
Citation preview

0
0http://www.fhi.co.jp/english/ir/index.html
Presentation of Business Resultsfor the 1st Half of FYE2013
Fuji Heavy Industries Ltd.October 30, 2012
1
1http://www.fhi.co.jp/english/ir/index.html
A Summary of Business ResultsA Summary of Business ResultsA Summary of Business Results

2
2http://www.fhi.co.jp/english/ir/index.html
Actual Results1st Half
FYE March 2012
Actual Results1st Half
FYE March 2013
Increase /Decrease
Passenger car 35.9 45.4 +9.5Minicar 36.7 26.6 -10.1
Domestic total 72.6 72.0 -0.6U.S. 113.5 164.4 +50.8Canada 14.7 16.3 +1.6Russia 5.6 11.1 +5.5Europe 14.6 25.4 +10.8Australia 16.4 22.0 +5.7China 18.9 26.6 +7.7Others 9.7 10.7 +1.0
Overseas total 193.3 276.4 +83.1Total 265.9 348.4 +82.5
(Thousand Units)
1st Half : Consolidated Automobile Sales
* Canada figures of FYE2012 and China figures of FYE2013 are consolidated on the calendar year basis from Jan. to Jun.
Total consolidated sales for the first six-months of the fiscal year ending March 2013 came to 348.4 thousand units. This was the highest first half sales figure ever thanks to worldwide sales increases mainly for the new Impreza launched at the end of last year.Domestic sales fell 0.6 thousand units to reach 72 thousand units due to a drop in minicar sales. Sales increases for the Impreza launched last year, the BRZ, as well as the Legacy which underwent "a minor facelift" in May of this year brought sales of passenger vehicles up 9.5 thousand units year on year to total 45.4 thousand units.In overseas markets, sales were up across the board mainly for the Impreza, which brought year-on-year sales up 83.1 thousand units for a total of 276.4 thousand units. It was the highest number of unit sales ever recorded for a first fiscal half.

3
3http://www.fhi.co.jp/english/ir/index.html
Actual Results1st Half
FYE March 2012
Actual Results1st Half
FYE March 2013
Increase /Decrease
Net sales 6,550 8,980 +2,430
Domestic 2,245 3,098 +853
Overseas 4,305 5,883 +1,577
Operating income 188 433 +245
Ordinary income 216 453 +237Income before income taxes and minority interests
402 459 +57
Net income 328 404 +77
FHI exchange rate ¥80/US$ ¥80/US$ -¥0/US$
1st Half : Consolidated Statements Income
(100 Million Yen)
Net sales grew 243.0 billion yen (37.1%) year on year to total 898.0 billion yen. This is an all-time high for first fiscal half sales. The uptick comes from a gain of 244.3 billion yen resulting from a better sales mix variance due to increases in new car sales volumes in overseas markets as well as a gain of 7.1 billion yen from sales increases at the three internal companies. These gains offset an exchange loss of 8.4 billion yen due to the appreciation of the yen.Operating income rose by 24.5 billion yen (130.6%) to reach 43.3 billion yen. Negative factors such as higher SG&A expenses, the stronger yen, and increased R&D expenses were all offset by a better sales mix variance due to increases in sales volumes and reduced materials costs. This will be looked at in further detail later on.The operating income increase brought ordinary income up 23.7 billion yen (110.0%) to total 45.3 billion yen.As a result of this jump in ordinary income, income before income taxes and minority interests amounted to 45.9 billion yen, up 5.7 billion yen (14.2%) over last fiscal year when a gain on the sale of the Subaru Building was posted. Net income rose 7.7 billion yen (23.5%) to reach 40.4 billion yen.

4
4http://www.fhi.co.jp/english/ir/index.html
188
433
-432
-20-43
144
596
Improvementof sales
volume &mixture and
others
Reductionin cost
Increase ofSG&A
expensesand others
Loss oncurrencyexchange
Increaseof R&D
expenses
Operating Income1st Half
FYE March 2012
Operating Income1st Half
FYE March 2013+24.5 billion yen
(100 Million Yen)
1st Half : Analysis of Increase and Decreasein Operating Income Changes (Consolidated)
Domestic : Improvement of volume & mixtureOverseas : Improvement of volume & mixture
US$ : -8EURO : -20CA$ : -10Currency exchange adjustment : -5
FHI : +132SIA : +12
Increase of fixed cost, SG&A expenses and warranty claims
Let’s look at the reasons behind the year-on-year increase of 24.5 billion yen in operating income that went from 18.8 billion yen to 43.3 billion yen.The primary reason for the earnings increase was a gain of 59.6 billion yen due to good sales mix variances. This gain can be broken down into the following three areas.First, we saw a gain of 5.2 billion yen in domestic sales of new models. Although minicar sales fell, sales of passenger vehicles, including the Impreza, drove overall domestic sales up.Next, we saw a gain of 36.1 billion yen in overseas sales of new models. Robust sales of the Impreza brought sales for the first six-month period way up, significantly exceeding sales for the same period last year which saw a slump in production and sales due to the March 11 earthquake.Finally, we had a gain of 18.3 billion yen due to inventory adjustments and others.Another factor behind the boost in operating income was a gain of 14.4 billion yen related to materials costs. This includes a gain of 13.2 billion yen generated by FHI as well as a gain of 1.2 billion yen coming from SIA. FHI generated a gain of 8.8 billion yen from reduced materials costs and another gain of 4.4 billion yen due to lower materials prices and better market conditions. SIA yielded a gain of 1.4 billion yen through cost reductions and a loss of 0.2 billion yen due to materials prices, etc.The main factor bringing operating income down was a loss of 43.2 billion yen due to increases in SG&A expenses. This loss can be broken down into the following three areas.First, we see that an increase in fixed manufacturing costs generated a loss of 20.3 billion yen, with a loss of 18.8 billion yen coming from FHI and another loss of 1.5 billion yen at SIA. FHI generated a loss of 6.8 billion yen due to increased costs for suppliers’ dies and a loss of 12.0 billion yen due to higher fixed processing costs. SIA lost 0.8 billion yen due to higher costs for suppliers’ dies and 0.7 billion yen due to an increase in fixed processing costs.Next we see that an increase in SG&A expenses led to a loss of 20.8 billion yen. SG&A expenses also surpassed what they were during the same period last year when they dropped in the wake of the March 11 earthquake. The 20.8 billion yen loss also includes a loss of 4.5 billion yen at FHI from transportation and packing cost, 0.1 billion yen at domestic dealers, a loss of 9.3 billion yen generated at SOA from higher sales promotion costs related to the increased sales volume, a loss of 0.3 billion yen at our Canadian subsidiaries, and a loss of 6.6 billion yen from other operations.The third and last factor includes an increase in costs associated with warranty claims that led to a loss of 2.1 billion yen.Another contributing factor that brought operating income down was a foreign exchange loss of 4.3 billion yen. This drop includes a loss of 0.8 billion yen due to a slight appreciation of the yen against the U.S. dollar, a loss of 2.0 billion yen due to an approximate 11 yen appreciation against the euro, and a loss of 1.0 billion yen due to an approximate 4 yen appreciation againstthe Canadian dollar. This figure also includes a loss of 0.5 billion yen due to foreign exchange adjustments for transactions between FHI and its overseas subsidiaries.Finally, an increase in R&D expenses resulted in a loss of 2.0 billion yen.These factors combined brought consolidated operating income for the first six-month period of the fiscal year ending March 2013 up 24.5 billion yen to total 43.3 billion yen.

5
5http://www.fhi.co.jp/english/ir/index.html
Actual Results1st Half
FYE March 2012
Actual Results1st Half
FYE March 2013
Increase /Decrease
Automobile5,943 8,304 +2,361
90.7% 92.5%
Aerospace374 417 +425.7% 4.6%
Industrial products
173 163 -112.6% 1.8%
Other59 96 +37
0.9% 1.1%
Total 6,550 8,980 +2,430
(100 Million Yen / Percentage of Total Sales)
1st Half : Consolidated Net Sales by Business Segment
Looking at net sales by business segment, we see that sales in the automobile business rose by 236.1 billion yen year on year to total 830.4 billion yen. This increase was due to climbing sales volumes and healthier sales mixes in the North American and domestic markets despite foreign exchange losses resulting from the strong yen.Aerospace Division sales totaled 41.7 billion yen, up 4.2 billion yen year on year, due to strong sales in the commercial aircraft sector.Sales for the Industrial Products Division, on the other hand, were down 1.1 billion yen with the total reaching just 16.3 billion yen. This drop was due to the negative impact of the strong yen on foreign exchange transactions as well as fewer engine sales than last year when sales were pushed up by the demand associated with reconstruction efforts following the March 11 earthquake.Other segments saw sales increase by 3.7 billion yen to total 9.6 billion yen due to the sale of the wind power generator business and an increase in sales of sanitation trucks.

6
6http://www.fhi.co.jp/english/ir/index.html
Actual Results1st Half
FYE March 2012
Actual Results1st Half
FYE March 2013
Increase /Decrease
Automobile 171 397 +226
Aerospace 10 19 +9Industrialproducts 3 4 +1
Other 4 10 +7Elimination andcorporate 1 2 +2
Total 188 433 +245
1st Half : Consolidated Operating Income by Business Segment
(100 Million Yen)
Looking at operating income by business segment, we see that the operating income for the automobile business totaled 39.7 billion yen. That's a year-on-year increase of 22.6 billion yen. This increase was essentially due to an increase in new model sales in the U.S. and Japan as well as cost reductions. These positive factors offset the higher SG&A expenses associated with growing sales of new models and higher factory expenses due to the upswing in operations.The Aerospace Division posted an operating income total of 1.9 billion yen, up 0.9 billion yen on a year-on-year basis, due to an increase in sales volume.The Industrial Products Division saw its operating income inch up 0.1 billion yen tototal of 0.4 billion yen due to the better sales mix for engines.Operating income for other business segments rose 0.7 billion yen to reach 1.0 billion yen.

7
7http://www.fhi.co.jp/english/ir/index.html
Actual Results1st Half
FYE March 2012
Actual Results1st Half
FYE March 2013
Increase /Decrease
Japan3,544 4,376 +832
54.1% 48.7%
North America2,772 3,745 +973
42.3% 41.7%
Other234 860 +6263.6% 9.6%
Total 6,550 8,980 +2,430
1st Half : Consolidated Net Sales by Geographic Area <Appendix>
(100 Million Yen / Percentage of Total Sales)

8
8http://www.fhi.co.jp/english/ir/index.html
Actual Results1st Half
FYE March 2012
Actual Results1st Half
FYE March 2013
Increase /Decrease
Japan 26 344 +318
North America 102 87 -15
Other 2 -1 -4
Elimination andcorporate 58 3 -55
Total 188 433 +245
1st Half : Consolidated Operating Income by Geographic Area <Appendix>
(100 Million Yen)
9
9http://www.fhi.co.jp/english/ir/index.html
Actual Results1st Half
FYE March 2012
Actual Results1st Half
FYE March 2013
Increase /Decrease
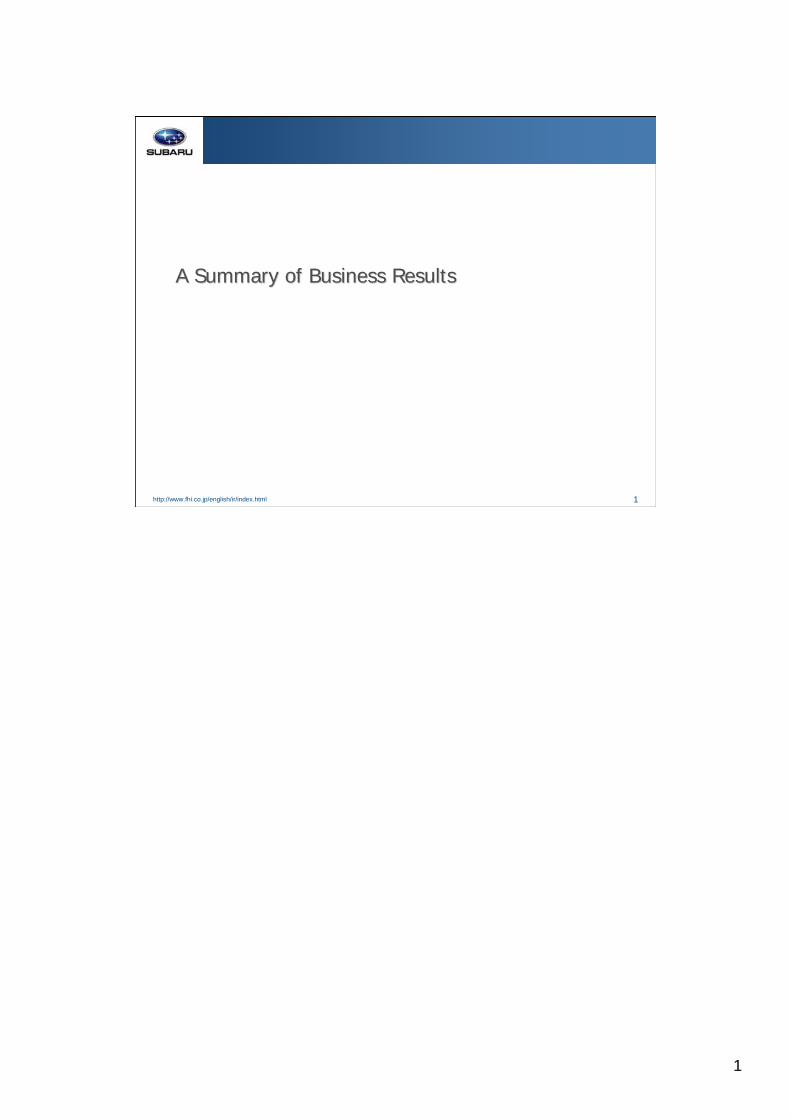
North America2,991 4,017 +1,026
69.5% 68.3%
Europe459 719 +26010.7% 12.2%
Asia390 578 +1889.1% 9.8%
Other465 569 +10410.8% 9.7%
Total 4,305 5,883 +1,577
1st Half : Overseas Net Sales <Appendix>
(100 Million Yen / Percentage of Total Sales)

10
10http://www.fhi.co.jp/english/ir/index.html
SIAActual Results
1st HalfFYE March 2012
Actual Results1st Half
FYE March 2013
Increase /Decrease
Net sales 1,552 1,995 +443Operating income -6 18 +24Net income -3 11 +14Subaru production(Thousand units) 68.6 87.3 +18.7
(million US$)
SOAActual Results
1st HalfFYE March 2012
Actual Results1st Half
FYE March 2013
Increase /Decrease
Net sales 2,861 4,074 +1,213Operating income 105 100 -5Net income 68 64 -4Retail sales(Thousand units) 127.9 164.4 +36.5
1st Half : Operating Results of Subsidiaries in U.S.

11
11http://www.fhi.co.jp/english/ir/index.html
Actual Results1st Half
FYE March 2012
Actual Results1st Half
FYE March 2013
Increase /Decrease
Non-Operating income 86 102 +17Interest & dividends income 9 11 +2
Equity in earnings of affiliates 5 1 -4
Non-operating expenses 57 82 +24Interest expenses 19 18 -2
Net 28 20 -8Financial revenue and expenditure -10 -6 +4FOREX effects 44 34 -10
Net of gain and loss onvaluation of derivatives 57 85 +28Net of FOREX gains and losses -13 -51 -38
(100 Million Yen)
1st Half : Consolidated Non-Operating Income and Expenses
Net non-operating income and expenses fell 0.8 billion yen year on year to hit 2.0 billion yen.Looking at financial revenue and expenditures, we see that expenditures fell 0.4 billion yen to reach negative 0.6 billion yen while foreign exchange-related gains dropped by 1.0 billion yen to positive 3.4 billion yen.Foreign exchange fluctuations had a significant impact on non-operating income and expenses mainly in the following two areas: (1) gains and losses on revaluation of derivatives, and (2) foreign exchange gains and losses.The net gain on valuation of derivatives was up 2.8 billion yen year on year, rising from 5.7 billion yen to 8.5 billion yen.Looking at foreign exchange gains and losses, we saw a loss of 4.3 billion yen due to the difference between market and hedge rates despite a year-on-year gain of 0.5 billion yen in foreign exchange adjustments with overseas subsidiaries. These factors combined generated a loss of 3.8 billion yen, resulting in a net foreign exchange loss of 5.1 billion yen.

12
12http://www.fhi.co.jp/english/ir/index.html
Actual Results1st Half
FYE March 2012
Actual Results1st Half
FYE March 2013
Increase /Decrease
Extraordinary income 271 35 -235Gain on sales of noncurrent assets 265 4 -260Gain on sales of investment securities 5 4 -2State subsidy - 17 +17Gain on sale of loans receivable - 3 +3Other 1 7 +6
Extraordinary loss 85 29 -55Loss on sales and retirement of noncurrent assets
6 8 +1
Impairment loss 1 0 -0Loss on disaster 73 - -73Loss on reduction of noncurrent assets - 17 +17Other 5 4 -1Net 186 6 -180
(100 Million Yen)
1st Half : Consolidated ExtraordinaryIncome and Expenses
Let’s look at extraordinary gains and losses. No major extraordinary gains or losses were posted this fiscal year. That’s why we see a 23.5 billion yen year-on-year drop in extraordinary gains which totaled out at 3.5 billion yen and a 5.5 billion yen year-on-year decline in extraordinary losses which totaled out at 2.9 billion yen. The figures stand in stark comparison to those for the first half of last fiscal year when we posted a gain of 26.1 billion yen from the sale of the Subaru Building and a disaster loss of 7.3 billion yen. These factors combined brought net extraordinary income down 18.0 billion yen for a total of 0.6 billion yen.

13
13http://www.fhi.co.jp/english/ir/index.html
As of March 31,
2012
As ofSeptember 30,
2012
Increase /Decrease
Total assets 13,525 13,951 +426Current assets 7,625 8,072 +447
Noncurrent assets 5,900 5,879 -21
Interest bearing debt 3,410 3,301 -109Net assets 4,516 4,787 +271Retained earnings 1,885 2,255 +369
Shareholder’s equity 4,503 4,773 +270Shareholder’s equity to total assets 33.3% 34.2% +0.9%
D/E ratio 0.76 0.69 -0.07
Consolidated Balance Sheets
(100 Million Yen)
The balance sheet shows total assets amounting to 1,395.1 billion yen as of September 30, 2012.Total assets increased 42.6 billion yen year on year due to a jump in net income resulting from better sales volumes as well as the consolidation of overseas sales subsidiaries despite the negative impact of the strong yen which generated a loss of 18.1 billion yen.Interest-bearing debt declined 10.9 billion yen to reach 330.1 billion yen. This drop is due to the redemption of corporate bonds amounting to 20.0 billion yen despite the issuing of a 10.0 billion yen bond in June. We will continue to work on reducing interest-bearing debt in light of market conditions.Net assets totaled 478.7 billion yen, up 27.1 billion yen, due primarily to a 36.9 billion yen increase in retained earnings.The shareholders’ equity to total assets ratio rose 0.9 percentage points from what it was at the end of the previous fiscal year to reach 34.2%. The debt-to-equity ratio climbed 0.07 points to reach 0.69, due primarily to an increase in accumulated earnings as well as a decrease in interest-bearing debt.
14
14http://www.fhi.co.jp/english/ir/index.html
Actual Results1st Half
FYE March 2012
Actual Results1st Half
FYE March 2013
Increase /Decrease
Net cash provided by (used in) operating activities -92 1,103 +1,195Net cash provided by (used in) investing activities 140 -324 -464Free cash flows 47 778 731
Net cash provided by (used in) financing activities 522 -327 -848
Effect of exchange rate change on cash and cash equivalents
-53 -53 -0
Net increase (decrease) in cash and cash equivalents 516 398 -117Increase (decrease) in cash and cash equivalents resulting from change of scope of consolidation
0 213 +213
Cash and cash equivalents at end of period 2,793 3,192 +399
(100 Million Yen)
1st Half : Consolidated Statementof Cash Flows
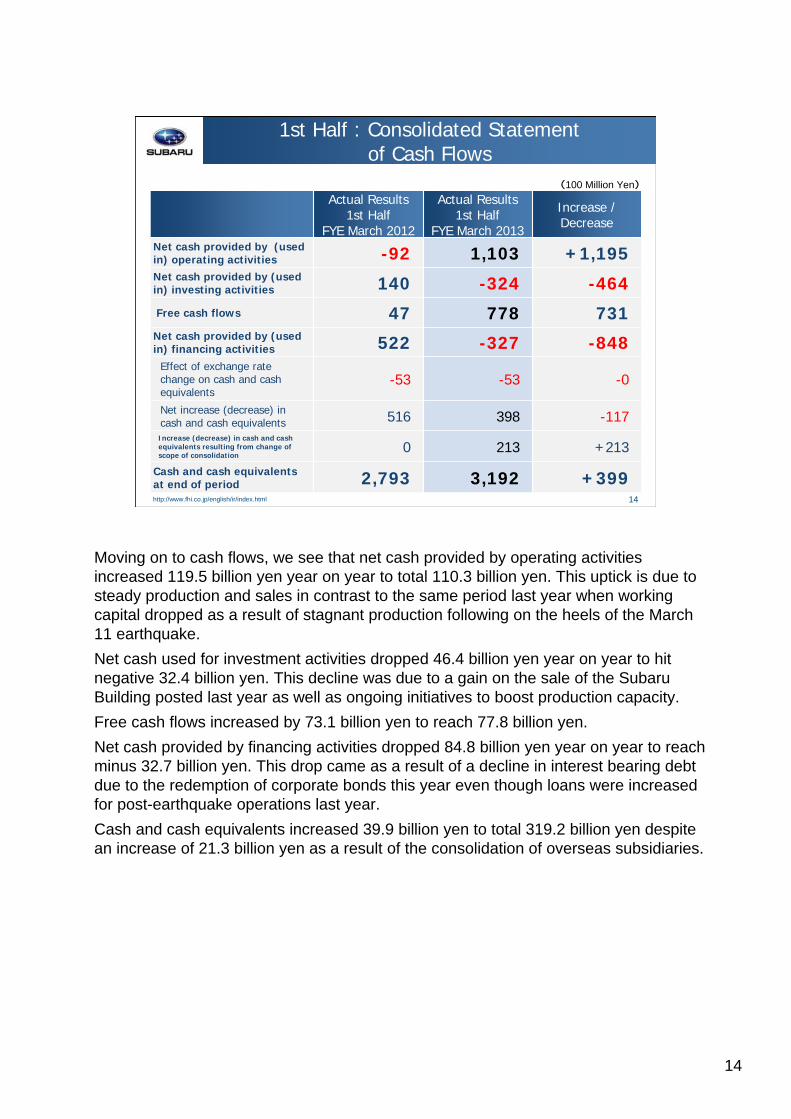
Moving on to cash flows, we see that net cash provided by operating activities increased 119.5 billion yen year on year to total 110.3 billion yen. This uptick is due to steady production and sales in contrast to the same period last year when working capital dropped as a result of stagnant production following on the heels of the March 11 earthquake.Net cash used for investment activities dropped 46.4 billion yen year on year to hit negative 32.4 billion yen. This decline was due to a gain on the sale of the Subaru Building posted last year as well as ongoing initiatives to boost production capacity.Free cash flows increased by 73.1 billion yen to reach 77.8 billion yen.Net cash provided by financing activities dropped 84.8 billion yen year on year to reach minus 32.7 billion yen. This drop came as a result of a decline in interest bearing debt due to the redemption of corporate bonds this year even though loans were increased for post-earthquake operations last year.Cash and cash equivalents increased 39.9 billion yen to total 319.2 billion yen despite an increase of 21.3 billion yen as a result of the consolidation of overseas subsidiaries.

15
15http://www.fhi.co.jp/english/ir/index.html
Actual Results1st Half
FYE March 2012
Actual Results1st Half
FYE March 2013
Increase /Decrease
Domestic production 178.0 272.5 +94.5
Domestic sales 76.2 72.6 -3.6
Passenger car 38.1 47.4 +9.4
Minicar 38.2 25.2 -13.0
Number of vehicles exported 114.2 188.8 +74.6Components for overseas production 72.7 87.0 +14.3
Total 263.1 348.4 +85.3
(Thousand units)
1st Half : Non-Consolidated Automobile Sales<Appendix>
* Domestic Production figures include Toyota 86.

16
16http://www.fhi.co.jp/english/ir/index.html
Net Sales & Operating Income <Appendix>
Operating Income(¥100M)
Net Sales(¥100M)
3,703
4,337
3,7064,059
3,004
3,5463,744
4,8774,691
4,289
347
259
173161
9181
107107
161
226
0
1,000
2,000
3,000
4,000
5,000
6,000
1Q 2Q 3Q 4Q 1Q 2Q 3Q 4Q 1Q 2Q0
50
100
150
200
250
300
350
400
FY2011 FY2012 FY2013
¥92/$ ¥88/$ ¥83$ ¥83/$ ¥82/$ ¥79/$ ¥79/$ ¥78/$ ¥81/$ ¥79/$

17
17http://www.fhi.co.jp/english/ir/index.html
(1,000 Cars)
Complete Cars Production & Retail Sales <Appendix>
Production Retail
* Production figures include Toyota 86.
162 161 164
196 196182 178174 172
136
111
138
167
191
158150147
162156160
0
50
100
150
200
Apr.-Jun.
Jul.-Sep. Oct.-Dec.
Jan.-Mar.
Apr.-Jun.
Jul.-Sep. Oct.-Dec.
Jan.-Mar.
Apr.-Jun.
Jul.-Sep.
2010 2011 2012
18
18http://www.fhi.co.jp/english/ir/index.html
Shareholder’s Equityto Total Assets
FCF(¥100M)
Free Cash Flows & Shareholder’s Equity to Total Assets <Appendix>
246
640
397
78 47
-42
283221
778871
34.2%
33.7%
33.6% 33.3%33.7%34.2%34.7%34.7%35.4%
31.9%
-100
100
300
500
700
900
1,100
1Q 2Q 3Q 4Q 1Q 2Q 3Q 4Q 1Q 2Q0%
7%
14%
21%
29%
36%
43%
FY2011 FY2012 FY2013

19
19http://www.fhi.co.jp/english/ir/index.html
D/E RatioInterest Bearing Debt(¥100M)
Interest Bearing Debts & D/E Ratio <Appendix>
3,473 3,3673,179
3,306
3,965 3,8663,688
3,410 3,381 3,301
0.690.74
0.820.76
0.850.89
0.91
0.80.76
0.89
0
500
1,000
1,500
2,000
2,500
3,000
3,500
4,000
4,500
1Q 2Q 3Q 4Q 1Q 2Q 3Q 4Q 1Q 2Q0.0
0.2
0.4
0.6
0.8
1.0
1.2
1.4
FY2011 FY2012 FY2013

20
20http://www.fhi.co.jp/english/ir/index.html
Outlook for the term Ending March 2013Outlook for the term Ending March 2013Outlook for the term Ending March 2013

21
21http://www.fhi.co.jp/english/ir/index.html
Actual ResultsFYE March 2012
PlanFYE March 2013
Increase /Decrease
Passenger car 80.2 108.1 +28.0Minicar 92.2 52.1 -40.1
Domestic total 172.3 160.3 -12.1U.S. 280.4 348.8 +68.5Canada 28.2 33.4 +5.2Russia 15.9 17.3 +1.4Europe 39.1 49.0 +9.9Australia 36.9 41.7 +4.8China 48.3 40.3 -8.0Others 18.7 23.7 +4.9
Overseas total 467.5 554.1 +86.6Total 639.9 714.4 +74.6
(Thousand Units)
Full year : Consolidated Automobile Sales
* Canada figures of FYE2012 and China figures of FYE2013 are consolidated on the calendar year basis from Jan. to Dec.
Now let's look at our consolidated automobile sales plan for the fiscal year ending March 2013. Working in light of current market trends, we revised our plan downward by 6.4 thousand units, with an increase of 15 thousand units in domestic sales volumes and a decrease of 21 thousand units in overseas sales volumes. Despite the downward revision, we are still aiming for record high sales of 714.4 thousand units.Robust sales of the Impreza and the Legacy as well as the positive effect of the BRZ launch will bring passenger vehicle sales up 28 thousand units year on year to reach a total of 108.1 thousand units. However, overall domestic automobile sales will dip 12.1 thousand units year on year to total 160.3 thousand units as minicar sales are expected to fall from where they were last year when discontinuation of minicarproduction boosted sales.Sales in overseas markets will increase 86.6 thousand units year on year to reach 554.1 thousand units. While we expect sales to decline in China, we plan to fuel sales of the Impreza in other markets.

22
22http://www.fhi.co.jp/english/ir/index.html
Actual ResultsFYE March 2012
PlanFYE March 2013
Increase /Decrease
Net sales 15,171 18,400 +3,229
Domestic 4,985 6,570 +1,586
Overseas 10,186 11,830 +1,643
Operating income 440 820 +380
Ordinary income 373 810 +437Income before income taxes and minority interests
529 780 +251
Net income 385 670 +285
FHI exchange rate ¥79/US$ ¥79/US$ +¥1/US$
Full year : Consolidated Statements Income
(100 Million Yen)
We revised our consolidated operating plan, with an upward revision to each income category.Net sales were adjusted downward to 20.0 billion yen (down 1.1%) since we lowered the projected sales volume and revised the estimated yen rate for the second fiscal half on the assumption that the yen will appreciate further. Anticipating healthier sales mixes in the domestic and North American markets, we made upward revisions to our forecast by 15.0billion yen (22.4%) for operating income, 18.0 billion yen (28.6%) for ordinary income, 18.0billion yen (30.0%) for income before taxes and minority interests, and 19.0 billion yen (39.6%) for net income.Net sales are expected to hit an all-time high of 1,840.0 billion yen, a year-on-year increase of 322.9 billion yen (21.3%). This surge will come from a gain of 316.6 billion yen resulting from a better sales mix variance due to increases in new car model sales volumes in the North American and other markets as well as a gain of 10.6 billion yen from increased sales at the three internal companies. The gain will come despite an exchange loss of 4.3 billion yen due to the appreciation of the yen against the euro and other currencies.Operating income is projected to total 82.0 billion yen, up 38.0 billion yen (86.5%) year on year. Factors behind this increase include a better sales mix variance and reduced materials costs, which will offset various negative factors such as higher SG&A expenses, the rise of the yen against the euro, and increased R&D expenses. This will be looked at in further detail later on.Ordinary income is expected to increase 43.7 billion yen (117.3%) year on year to total 81.0 billion yen. Income before income taxes and minority interests will total 78.0 billion yen, up 25.1 billion yen (47.5%) year on year, due to the gain on the sale of the Subaru Building that was posted last fiscal year. Net income is projected to total 67.0 billion yen, a year-on-year increase of 28.5 billion yen (74.2%).
23
23http://www.fhi.co.jp/english/ir/index.html
440820
-637
-19-70
274
832
(100 Million Yen)
Operating IncomeFYE March 2012
Operating IncomeFYE March 2013
Full Year : Analysis of Increase and Decrease in Operating Income Changes (Consolidated)
Improvementof sales
volume &mixture and
others
Reductionin cost
Increase ofSG&A
expensesand others
Increaseof R&D
expenses
+38.0 billion yen
Domestic : Improvement of volume & mixtureOverseas : Improvement of volume & mixture
FHI : +236SIA : +38
Increase of fixed cost and SG&A expenses Decrease of warranty claims
Loss oncurrencyexchange
US$ : +5EURO : -28CA$ : -1Currency exchange adjustment : -46
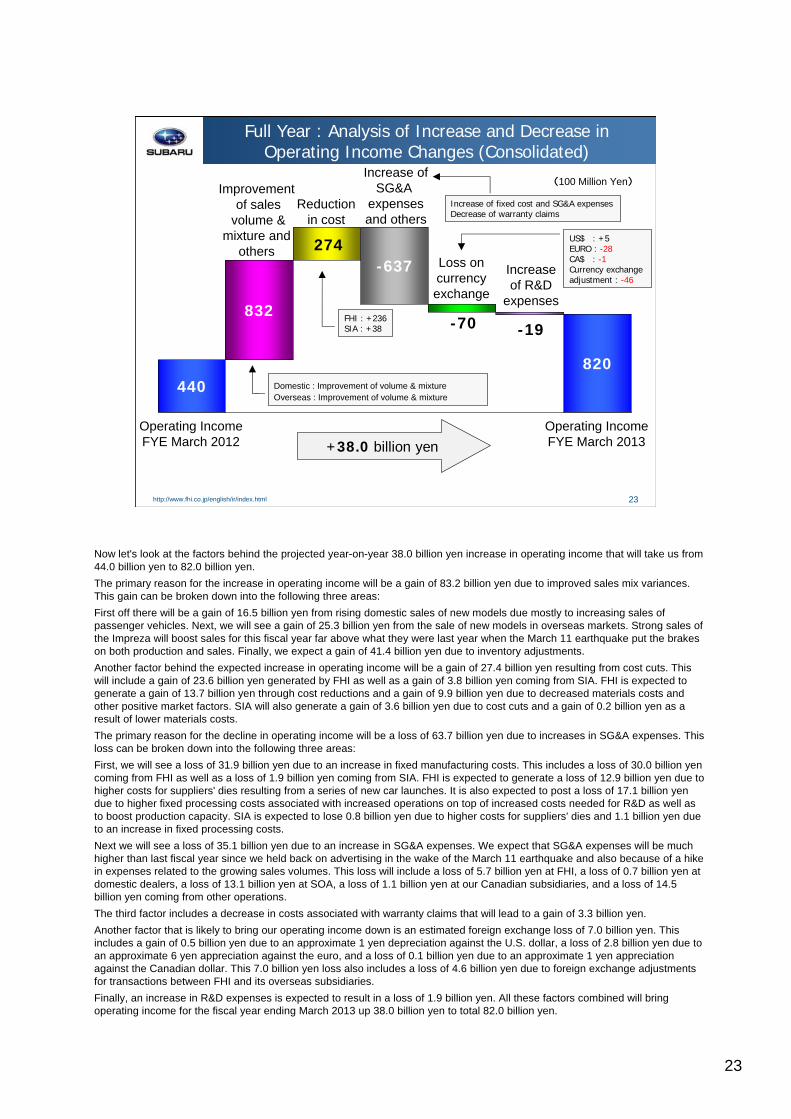
Now let's look at the factors behind the projected year-on-year 38.0 billion yen increase in operating income that will take us from 44.0 billion yen to 82.0 billion yen.The primary reason for the increase in operating income will be a gain of 83.2 billion yen due to improved sales mix variances. This gain can be broken down into the following three areas:First off there will be a gain of 16.5 billion yen from rising domestic sales of new models due mostly to increasing sales of passenger vehicles. Next, we will see a gain of 25.3 billion yen from the sale of new models in overseas markets. Strong sales of the Impreza will boost sales for this fiscal year far above what they were last year when the March 11 earthquake put the brakes on both production and sales. Finally, we expect a gain of 41.4 billion yen due to inventory adjustments.Another factor behind the expected increase in operating income will be a gain of 27.4 billion yen resulting from cost cuts. This will include a gain of 23.6 billion yen generated by FHI as well as a gain of 3.8 billion yen coming from SIA. FHI is expected to generate a gain of 13.7 billion yen through cost reductions and a gain of 9.9 billion yen due to decreased materials costs and other positive market factors. SIA will also generate a gain of 3.6 billion yen due to cost cuts and a gain of 0.2 billion yen as a result of lower materials costs.The primary reason for the decline in operating income will be a loss of 63.7 billion yen due to increases in SG&A expenses. This loss can be broken down into the following three areas:First, we will see a loss of 31.9 billion yen due to an increase in fixed manufacturing costs. This includes a loss of 30.0 billion yen coming from FHI as well as a loss of 1.9 billion yen coming from SIA. FHI is expected to generate a loss of 12.9 billion yen due to higher costs for suppliers' dies resulting from a series of new car launches. It is also expected to post a loss of 17.1 billion yen due to higher fixed processing costs associated with increased operations on top of increased costs needed for R&D as well as to boost production capacity. SIA is expected to lose 0.8 billion yen due to higher costs for suppliers' dies and 1.1 billion yen due to an increase in fixed processing costs.Next we will see a loss of 35.1 billion yen due to an increase in SG&A expenses. We expect that SG&A expenses will be much higher than last fiscal year since we held back on advertising in the wake of the March 11 earthquake and also because of a hikein expenses related to the growing sales volumes. This loss will include a loss of 5.7 billion yen at FHI, a loss of 0.7 billion yen at domestic dealers, a loss of 13.1 billion yen at SOA, a loss of 1.1 billion yen at our Canadian subsidiaries, and a loss of 14.5 billion yen coming from other operations.The third factor includes a decrease in costs associated with warranty claims that will lead to a gain of 3.3 billion yen.Another factor that is likely to bring our operating income down is an estimated foreign exchange loss of 7.0 billion yen. This includes a gain of 0.5 billion yen due to an approximate 1 yen depreciation against the U.S. dollar, a loss of 2.8 billion yen due to an approximate 6 yen appreciation against the euro, and a loss of 0.1 billion yen due to an approximate 1 yen appreciation against the Canadian dollar. This 7.0 billion yen loss also includes a loss of 4.6 billion yen due to foreign exchange adjustments for transactions between FHI and its overseas subsidiaries.Finally, an increase in R&D expenses is expected to result in a loss of 1.9 billion yen. All these factors combined will bring operating income for the fiscal year ending March 2013 up 38.0 billion yen to total 82.0 billion yen.

24
24http://www.fhi.co.jp/english/ir/index.html
SIA Actual ResultsFYE March 2012
PlanFYE March 2013
Increase /Decrease
Net sales 3,845 4,031 +186Operating income 82 44 -38Net income 51 26 -25Subaru production(Thousand units) 170.6 175.6 +5.0
(million US$)
SOA Actual ResultsFYE March 2012
PlanFYE March 2013
Increase /Decrease
Net sales 6,923 8,340 +1,417Operating income 105 111 +6Net income 74 73 -1Retail sales(Thousand units) 279.2 330.0 +50.8
Full Year : Operating Results of Subsidiaries in U.S.
25
25http://www.fhi.co.jp/english/ir/index.html
Actual Results1st HalfFYE2012
Actual Results
FYE2012 (a)
Actual Results1st HalfFYE2013
Plan
FYE2013 (b)
Increase/Decrease(b) - (a)
Capex 276 543 339 720 +177
Depreciation 254 537 247 600 +63
R&D 229 481 249 500 +19
Interest bearing debt 3,866 3,410 3,301 3,300 -110
Capex / Depreciation / R&D / Interest Bearing Debt<Appendix>
(100 Million Yen)

26
26http://www.fhi.co.jp/english/ir/index.html
Thank you !


![index [exhibitors.productronica.com] · 2019-08-08 · HOLDER FUJI NXT N610071334AA FUJI NXT H04 SMT N610059928AA WPH2030 FUJI Filter XH00400 N610071334AA DCPH0630 FUJI CP7 FILTER](https://img.dokumen.tips/doc/110x75/5e9f95a3be23337fb22f1412/index-2019-08-08-holder-fuji-nxt-n610071334aa-fuji-nxt-h04-smt-n610059928aa.jpg)