Embed Size (px)
Citation preview

Bill Russo (罗威)
President and CEO, Synergistics Ltd.
November, 2013
Towards A Green Automotive Industry
A Collaboration Model to Accelerate China’s Green Mobility Efforts
www.synergisticsltd.com

Executive Summary:
§ A structural shift of economic power from West to the East is taking place, with stunning economic growth most evident in China and India over the past 20 years. This growth momentum will continue, making the Asian economies the most important in the world for the steel industry.
§ The world has entered a new era since 2008, with over half of the world population now living in cities, and this increasingly urbanized world challenges the established set of paradigms for personal and commercial transportation, especially in the densely populated urban centers in China.
§ For the global auto makers, Asia Pacific represents the greatest opportunity for growth, and within Asia Pacific the greatest growth opportunity is in China. China’s automotive market has been experiencing explosive growth, surpassing the US in 2009 as the world’s largest market
§ However, China believes that its position as the leading automotive market creates an opportunity to drive the standards and architecture of future automotive technology. As a result, China has launched an ambitious program to electrify transportation, with significant implications for the auto and steel industries.
§ China’s 12th 5-year plan identified 7 strategic emerging industries including energy efficiency & environmental protection, new generation information technology, bio-technology, high-end equipment manufacturing, alternative energy, new materials, electric vehicle
§ The steel industry must help shape the new green transportation “ecosystem” by proactively partnering with leading Chinese institutions to introduce light-weight environmentally friendly materials
2

1. A Changing World
2. China’s Dominance Of The 21st Century Global Auto Industry
3. China’s Challenge: Driving a Green Car Revolution
4. The Challenge of Reinventing Mobility
5. Towards a New Ecosystem for Green Mobility
3

The China Context - speed and intensity (1/2)
4
Shanghai
Now 20 Years Ago

Beijing
20 Years Ago
Now
5
The China Context - speed and intensity (2/2)

WorldSteelAsssociation Presentation LCA&Steel 20120719 FINAL.ppt
Booz & Company
The world economic center of gravity is rapidly shifting back towards the East, and especially towards China
6
China’s Share of Global GDP 1500-2050F, by PPP (constant 2005 international $)
0%5%10%15%20%25%30%35%40%45%50%55%60%65%70%75%80%85%90%95%100%
All other countries: 34%
India: 12% Japan: 3%
Latin America: 7%
Western Europe: 7%
China: 28%
US: 10%
2050F 2030F 2010 2000 1950 1900 1850 1800 1750 1700 1650 1600 1550 1500
Source: EIU, Nexis, World Bank, CEPII, Literature research,; Booz & Company analysis
China’s Fall and Rise
§ China enjoyed cultural and political supremacy for two millennia in the pre-modern world (600-1750) – Advanced water management techniques – Meritocratic imperial bureaucracy – Confucian code of virtuous conduct – Unchallenged military prowess
§ Following the “ Great Divergence”, China
experienced almost 200 years of upheaval and chaos (1800-1970s) – Chinese explanation: aggression, opium – Western explanation: Industrial Revolution – Other factors: Malthusian crisis, Manchu hubris,
shortage of raw materials (e.g., wood), etc.
§ China has re-emerged during the past thirty years (since 1980s) – Selective regulatory liberalization (bidirectional) – Progressive FDI levels and integration of
China-based activities into MNCs’ global value chains

WorldSteelAsssociation Presentation LCA&Steel 20120719 FINAL.ppt
Booz & Company
Economically, China is already - or will soon become - the world’s largest market for many consumer and industrial products
7
= Area Reflects Size Of 2009 Actual PV Sales
= Area Reflects Size Of 2020 Forecasted PV Sales
NAFTA Growth thru 2020: 5,528K CAGR (2010-2020):4%
Latin America Growth thru 2020: 2,899K CAGR (2010-2020): 6%
Asia Pacific Growth thru 2020: 12,626K CAGR (2010-2020): 5%
Africa/Middle East Growth thru 2020:1,264K CAGR (2010-2020):4%
Eastern Europe Growth thru 2020: 2,835K CAGR (2010-2020): 6%
Western Europe Growth thru 2020: 1,527K CAGR (2010-2020):1%
Source: Global Insight Data, Booz & Company analysis
China’s Share of the Automotive Market
Mobile Phones Beer Dairy Products Crude Steel Paper
§ 833M Users (2010) § Global #1
§ 42B liters (2010 Production)
§ Global #1
§ 37.3M tonnes (2009 Production)
§ Global #3
§ 572M tonnes (2009 Production)
§ Global #1 (46.7% of total production)
§ 89.7M tonnes (2009 Production)
§ Global #1

WorldSteelAsssociation Presentation LCA&Steel 20120719 FINAL.ppt
Booz & Company 8
Asian countries, in particular China, now take the largest chunk of global steel consumption
Global Crude Steel Production 2007-2011 By M Ton
5%7%
5%
18%Turkey
2% Italy
2% Braizil
US 6%
China 46% 2% Russia 5%
Germany 3%
S. Korea
Japan India
Others
Global Steel Consumption By Country (2011)
64%
2009
1,217
17%
7% 10%
16%
55%
11%
65%
2007
1,342
20%
+3%
Others
North America
Europe
Asia
2011
1,490
16%
8%
12%
Source: World Steel Association, Booz & Company analysis
13%
5%
Machinery
Transport Vehicles
Appliance 3%
Fabrication 4% Oil & Gas
22%
1%
Shipbuilding
4% Others
Construction 48%
Global Steel Consumption By Sector (2011)

1. A Changing World
2. China’s Dominance Of The 21st Century Global Auto Industry
3. China’s Challenge: Driving a Green Car Revolution
4. The Challenge of Reinventing Mobility
5. Towards a New Ecosystem for Green Mobility
9

Developing Countries: 77%
Mature Markets:
23%
(1)
Korea2%
Japan2%
Other Develope
d Countries
China32%
India19%
Russia5%
Indonisia3%
Mexico2%
Brazil2%
Other Developing Countries
11%
US12%
Thailand2%
China contributed 32% of the global light vehicle sales increase from 2007 to date
Country share of incremental Global Light Vehicles Sales 1) 2007 - 2012
1) Includes A, B, C, D, E, F, MPV,SUV,light passenger car, and light truck source: Global Insight 2010, Booz & Company analysis
10

Car
s pe
r 1,0
00 P
eopl
e
GDP Per Capita (Logarithmic Scale)
0
100
200
300
400
500
600
1,000 10,000 100,000
China is still just entering the accelerated growth phase typical of emerging markets
Turkey
India
China
Indonesia
Iran
Thailand
Mexico
Brazil
Argentina
Malaysia
Russia
Poland
Australia
Canada
Germany
U.K.
U.S.
Note: Each line of symbols represents a 19-year progression for one country, from 1990 through 2008, GDP Per Capita is in Purchasing Power Parity (PPP) Source: Booz & Company analysis
The S-curve
China
Discussion
§ A country’s threshold of mobility lies near US$10,000 GDP per capita (PPP), where automobile ownership accelerates
§ China is at the early taking-off stage of the S-curve
§ India remains fairly distant from the mobility inflection point, but continues to make steady progress
India
11

…and China’s continued economic development will stimulate auto industry growth for the foreseeable future
Note: Passenger vehicles contain sedans, MPVs and SUVs Source: Global Insight 2010, OPEC, DGS Report, Booz & Company analysis
0
100
200
300
400
500
600
2009 2014 2019 2024 2029
Base Forecast High Forecast
Low Forecast
Pas
seng
er V
ehic
le P
AR
C (m
illio
n un
its)
China Passenger Vehicle Installed Base (PARC) Forecast (2009-2030)
480
410
330
Increase in Car Ownership
Government’s Support to Auto Industry
China Economy’s Resilience
Infrastructure Development
§ Car ownership in China is powered by the growing economy – the upside is substantial
§ Government has been continuously guiding and supporting the industry’s development across manufacturing and distribution
§ China’s financial system is less exposed and GDP growth is still very fixed investment driven, thus is less vulnerable to recent financial turbulence impact
§ Highway network development provides foundation for more motor vehicle-based based transportation
§ China is investing in infrastructure to support alternative propulsion
Key Drivers
12
1. A Changing World
2. China’s Dominance Of The 21st Century Global Auto Industry
3. China’s Challenge: Driving a Green Car Revolution
4. The Challenge of Reinventing Mobility
5. Towards a New Ecosystem for Green Mobility
13

14
China’s Urban Population 1980-2020
0
300
600
900
1,200
1,500
Mil. People
Urban
Rural
2020E
58%
2015E
52%
2009
47%
2000
36%
1990
26%
1980
19%
The world has entered a new era since 2008, more than half of the population lives in urban areas
Forecast
Source: National Bureau of Statistics, UN, Booz & Company
§ At start of reform era, more than 80% of China’s population was in rural areas
§ Majority of China’s population will reside in urban areas by 2015
§ Creation of urban middle class fuels demand for personal mobility
Global Urban Population 2000-2050
0
2,000
4,000
6,000
8,000
10,000
70.0% Urban
49.5% 50.7% 46.7%
Rural
2007 2000
Mil. People
2050E 2008
Forecast
§ More than half of the global population live in urban area since 2008

With increasing pressure from air pollution, oil consumption and congestion, China is compelled to reinvent propulsion technologies
Source: Synergistics; Booz & Company analysis
China to Reinvent Propulsion Technologies
For alternative propulsion technologies such as clean diesel, hybrid and electric vehicles, China does not lead the technological development
Air Pollution § Beijing, Xi’an, Shenyang, Shanghai and Guangzhou have been
listed among the Top 10 cities with the worst air pollution. The massive growth of the automotive market only adds to the problem
§ The rapid growth of the automotive market worsens the problem. For example, Beijing’s automobile industry contributed 73% of the overall pollution problem in 2003
Energy Consumption § China imports two-thirds of its oil, and its ever-increasing thirst has
had a dramatic impact on global energy prices § The gasoline and diesel consumption has accounted for half of the
total consumption of petroleum products
Traffic Congestion § In the light of the current rate of development and gas consumption
level, China will have over 150 million vehicles and petroleum consumption will exceed 250 million tons in 2020
15

As the leading automotive market, China has the opportunity to drive the standards and architecture for the global auto industry
Shanghai: A Lean, Green Detroit
“… In acquiring a stake in BYD, Buffett broke a couple of his own rules. "I don't know a thing about cellphones or batteries," he admits. "And I don't know how cars work." But, he adds, "Charlie Munger and Dave Sokol are smart guys, and they do understand it. And there's no question that what's been accomplished since 1995 at BYD is extraordinary…”
Source: Literature research
16

17
Three key shifts are driving a green revolution and ushering a new era of collaborative partnership
Emerging Market Growth Forces Global Redistribution
of Assets
Revolutionary Changes Require a New “Eco-system” of Collaborative Partnerships
An Increasingly Urbanized World Challenges the
Established Transportation Paradigm
Environmental and Economic Sustainability Drive Green
Car Innovations

“12-5” Strategic Plan
Boosting Domestic Consumption
Industry Upgrade and Innovation
Energy Saving and Environmental
Protection
GDP Growth Rate Adjustment
Internationalization
Regional Coordinated Development
Six Major Themes of “12-5” Strategic Plan
Six major themes marked China‘s “12-5” strategic plan
1
2
3
4
5
6
18

In the “12-5” period, China has committed to developing seven emerging industries including new materials and electric vehicle
Leading Industries
Seven Emerging Industries
Producer Services Industry
Note: 7 strategic emerging industries include energy efficiency & environmental protection, new generation information technology, bio-technology, high-end equipment manufacturing, alternative energy, new materials, electric vehicle Source: China 12-5 plan; Literature research; Booz & Company analysis
12-5 Plan Strategy Highlight
§ Continue to increase value added § Eliminate outdated capacity § Develop advanced equipment
manufacturing industry
§ Increase government support to develop the 7 emerging industries* of strategic significance
§ GDP contribution of the 7 industries should increase to 8% by 2015 from the current 2%
§ Cultivate the culture industry to be a leading industry
§ Implication: the share of value added of GDP by the culture industry needs to double from the current 2.5% to 5%
Drivers for the Trend
§ China’s leading industries, such as steel industry and petrochemical industry, consume a larger amount of energy per unit of GDP, whose growth will not be sustainable with the limited reserve of energy
Energy Consumption
Increasing Labor Cost
§ With China’s labor cost rising, Chinese industries have been losing edge in international competition
§ It is necessary for China to transform its industry structure to make it more technology and innovation-driven
Lack of Natural Resources
§ China has very limited reserve of natural resources such as ore, oil, etc, which motivates the Chinese government to cultivate industries that are less natural resource consuming
19
3 Industry Upgrade and Innovation

High energy-consuming industries will be the prioritized targets in China’s national energy saving plan
Energy Consumption by Industry 2007;%
Source: National Bureau of Statistics of China; Booz & Company analysis
11%
9%
100%
8% Transportation
Household consumption
Others
Industrials
21%
6%
7%
10% 11%
3%
14%
4%
25%
2%
§ Characteristics of energy consumption in China – Industrials consume over 70% of energy – Within the industrials sector, consumption of nine
major industries accounts for ~80% § These nine industries are the prioritized targets of the
energy saving plan as they consume collectively over 50% of energy in China
4 Energy Saving and Environmental Protection
71%
Others Oil and Gas Extraction
Coal Mining
Raw Chemical Material and Chemical Products
Electric Power, Thermal Power Production and Supply
Textile
Smelting and Pressing of Non-Ferrous Metal
Smelting and Pressing of Ferrous Metal Petroleum Processing and Coking
Non-metal Mineral Products
20

NEVs in 12th five-year plan and Energy Saving and New Energy Auto Industry Plan
Highlights § Number of BEV & HPV1) on the road: 0.5Mn by
2015 and 2-5Mn by 2020. § Industrialization of BEV and HPV will be the industry
prioritization
Guidelines § R&D: continue the country’s 3-by-3 R&D framework
and increase its pace in EV commercialization § Infrastructure: increase the network of EV charging
stations § Technical standards: set Chinas own EV standards
as well as participating in setting international standards
§ Expand the use of EV in the public transport sector
§ Increase technical collaborations between EV stakeholders
§ Develop technical and R&D talents
Alternative-energy vehicles development plan (2011-20)
Highlights § Financials: Chinese central government to provide
100Bn RMB for the next 10 years in developing alternative-energy electric vehicles
§ Number of electric vehicles on the road: 5~10Mn by 2020. Equivalent to 20% of all private passenger vehicles
§ Production capacity of BEV: 1Mn a year by 2020
Program coverage § R&D and technical developments § Development of core EV components § Commercialization, demonstration and roll-out pilot
programs § Establish network of charging stations in public
places (such as car parks)
China government has established their medium-term targets for NEVs, and planned around 5~10Mn PARC by 2020
21
1) BEV: pure battery electric vehicles, HPV: plug-in hybrid power vehicles Source: Literature research, Booz & Company analysis

1. A Changing World
2. China’s Dominance Of The 21st Century Global Auto Industry
3. China’s Challenge: Driving a Green Car Revolution
4. The Challenge of Reinventing Mobility
5. Towards a New Ecosystem for Green Mobility
22

The road to the new automotive world order will be challenging and will require significant transitions from today’s status quo
Key Challenges
Capabilities
Suppliers
Change Management
§ How can OEMs build up the new structures and capabilities required to develop alternative powertrain vehicles?
§ Who should the OEMs partner with in order to build and improve these capabilities?
§ What changes are in store for the current manufacturing structure and how can they be managed most effectively? Engineering? Sales & Marketing?
§ Where and how do OEMs find the suppliers for new technologies? How will these relationships be different from relationships with current suppliers?
§ How can the supply chain be aligned to meet the needs of the new supplier landscape?
§ How will infrastructure supply (e.g. electric charging stations) be built up?
23

Among different technology trends, sustainable mobility and mass reduction have been a key focus globally and in China
Biofuel ICE
Conventional Hybrid
Plug-in Hybrid
Electric Vehicle
Hydrogen Fuel Cell Vehicles
CNG ICE
Gasoline/ Diesel ICE
Mercedes E-Class
Chevy Tahoe E-85
Toyota Prius
Chevrolet Volt
i-MiEV
Honda FCX Clarity
Mass Reduction via Light-Weight Materials
Sustainable Mobility: the
Reinvention of Automotive Propulsion
“Glocalization”: Global Products Adapted to Local
Requirements
Enhanced Safety & Comfort
Telematics and Infotainment
Different Technology Trends 1
2
2
3
3
3
4
xEVs - Covered in detail
Mercedes E-Class Blue-Tec
ü
ü
24

Steel accounts for more than 50% of the weight of an average passenger car
Others
11% 56%
Aluminium 6%
Steel
4%
Glass
12% Iron
3%
Plastics
8% Rubber
Major Steel Applications in a Car Materials in a Passenger Car (By % of total weight)
Source: SMMT, Corus, Booz & Company analysis
25

Technology for Improved Fuel Economy and Reduced CO2 Emissions
4%
Stop Start 4%
Electric Power Hydraulic Steering 4%
Reduced Mechanical Friction
Low Rolling Resistance Tires 3%
Electric Steering 5%
Variable Valve Actuation 6%
Dual Clutch Transmission 7%
Stop Start with Regenerative Braking 7%
Light Weighting 10%
Direct Injection/Lean Burn 12%
Engine Downsizing (with Turbo or Supercharger) 13%
Aerodynamics 2%
Fuel Efficiency Gain* (%)
Incremental Cost Per Car (€)
300
400
500
550
1,400
300
100
50
50
200
100
N/A
* Fuel efficiency gains are calculated as the individual technology impact to fuel efficiency immediately after it is applied to a base engine using state-of-the-art technology Source: King Review, Deutsche Bank, NHTSA, Booz & Company analysis
Several technologies will achieve incremental impact on fuel efficiency
ü
26

1. A Changing World
2. China’s Dominance Of The 21st Century Global Auto Industry
3. China’s Challenge: Driving a Green Car Revolution
4. The Challenge of Reinventing Mobility
5. Towards a New Ecosystem for Green Mobility
27

For automakers, “green mobility” optimization problems lie in the balance of the cost, weight and function
Material Selection
Optimization Triangle
Weight Function
Cost Customer
Requirements
Regulatory Requirements
OEM/Supplier Requirements
New features/functions
Safety
Fuel efficiency
Price
Performance/durability
Safety
Emissions control
Noise control
Re-cycling
Manufacturing criteria(1)
Investment
Competitive performance
Manufacturing costs
Key Drivers
28
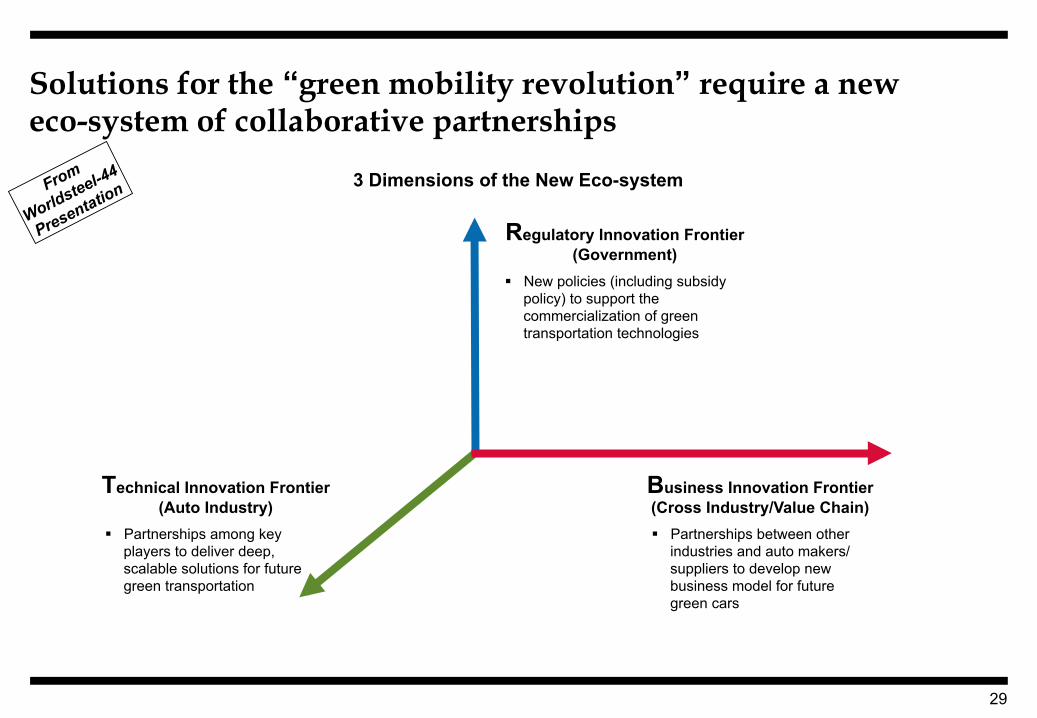
Solutions for the “green mobility revolution” require a new eco-system of collaborative partnerships
Regulatory Innovation Frontier (Government)
Business Innovation Frontier (Cross Industry/Value Chain)
Technical Innovation Frontier (Auto Industry)
3 Dimensions of the New Eco-system
§ Partnerships between other industries and auto makers/suppliers to develop new business model for future green cars
§ New policies (including subsidy policy) to support the commercialization of green transportation technologies
§ Partnerships among key players to deliver deep, scalable solutions for future green transportation
29

EV requires new lighter and stronger materials to replace relatively heavy steel body of conventional vehicles
Light Vehicles by powertrain technology1)
In mn vehicles, CAGR in %
2025
102,5
84%
12% 3,9
2020
92,9
88%
10% 2,6
2015
84,2
95%
4% 0,6
2010
64,1
99%
1% 0,0
2008
66,2
99%
1% 0,0
Crisis impact ICE Hybrids EV
1) Light vehicle means “Manufacturing of passenger cars & light commercial vehicles (< 6T), as well as parts Wholesale & repair not included”. Rounding effects may occur Source: Booz & Company analysis
Structure Optimization
Lightweight Materials
Connection & Joining
Technologies
Vehicle Lightweight Technology Alternatives
Lightweight or multi material design and application can help to achieve weight reduction
Downsizing of all possible vehicle equipment in order to save weight
X-by-wire systems without mechanical backup to optimize package and weight
Realization of smaller flexible vehicle concepts with comfort and safety of large cars
Provide enhanced modularity for the total body structure
Support new flexible body concepts to adapt vehicles to market and society requirements
Efficient multi-material joining technologies to adopt the usage of different materials for structural vehicle applications in one vehicle
Lightweight in EV and Hybrid EV applications is
expected to increase quickly
CAGR 2010-2025
48% 19% 2% EV HEV ICE
T
30

Overview Lightweight Materials in Structural Applications
Light Weight Material Product Characteristics Current Application Areas
Future Application Areas
High Strength Steel
§ High Toughness, high yield strength § High stiffness, critical for automotive uses § Achieves a fatigue limit, good for long-term design
without ongoing inspections
§ Body structure § Frontend beam § Already increased
penetration
§ Vehicle chassis § Structural components/
crash components § Seats, interior components
Aluminum § Carbon fiber woven tows in a resin matrix § Highest stiffness, yield strength, lowest mass § Crash characteristics tend to destroy chassis
components, making it very difficult to repair outside OEM factory..
§ Space Frame § Stringer § Gearbox crossbeam
§ Pure chassis elements § Interior decorative
components
Magnesium § Very low weight, but low relative stiffness and yield strength
§ Potential flamabiltiy issues and creep in high temperature applications, 630 ° C flashpoint is low relative to steel
§ Engine block, mounts § Valve covers § Steering column brackets § Seat frames
§ Vehicle chassis § Further engine block usage § Transmission case
Carbon Fiber Reinforced
Polymer (CFRP)
§ Moderate yield strength, lower toughness, but much lower mass
§ Low to moderate stiffness on a mass basis to steel § No fatigue limit, so structures must be over designed
or expensive regular inspection must be performed
§ Vehicle chassis § Aerodynamic surfaces,
sporting equipment § Super premium sports
oriented automobiles
§ Chassis § Interior structural
components
-30-35%
-40%
-15-20%
-50%
-x% Up to x% weight efficiency compared to conventional steel in automotive
Generally we see four major material groups in the field of light weight materials…
Source: Booz Allen Hamilton Technology Center, Booz & Company
T
31

0
2
4
6
8
10
12
14
16
18
2010 2012 2014 2016 2018 2020 2022 2024 2026
€/kg
Excellent performance in weight reduction: – Weight reduce by 50%+ – Oil efficiency raise by 40%+
Excellence energy absorbing capabilities (e.g. application to F1)
CFRP is a promising material for EV in terms of light and strength; however, its manufacturing cost is expected to remain high
CFRP is light and strong Expected Lightweight Material Cost Reduction Range (in €/kg)
Magnesium
High Strength Steel
CFRP
Honeycomb
Aluminum
Carbon Fiber Composite
Fragmented use of carbon fiber due to - Remaining cost ineffectiveness - Limited processability (low volume series high performance cars) - Low side crash/ passenger crash safety performance
Source: Booz Allen Hamilton Technology Center; literature research; Booz & Company
Example Tesla “Roadster”
Promoted in 2008, manufactured by Tesla CFRP adopted in vehicle body and interior
decoration, deducted weight to approx. to 1,000 kg (normally avg. weight for passenger vehicle 1,800~2,000 kg)
Outstanding performance: – <4 seconds from 0 to 60miles/hour – Duration distance: >200 miles (322km)
Very expensive: US$ 109,000
T
32

Prepared for client name WorldSteelAsssociation Presentation LCA&Steel 20120719 FINAL.ppt 33
6,720
5,520
7621,772
249
PV HD CV MD CV LD CV Micro CV
16
14
29
59
36
20
15
84
86
71
64
80
85
41
Supplier Share in Production by Component (%) China Automobile Use Steel Production
16
16
55
96
50
37
23
84
84
45
50
63
77
4
Chassis
Powertrain
Engine & auxiliary systems
Body structure
Body (exterior)
Interior
Electrical systems/
electronics
2002 2015
6,720
613 1901,181
311
PV HD CV MD CV LD CV Micro CV
China Vehicle Sales, 2010 1H – ‘000 units –
Estimated Steel Consumption, 2010 1H – ‘000 Tons –
Automotive Production Outlook
Source: CAAM 2010 1H report, www.mysteel.com
2010 full year forecast for auto industry 36 Million tons
Suppliers have become major automotive steel consumers as their share in production continues to increase
B
Steelmakers can seize partnership opportunities as automakers increasingly depend on suppliers to deliver advanced vehicle technologies
OEMs Suppliers

34
Partnerships in product development breed strong relationship with OEMs, which in turn ensure steelmakers’ market and profit share in the future auto market
§ Baoshan partners with Chinese OEMs such as Geely, Chery, Dongfeng, and Chongqing Chang’An in a 500 mn RMB project to develop stronger and lighter materials
Baoshan ventured out of the “supplier role” and partners with OEMs in product development to create win-win situation
Chinese OEMs lacks leading-edge
technologies in fuel efficiency
Baoshan collaborates with OEMs in product
development…
Both Baoshan and Chinese OEM’s
competitive positioning will be strengthened
§ Pollution reduction and fuel efficiency are top national priorities
§ The most significant internal capability gap between Chinese and global OEMs is in advanced propulsion technology
§ Baoshan secured its market share against global leaders
§ Chinese OEMs get the technology to possibly reduce vehicle weight by 10% and fuel consumption of 6-8%
B
Source: Bloomberg BusinessWeek “Baoshan Steel, Geely Seek to Cut Chinese Auto Weight” September 16, 2010, Booz & Company analysis

Partnerships with Chinese OEMs to create a win-win situation, and increase steelmaker’s market share and profitability
§ POSCO to help Great Wall implement high-strength steel, new hot pressing and hydraulic forming technologies.
§ POSCO will also provide technical support for vehicles under development at Great Wall
POSCO has formed a technical partnership with Great Wall to deliver advanced material processing technology
Chinese OEMs seek partnerships to build
core vehicle development capabilities
POSCO forms technical partnership with Great Wall Motor
Both POSCO and Great Wall strengthen
competitive positioning
§ Body and Materials engineering are core capabilities for OEMs to deliver uniquely designed products that meet regulatory standards § Chinese OEMs seek to establish body engineering organizations to compete with global leading technologies
§ POSCO engages Great Wall as a development partner and creates a new business opportunity in China
§ Great Wall accelerates its development capability in a critical area and accelerates its emergence as a global auto company
B
+
Source: Automotive News “Great Wall taps Korea's POSCO for high-strength steel, technical support” February 28, 2012, Synergistics Limited analysis
35

36
The central government is playing a key role in shaping industry development
Battery Manufacturers
Vehicle Manufactures
Utilities Companies
Official China at Work
SASAC
Note: SASAC: State-owned Assets Supervision and Administration Commission of the State Council Source: Booz & Company analysis
Electric Vehicles Market
R

It is important to carefully map-out of the key stakeholders and understand their specific roles/priorities
The State Council Premier: Wen Jiabao
National Development and
Reform Commission
(NDRC)
Ministry of Industry and Information Technology of
People’s Republic of China
(MIIT)
China Automotive Technology &
Research Center (CATARC)
Ministry of Commerce of
People’s Republic of China
(MOFCOM)
Other Associations
§ Responsible for controlling and coordinating economic and social development plan
§ Responsible for administering China’s foreign trade, economic cooperation and foreign investment
§ Responsible for designing regulations and policies for industry sector
§ Responsible for managing auto industry from a technical supporting perspective
§ Responsible for conducting regulation and policy of industry, and developing new technology
Source: Literature research; Expert Interviews; Booz & Company analysis
State-owned Assets Supervision and Administration
Commission (SASAC)
§ Very select individuals (5-7) that need to be targeted for auto/heavy industrials in most govt. associations (automotive department) § For CATARC, multiple stakeholders are present for different technical standards
§ Proactively developing relationships with key individuals are vital to business in China
37
R

In the published “Guidelines to New Material Industries during Twelfth-five Year Plan”, steel is not named as an option for NEV
Source: Expert interviews; Literature research; Synergistics Limited analysis
New Material Industry and China’s Twelfth-five Year Plan § Led by the state council, China has issued the 12th five year plan and guidelines to pillar industries through MIIT, NDRC,
Ministry of Finance, Ministry of Technology and other administrative bodies § New Materials was considered one of the seven emerging industries that has strategic importance to China’s
development
38
R
The scope of New Materials covers premium steel with “high strength, tenacity, heat and corrosion resistance”, together with five other strategic new materials
However, in section on the need for new materials for new strategic industries, only Aluminum and Magnesium Alloy were named as preferred materials…Steel was not named as a preferred material for energy saving and alternative energy vehicles
Steelmakers must proactively lobby for the inclusion of steel in energy saving and new energy vehicle applications

Conclusions:
39
• Trade issues • Geopolitical issues
• Global energy market is violate and unstable
• China’s energy resources are limited
Key Implications § Green innovation in auto industry will
dramatically change the steel makers’ way to play in the auto sector
§ The global steel makers must collectively
seek a means to influence policies related to new material applications via leading industry and academic institutions
§ Steelmakers must build solid partnerships
and find opportunities to get involve in the new green car eco-system ‒ Technical frontier: partner among steel
makers ‒ Business frontier: partner across value
chain among OEMs, auto suppliers ‒ Regulator frontier: cooperate with green car
policy makers
Steelmakers must be proactively involved in the development of the new eco-system for green mobility in China
Executive Summary:
! A structural shift of economic power from West to the East is taking place, with stunning economic growth most evident in China and India over the past 20 years. This growth momentum will continue, making the Asian economies the most important in the world for the steel industry.
! The world has entered a new era since 2008, with over half of the world population now living in cities, and this increasingly urbanized world challenges the established set of paradigms for personal and commercial transportation, especially in the densely populated urban centers in China.
! For the global auto makers, Asia Pacific represents the greatest opportunity for growth, and within Asia Pacific the greatest growth opportunity is in China. China’s automotive market has been experiencing explosive growth, surpassing the US in 2009 as the world’s largest market
! However, China believes that its position as the leading automotive market creates an opportunity to drive the standards and architecture of future automotive technology. As a result, China has launched an ambitious program to electrify transportation, with significant implications for the auto and steel industries.
! China’s 12th 5-year plan identified 7 strategic emerging industries include energy efficiency & environmental protection, new generation information technology, bio-technology, high-end equipment manufacturing, alternative energy, new materials, electric vehicle
! WorldAutoSteel would like to help shape the new green transportation “ecosystem” by proactively partnering with leading Chinese institutions to introduce light-weight environmentally friendly materials
1