Embed Size (px)
Citation preview

Copyright © Michigan Tech
Class Period 01 Page: 1
Advanced Propulsion Systems for Electric Vehicles Laboratory
MEEM / EE 5296Assignment - 02
Product Life Cycle: HEV vs Conventional Vehicle
(Manufacturing, Utilization, Recycling etc.)
H R R Vedanth Iyengar
Graduate Student, Mechanical Engineering

Copyright © Michigan Tech
Class Period 01 Page: 2Motive
Vehicles- one of the most important personal assets and liabilities costing almost $100 000 over the “lifetime” responsible for 42 000 highway deaths and 4 million injuries each year consumes two-third of the total petroleum production illness and premature death due to the emissions. environmental hazard. According to EPA-
• Transportation: 32%• Electricity: 38%
Greener Processes > Greener ProductsCurrent regulations focus only on Tailpipe emissions – Utilization
Visible Easy to measure Becomes a habitConcentrating only on utilization
Total CO2 emissions

Copyright © Michigan Tech
Class Period 01 Page: 3Life Cycle Assessment (LCA)
• Cradle to grave analyses tool for a product/process Compiles an inventory of input/outputs Evaluates the potential environmental impacts
LCA is important to Vehicle Regulations/Policy makers & industry tailpipe emissions are only a part of the story! to know how green a vehicle is? utilization of energy and associated emissions = Carbon Footprint Big-Picture approach – improving one aspect/technology may give rise to
emissions elsewhere
• CARB considered only tailpipe emissions back in 1998 and so had to bump the regulation requirement of ZEV sales from 2% to 10% by 2003.
of a product or service system throughout its life-cycle

Copyright © Michigan Tech
Class Period 01 Page: 4
L C A
Image taken from: worldautosteel.org

Copyright © Michigan Tech
Class Period 01 Page: 5EPA LCA Chart
Figure taken from: Paula Moon, Andrew Burnham and Michael Wang, “Vehicle-Cycle Energy and Emission Effects of Conventional and Advanced Vehicles”, SAE TECHNICAL PAPER SERIES 2006-01-0375

Copyright © Michigan Tech
Class Period 01 Page: 6A General Idea-Talking points
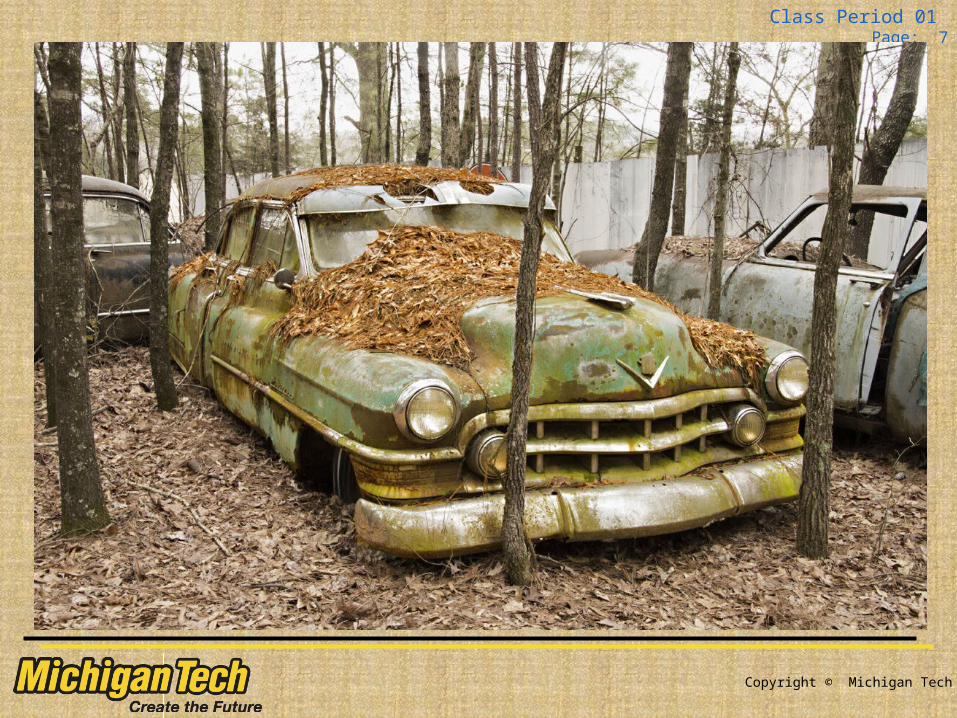
End of Use Product : Landfill
Figure taken from: Vishesh Kumar and John W. Sutherland, “Sustainability of the automotive recycling infrastructure: review of cureent research and identification of future challenges, Int. J. Sustainable Manufacturing. Vol 1, Nos. ½, 2008
Copyright © Michigan Tech
Class Period 01 Page: 7

Copyright © Michigan Tech
Class Period 01 Page: 8Recycling
• Total annual revenue is estimated to be $22 billion
• Saves an estimated 85 million barrels of oil a year, that would have been used in the manufacturing of new or replacement parts
• Automotive recycling businesses employ some 103,108 people at more than 8,267 businesses around the country
• Cars are the number one recycled product in the United States with a whopping 12-15 million vehicles/annum
• Vehicle Recovery Rates in the US are around 95%. But due to the E-mobility drive, this figure is dropping down.
• These vehicles use more plastics and composite materials than conventional vehicles, which use primarily steel
• Rechargeable batteries are handled separately
Data compiled from a 1997 survey by the private consulting firm, Axiom Research Company and Automotive Recycling: Your Cars Afterlife (2-13-2006).

Copyright © Michigan Tech
Class Period 01 Page: 9Material Recovery Route
Impact on the business:
• Shredders & Dismantlers will recover less material and pay more for landfill
• More landfill more degradation of the natural environment
• Therefore, the recovery and recycling of plastics and composites is one of the
major issues of interest.
• We need a recycling infrastructure and technological advancement for
HEV/EV recycling!
Figure taken from: L. Harrison and D. Doerffel, “Life Cycle Impacts and Sustainability Considerations for Alternative and Conventional Vehicles”, SAE TECHNICAL PAPER SERIES 2003-01-0642

Copyright © Michigan Tech
Class Period 01 Page: 10Utilization Costs
Figure taken from: L. Harrison and D. Doerffel, “Life Cycle Impacts and Sustainability Considerations for Alternative and Conventional Vehicles”, SAE TECHNICAL PAPER SERIES 2003-01-0642
Costs in Euros

Copyright © Michigan Tech
Class Period 01 Page: 11Utilization Metrics
Per annum vehicular measures
Figure taken from: L. Harrison and D. Doerffel, “Life Cycle Impacts and Sustainability Considerations for Alternative and Conventional Vehicles”, SAE TECHNICAL PAPER SERIES 2003-01-0642
Total Life Span of Maintenance Impacts

Copyright © Michigan Tech
Class Period 01 Page: 12Fuel Production for HEV/EVs
Figure taken from: Mikhail Granovskii, Ibrahim Dincer , Marc A. Rosen, “∗ Economic and environmental comparison of conventional, hybrid, electric and hydrogen fuel cell vehicles”, Journal of Power Sources 159 (2006) 1186–1193
Scenario 1: Renewable sourcesScenario 2: 50% renewable sources + 50% natural gas Scenario 3: Natural gas

Copyright © Michigan Tech
Class Period 01 Page: 13Big Picture: Fuel Cycle + Vehicle Cycle +Operation
Total energy-cycle energy use (kJ/km)
Total energy-cycle Greenhouse gas emissions (g/km)
Figure taken from: Paula Moon, Andrew Burnham and Michael Wang, “Vehicle-Cycle Energy and Emission Effects of Conventional and Advanced Vehicles”, SAE TECHNICAL PAPER SERIES 2006-01-0375

Copyright © Michigan Tech
Class Period 01 Page: 14
Total energy-cycle PM emissions (g/km)
Total energy-cycle SOx emissions (g/km)
Figure taken from: Paula Moon, Andrew Burnham and Michael Wang, “Vehicle-Cycle Energy and Emission Effects of Conventional and Advanced Vehicles”, SAE TECHNICAL PAPER SERIES 2006-01-0375

Copyright © Michigan Tech
Class Period 01 Page: 15Pugh Analysis
Figure taken from: Heather L. MacLean, Lester B. Lave “Evaluating automobile fuel/propulsion system technologies”, Progress in Energy and Combustion Science 29 (2003) 1–69
Copyright © Michigan Tech
Class Period 01 Page: 16
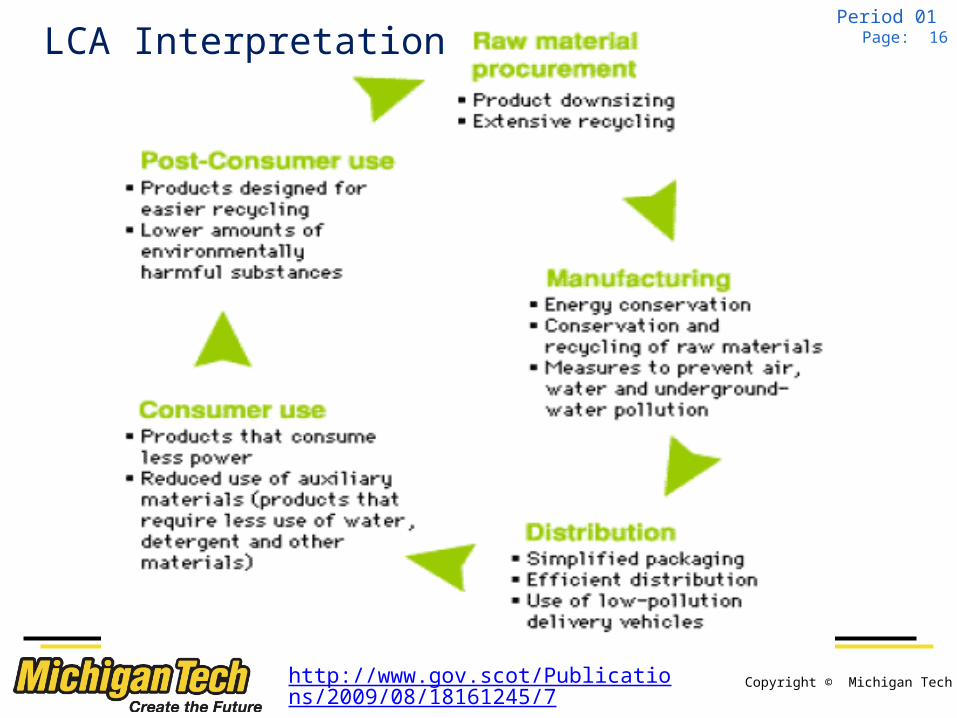
http://www.gov.scot/Publications/2009/08/18161245/7
LCA Interpretation

Copyright © Michigan Tech
Class Period 01 Page: 17Conclusions
• Immediate need for a viable/thriving infrastructure > mass adoption and acceptance of e-mobility
• We often restrict our discussions to the charging infrastructure, battery technology, vehicle/battery cost
• Ecosystem perspective recommends a broader discussion on the same with inclusion of recycling, manufacturing and LCA for the HEV/EVs

Copyright © Michigan Tech
Class Period 01 Page: 18Final Verdict
• In particular, gasoline or diesel in an internal combustion engine (ICE) is currently the cheapest system and is likely to continue to be the cheapest system through 2020.
• Conventional Propulsion – good for well-to-tank <an age-old technology>
• HEV/EV/H2 – good for tank-to-wheel <Efficient Powertrain>
• Absent a breakthrough in Battery technology, no significant eMobility i.e. HEVS are good but EVs will continue to be expensive and unattractive range
Copyright © Michigan Tech
Class Period 01 Page: 19Bibliography
• Figure taken from: Paula Moon, Andrew Burnham and Michael Wang, “Vehicle-Cycle Energy and Emission Effects of Conventional and Advanced Vehicles”, SAE TECHNICAL PAPER SERIES 2006-01-0375
• http://www.gov.scot/Publications/2009/08/18161245/7
• Figure taken from: Heather L. MacLean, Lester B. Lave “Evaluating automobile fuel/propulsion system technologies”, Progress in Energy and Combustion Science 29 (2003) 1–69
• Figure taken from: L. Harrison and D. Doerffel, “Life Cycle Impacts and Sustainability Considerations for Alternative and Conventional Vehicles”, SAE TECHNICAL PAPER SERIES 2003-01-0642
• Figure taken from: Mikhail Granovskii, Ibrahim Dincer , Marc A. Rosen, “∗ Economic and environmental comparison of conventional, hybrid, electric and hydrogen fuel cell vehicles”, Journal of Power Sources 159 (2006) 1186–1193
• Data compiled from a 1997 survey by the private consulting firm, Axiom Research Company and Automotive Recycling: Your Cars Afterlife (2-13-2006).

Copyright © Michigan Tech
Class Period 01 Page: 20
• Figure taken from: Vishesh Kumar and John W. Sutherland, “Sustainability of the automotive recycling infrastructure: review of cureent research and identification of future challenges, Int. J. Sustainable Manufacturing. Vol 1, Nos. ½, 2008
• Heather L. MacLeana, Lester B. Lave, “Evaluating automobile fuel/propulsion system technologies”, Progress in Energy and Combustion Science 29 (2003) 1–69
• Heather L. MacLeana, Lester B. Lave, “An environmental-economic evaluation of hybrid electric vehicles: Toyota Prius vs. its conventional internal combustion engine Corolla”, Transportation Research Part D 7 (2002) 155-162