Embed Size (px)
Citation preview
M a r k e t I n t e l l i g e n c e . C o n s u l t i n g
India Commercial Vehicles Market By Vehi cle Type, By End Use I ndustr y,
Co mpeti t i o n Fo recast an d Oppo r tun i t i es , 2021

© TechSci Research
2
T a b l e o f C o n t e n t s
S. No. Contents
1. Product Overview
2. Research Methodology
3. Analyst View
4. India Commercial Vehicles Market Outlook
4.1. Market Size & Forecast
4.1.1. By Value & Volume
4.2. Market Share & Forecast
4.2.1. By Vehicle Type (Light, Medium, and Heavy Commercial Vehicles)
4.2.2. By Company
4.2.3. By Region
5. India Heavy Commercial Vehicles (HCVs) Market Outlook
5.1. Market Size & Forecast
5.1.1. By Value & Volume
5.2. Market Share & Forecast
5.2.1. By Vehicle Type (Heavy Duty Truck and Heavy Duty Bus)
5.2.2. By End Use Industry
6. India Light Commercial Vehicles (LCVs) Market Outlook
6.1. Market Size & Forecast
6.1.1. By Value & Volume
6.2. Market Share & Forecast

© TechSci Research
3
T a b l e o f C o n t e n t s
S. No. Contents
6.2.1.By Vehicle Type (LCV Passenger, LCV Goods <2T GVW, LCV Goods 2-3.5T GVW, and LCV Goods >3.5T GVW)
6.2.2. By End Use Industry
7. India Medium Commercial Vehicles (MCVs) Market Outlook
7.1. Market Size & Forecast
7.1.1. By Value & Volume
7.2. Market Share & Forecast
7.2.1. By Vehicle Type (Medium Duty Truck and Medium Duty Bus)
7.2.2. By End Use Industry
8. Import-Export Analysis
9. Supply Chain Analysis
10. Market Dynamics
10.1. Drivers
10.2. Challenges
11. Policy & Regulatory Landscape
12. Market Trends & Developments
12.1. Adoption of BS IV Standards
12.2. Increasing Geographical Diversification
12.3. Rising Replacement Led Demand
12.4. Rising Ancillarisation
12.5. Rising Demand for Electric and CNG Buses

© TechSci Research
4
T a b l e o f C o n t e n t s
S. No. Contents
13. India Economic Profile
14. Competitive Landscape
14.1. Tata Motors Limited
14.2. Mahindra & Mahindra Limited
14.3. Ashok Leyland Limited
14.4. SML Isuzu Limited
14.5. Force Motors Limited
14.6. Hindustan Motors Limited
14.7. VE Commercial Vehicles Limited
14.8. Piaggio Vehicles Private Limited
14.9. Daimler India Commercial Vehicles Pvt. Ltd.
14.10. AMW Motors Ltd.
15. Strategic Recommendations
16. About Us & Disclaimer

P r o d u c t O v e r v i e w
5
Commercial Vehicle Segment
Sub-Segment GVW Capacity (Tons)Key Customer
Segment
Light Commercial Vehicle (LCV)
Light Commercial Vehicle -Passenger
<7.5 tons
• Logistics• Construction• Passenger
transportationLight Commercial Vehicle -
Goods
Medium Commercial Vehicles(MCV)
Medium Commercial Vehicle -Truck
7.5 – 16.2 tons
• Construction• Logistics• School and college
transportation• Staff transportation
Medium Commercial Vehicle -Bus
Heavy Commercial Vehicle (HCV)
Heavy Commercial Vehicle -Truck
>16.2 tons
• Logistics• Construction • Mining• Passenger
transportation
Heavy Commercial Vehicle -Bus
Commercial vehicle is a type of motor vehicle used for transporting goods orpassengers. Department of Transportation, USA defines Commercial Vehicle as “Any self-propelled or towed vehicle used on public highways in interstate commerce to transportpassengers or property.”
Product Classification
Product Definition
© TechSci Research

R e s e a r c h M e t h o d o l o g y
6
© TechSci Research
A
C
B
Primary Research
Company Analysis
Desk Research
Identifying Key Opinion
Leaders
Questionnaire Design
In-depth Interviews
Market Participants
Key Strengths
Commercial Vehicle
Portfolio
Recent
Developments
Market
Changing
Aspects/Dynam
ics
Government
Policies
Final
Conclusion
LinkedIn TechSci Internal
database
Factiva Hoovers
Paid Sources
Company Website Company Annual
Reports White Paper Study Financial Reports Investor
Presentations Regulatory Body, Associations, etc.
Secondary Research
Primary Research
Data Collection
Data Filter& Analysis
Research &Intelligence
ActionableInsights
BusinessSolution
•In-depth secondary research was conducted todetermine top players in the India commercialvehicles market, overall market size andsegmental market sizes.
Market Profiling
•In order to conduct industry experts interviews,TechSci Research formulated a detailedquestionnaire.
Formulating Questionnaire
•List of industry players, distributors, andindustry specialists was developed.
Developing List of Respondents
•TechSci Research conducted interviews withindustry experts, industry players, for datacollection and verification.
Data Collection
•Data obtained as a result of primary andsecondary research was validated throughrigorous triangulation.
Data Validation
•The data was scrutinized using MS-Excel andstatistical tools such as Time Series Analysis,average, etc. to obtain qualitative andquantitative insights about the India commercialvehicles market.
Data Analysis
R e s e a r c h M e t h o d o l o g y
7
© TechSci Research
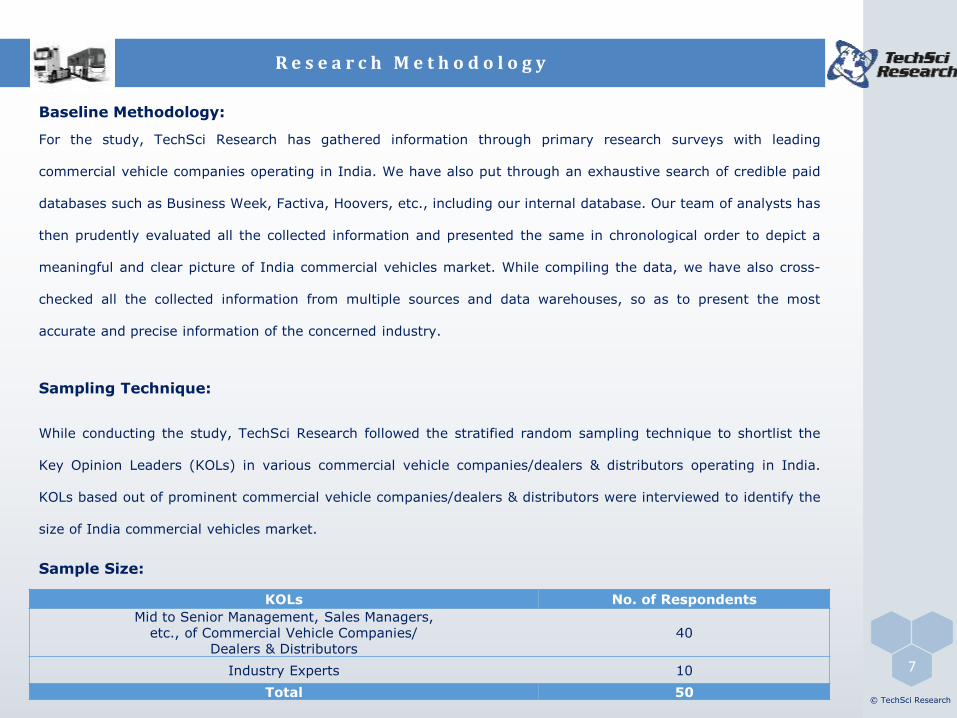
Baseline Methodology:
For the study, TechSci Research has gathered information through primary research surveys with leading
commercial vehicle companies operating in India. We have also put through an exhaustive search of credible paid
databases such as Business Week, Factiva, Hoovers, etc., including our internal database. Our team of analysts has
then prudently evaluated all the collected information and presented the same in chronological order to depict a
meaningful and clear picture of India commercial vehicles market. While compiling the data, we have also cross-
checked all the collected information from multiple sources and data warehouses, so as to present the most
accurate and precise information of the concerned industry.
Sampling Technique:
While conducting the study, TechSci Research followed the stratified random sampling technique to shortlist the
Key Opinion Leaders (KOLs) in various commercial vehicle companies/dealers & distributors operating in India.
KOLs based out of prominent commercial vehicle companies/dealers & distributors were interviewed to identify the
size of India commercial vehicles market.
Sample Size:
KOLs No. of Respondents
Mid to Senior Management, Sales Managers,etc., of Commercial Vehicle Companies/
Dealers & Distributors40
Industry Experts 10
Total 50

R e s e a r c h M e t h o d o l o g y
8
© TechSci Research
Market Size Calculation Technique:
Primary Research
For the preparation of ‘India commercial vehicles market’ report, bottom-up model has been used, which has been
later cross validated by using top-down approach. TechSci Research interviewed Senior Managers and Regional
Sales Managers of the prominent commercial vehicle companies/dealers & distributors using Delphi technique for
calculating the size of India commercial vehicles market. Respondents were also asked about the current and
future growth rates, market share by commercial vehicle types, etc. All the information gathered was carefully
analyzed. Data points which exhibited high deviations from the majority estimates were eliminated as outliers and
the remaining refined data points were put together to arrive at the volume data.
Primary Research – Few of the Companies and/or their Dealers Interviewed
S. No. Names of Companies and/or their Dealers Interviewed
1. Tata Motors Limited
2. Mahindra & Mahindra Limited
3 Ashok Leyland Limited
4. VE Commercial Vehicles Limited
5. Force Motors Limited
6. MAN Truck & Bus

R e s e a r c h M e t h o d o l o g y
9
© TechSci Research
Secondary Research:
We have also put through an exhaustive search of credible paid databases such as Factiva, Hoovers, etc., in
addition to our internal database. Further analyses of credible publications, white papers, company’s annual
reports, investor presentations, news articles, etc., were also analysed to cross validate the end findings derived
from primary research.
Forecasting Technique:
The team has developed forecast on the basis of econometric and judgemental analysis in addition to statistical
techniques such as averaging and geometric mean. During primary research interview, questions regarding
historical sales trend of commercial vehicles market were put forward. Respondents were asked about the current
and future growth rates, market share by commercial vehicles type in India. In order to forecast India commercial
vehicles market, following forecast techniques were used:
• Time Series Analysis• Econometric and Judgmental Analysis• Moving Average
S. No. Few of the Secondary Sources
1. Organisation Internationale des Constructeurs d’Automobiles (OICA)
2. Society of India Automobile Manufacturers
3 Ministry of Commerce
4. World Bank
5. International Monetary Fund (IMF)

R e s e a r c h M e t h o d o l o g y
10
© TechSci Research
Note:
The report has been prepared in the Financial Year (FY) format, which indicates a 12 months period, starting from
1st April of a calendar year and ending on 31st March of the subsequent calendar year. For example, FY2016
indicates a 12 months period that starts from 1st April 2015 and ends on 31st March 2016.
The report includes actual market from FY2012 to FY2016, with estimated numbers for FY2017. Further, the report
provides forecast of market data from FY2018 to FY2022.
I n d u s t r y B r i e f
11
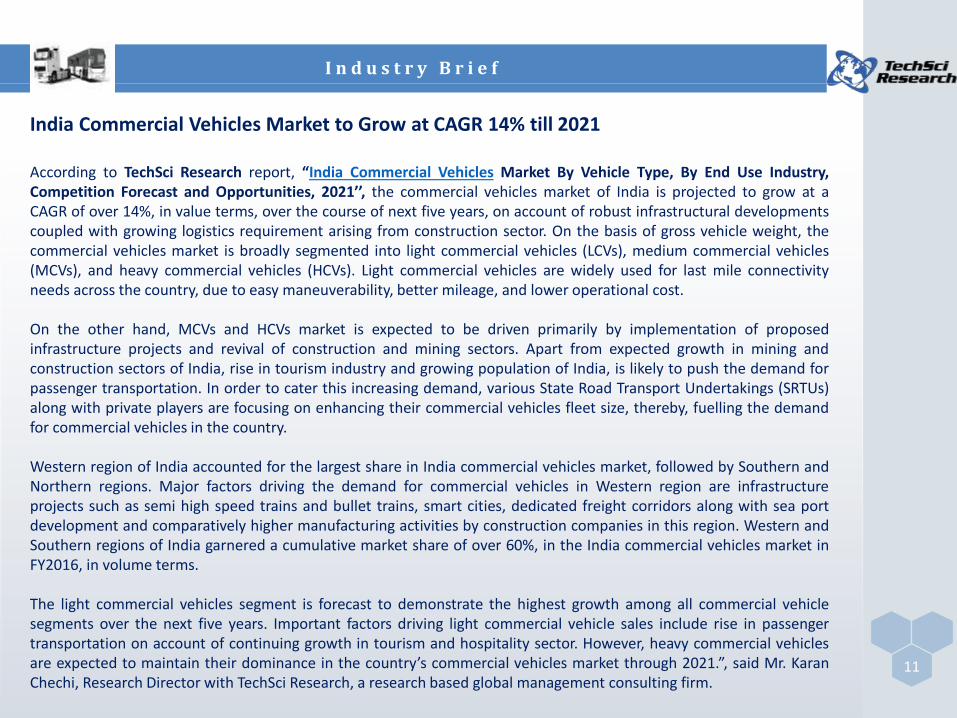
India Commercial Vehicles Market to Grow at CAGR 14% till 2021
According to TechSci Research report, “India Commercial Vehicles Market By Vehicle Type, By End Use Industry,Competition Forecast and Opportunities, 2021’’, the commercial vehicles market of India is projected to grow at aCAGR of over 14%, in value terms, over the course of next five years, on account of robust infrastructural developmentscoupled with growing logistics requirement arising from construction sector. On the basis of gross vehicle weight, thecommercial vehicles market is broadly segmented into light commercial vehicles (LCVs), medium commercial vehicles(MCVs), and heavy commercial vehicles (HCVs). Light commercial vehicles are widely used for last mile connectivityneeds across the country, due to easy maneuverability, better mileage, and lower operational cost.
On the other hand, MCVs and HCVs market is expected to be driven primarily by implementation of proposedinfrastructure projects and revival of construction and mining sectors. Apart from expected growth in mining andconstruction sectors of India, rise in tourism industry and growing population of India, is likely to push the demand forpassenger transportation. In order to cater this increasing demand, various State Road Transport Undertakings (SRTUs)along with private players are focusing on enhancing their commercial vehicles fleet size, thereby, fuelling the demandfor commercial vehicles in the country.
Western region of India accounted for the largest share in India commercial vehicles market, followed by Southern andNorthern regions. Major factors driving the demand for commercial vehicles in Western region are infrastructureprojects such as semi high speed trains and bullet trains, smart cities, dedicated freight corridors along with sea portdevelopment and comparatively higher manufacturing activities by construction companies in this region. Western andSouthern regions of India garnered a cumulative market share of over 60%, in the India commercial vehicles market inFY2016, in volume terms.
The light commercial vehicles segment is forecast to demonstrate the highest growth among all commercial vehiclesegments over the next five years. Important factors driving light commercial vehicle sales include rise in passengertransportation on account of continuing growth in tourism and hospitality sector. However, heavy commercial vehiclesare expected to maintain their dominance in the country’s commercial vehicles market through 2021.”, said Mr. KaranChechi, Research Director with TechSci Research, a research based global management consulting firm.

© TechSci Research
12
S a m p l e D a t a - S n a p s h o t
India Commercial Vehicles Market Size, By Value (USD
Billion), By Volume (Thousand Units), FY2012-FY2022F
1 2 3 4 5 7 8 9 10 11 12
3 5 7 9 1115 17 19 21 23 25
2012 2013 2014 2015 2016 2017 2018 2019 2020 2021 2022
Value (USD Billion) Volume (Million Units)Source:XXXXX
Note: These are dummy figures; please purchase our report for actual data
India Commercial Vehicles Market Share, By
Company, By Volume, FY2016-FY2022F
10% 10% 10% 10% 10% 10% 10%
20% 20% 20% 20% 20% 20% 20%
30% 30% 30% 30% 30% 30% 30%
40% 40% 40% 40% 40% 40% 40%
FY2016 FY2017E FY2018F FY2019F FY2020F FY2021F FY2022F
Tata Motors Mahindra & Mahindra Ashok Leyland Others*
India Commercial Vehicles Market Share, By
Vehicle Type, By Volume, FY2016-FY2022F
10% 10% 10% 10% 10% 10% 10% 10% 10% 10% 10%
20% 20% 20% 20% 20% 20% 20% 20% 20% 20% 20%
70% 70% 70% 70% 70% 70% 70% 70% 70% 70% 70%
LCV HCV MCV
India Commercial Vehicles Market Share, By
Region, By Volume, FY2016-FY2022F
10% 10% 10% 10% 10% 10% 10%
20% 20% 20% 20% 20% 20% 20%
30% 30% 30% 30% 30% 30% 30%
40% 40% 40% 40% 40% 40% 40%
FY2016 FY2017E FY2018F FY2019F FY2020F FY2021F FY2022F
Western Region Southern Region Northern Region Eastern Region
India Medium Commercial Vehicles (Bus) Market Share, By
End Use Industry, By Volume, FY2016-FY2022F
10% 10% 10% 10% 10% 10% 10%
20% 20% 20% 20% 20% 20% 20%
30% 30% 30% 30% 30% 30% 30%
40% 40% 40% 40% 40% 40% 40%
FY2016 FY2017E FY2018F FY2019F FY2020F FY2021F FY2022F
Public Transport School & College Transportation
Staff Transportation Tourism
India Medium Commercial Vehicles Market Size, By Value (USD
Billion), By Volume (Thousand Units), FY2012-FY2022F
1 2 3 4 5 7 8 9 10 11 12
3 5 7 9 1115 17 19 21 23 25
2012 2013 2014 2015 2016 2017 2018 2019 2020 2021 2022
Value (USD Billion) Volume (Million Units)

© TechSci Research
13
R e p o r t O r d e r i n g
To View Sample OR Purchase Report
Report Price
Report Name: India Commercial Vehicles Market By Vehicle Type, By End Use
Industry, Competition Forecast and Opportunities, 2021
License Type Price
Electronic Access - Single User License $2500
CD-ROM Mail Delivery $3000
Hard Copy Mail Delivery $3500
Electronic Access - Multi-User License $5000

A b o u t U s & D i s c l a i m e r
14
© TechSci Research
TechSci Research – North America
708 Third Avenue, Manhattan,
New York, United States
Tel: +1- 646- 360- 1656
Email: [email protected]
www.techsciresearch.com
About Us:
TechSci Research is a global market research and consulting company with offices in the US, UK and India. TechSci Research provides
market research reports in a number of areas to organizations. The company uses innovative business models that focus on improving
productivity, while ensuring creation of high-quality reports. The proprietary forecasting models use various analyses of both industry-
specific and macroeconomic variables on a state-by-state basis to produce a unique ‘bottom-up’ model of a country, regional and global
industry prospects. Combined with the detailed analysis of company activity and industry trends, the result is a uniquely rich evaluation
of the opportunities available in the market.
Related Reports
Global OTR Tire Market, Competition Forecast & Opportunities, 2011-2021
United States Tire Market Forecast & Opportunities, 2020
United Kingdom Tire Market Forecast and Opportunities, 2021
Partial List of Clients
Disclaimer:
The contents of this report are based on information generally available to the public from sources believed to be reliable. No representation is made thatit is timely, accurate or complete. TechSci Research has taken due care and caution in compilation of data as this has been obtained from various sourcesincluding which it considers reliable and first hand. However, TechSci Research does not guarantee the accuracy, adequacy or completeness of anyinformation and it is not responsible for any errors or omissions or for the results obtained from the use of such information and especially states that ithas no financial liability whatsoever to the subscribers / users of this report. The information herein, together with all estimates and forecasts, can changewithout notice. All the figures provided in this document are indicative of relative market size and are strictly for client’s internal consumption. Usage ofthe same for purpose other than internal will require prior approval of TechSci Research.
TechSci Research – Europe
54, Oldbrook, Bretton,
Peterborough,
United Kingdom
Email: [email protected]
www.techsciresearch.com
TechSci Research – Asia-Pacific
B – 44, Sector – 57, Noida, National
Capital Region, U.P. - India
Tel: +91-120-4523900
Email: [email protected]
www.techsciresearch.com