Embed Size (px)
Citation preview
www.foodandwaterwatch.org
Trans-Pacific Partnership: Increasing the Gusher of Risky, Imported Fish
Tony Corbo
Senior Lobbyist
Food & Water Watch
Washington, DC
November 7, 2013
Shrimp aquaculture, Vietnam, FAO

Total Fish & Seafood Imports (imports in billions of pounds)
www.foodandwaterwatch.org
2.8 2.9
2.8 2.8 2.9
3.0 3.0
3.2
3.5
3.7 3.8
3.9
4.2
4.6 4.7
4.9
5.1 5.1 5.0 5.0
5.2 5.2 5.2
NAFTA,
Israel FTA
WTO China PNTR,
Vietnam FTA
China enters WTO,
Jordan FTA
Peru FTA
Oman FTA Bahrain FTA, Morocco FTA
El Salvador, Guatemala, Honduras
and Nicaragua ratify CAFTA
Costa Rica
joins CAFTA
Dominican Republic
enacts CAFTA
Colombia FTA;
Panama FTA,
South Korea FTA
Singapore FTA
Australia FTA
imports rose 76 percent 1995-2010 (post-NAFTA/WTO), compared to 46% increase 1980-1995 (data not shown)

Total TPP Fish & Seafood Imports (millions of pounds)
www.foodandwaterwatch.org
977 1,015
1,125
1,246 1,227 1,289
1,406
1,524 1,560
1,525 1,539 1,522 1,539 1,550 1,472 1,441
1,581
1,699
Source: USDA Foreign Agriculture Service
TPP fish and seafood imports constitute one-third of all U.S. imports
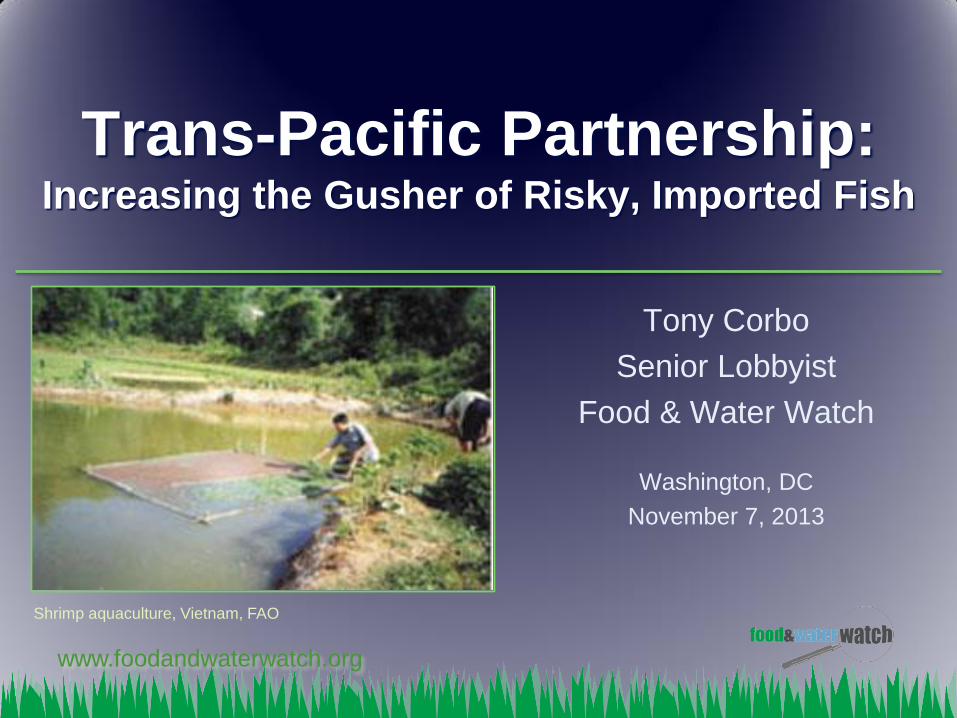
TPP Import Share of U.S. Consumption (2011 data, catfish 2010)
www.foodandwaterwatch.org
18.6%
40.1%
49.8% 50.5%
74.5%
Two out of
Five
Salmon
Every other Crab and
Catfish
Three out
of Four
Lobsters
Source: USDA FAS, Commerce Dept., NMFS
One in
Five
Shrimp
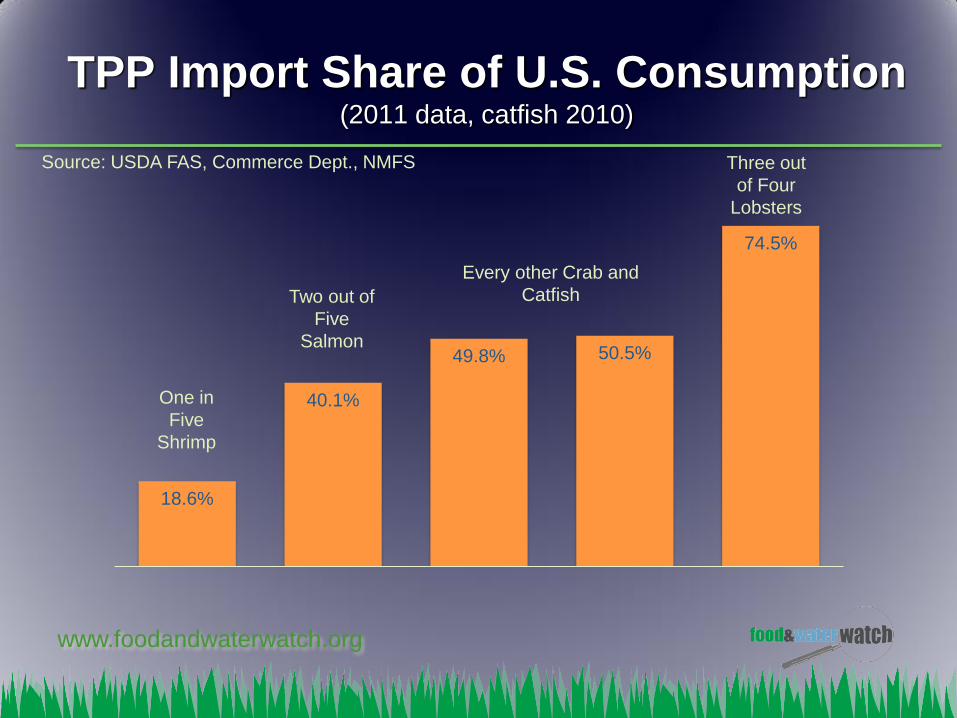
TPP Shrimp Imports (millions of pounds)
www.foodandwaterwatch.org
57.6 68.7
76.5
105.3 102.5 106.5
125.4 118.3 124.4
161.4
178.6
204.5 199.5
227.3 236.2
257.2
277.5
249.8
233.9
257.0
223.8
Source: USDA Foreign Agriculture Service

TPP Catfish Imports (millions of pounds)
www.foodandwaterwatch.org
Source: USDA Foreign Agriculture Service
0.2 0.1 0.2 0.7 2.2 7.1 17.1
9.6 4.3 6.6 19.5
44.7 40.6
55.5
87.3
109.5
188.8
227.7

TPP Catfish Imports and Real Catfish Price (price in 2012 dollars per pound, imports in millions of pounds)
www.foodandwaterwatch.org
Source: USDA Foreign Agriculture Service, National Agricultural Statistical Service
0.2 0.1 0.2 0.7 2.2 7.1
17.1 9.6
4.3 6.6
19.5
44.7 40.6
55.5
87.3
109.5
188.8
227.7
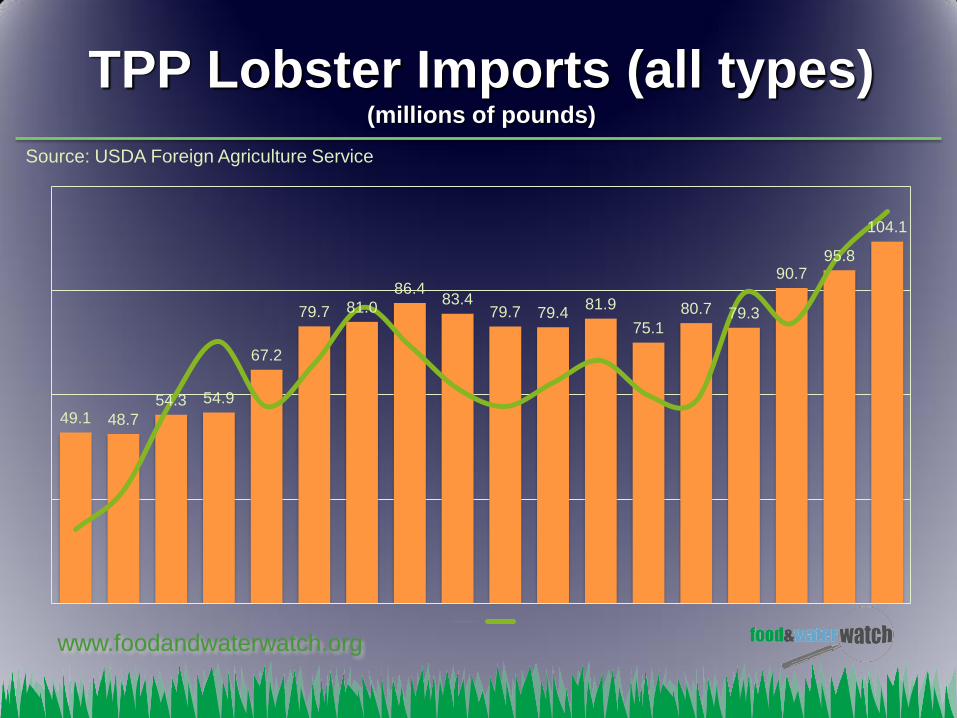
TPP Lobster Imports (all types) (millions of pounds)
www.foodandwaterwatch.org
49.1 48.7
54.3 54.9
67.2
79.7 81.0
86.4 83.4
79.7 79.4 81.9
75.1
80.7 79.3
90.7 95.8
104.1
Source: USDA Foreign Agriculture Service
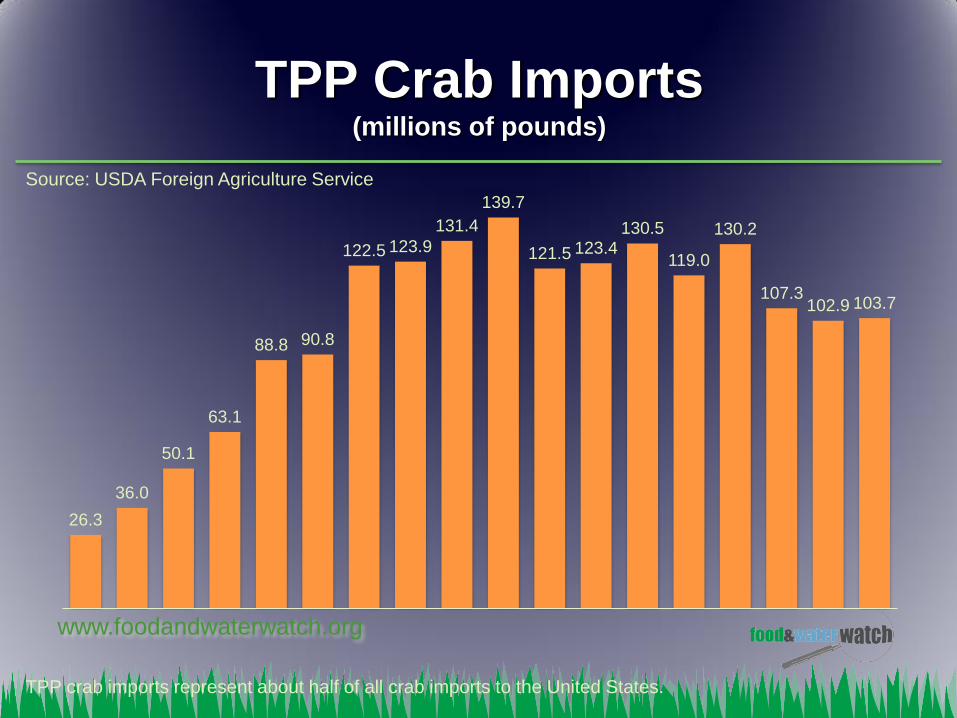
TPP Crab Imports (millions of pounds)
www.foodandwaterwatch.org
26.3
36.0
50.1
63.1
88.8 90.8
122.5 123.9
131.4
139.7
121.5 123.4 130.5
119.0
130.2
107.3 102.9 103.7
Source: USDA Foreign Agriculture Service
TPP crab imports represent about half of all crab imports to the United States.

TPP Salmon Imports (millions of pounds)
www.foodandwaterwatch.org
139 167
214 237
224
275
352
417 399 396
433 427 421 407
313
262
308
428
Source: USDA Foreign Agriculture Service

Average Annual Growth in
Imported Seafood 1995-2012
www.foodandwaterwatch.org
3.7% 4.3%
9.0%
4.8% 5.0%
9.8%
Source: USDA Foreign Agriculture Service

FDA Seafood Border Inspectors (Full-time equivalent)
www.foodandwaterwatch.org
Source: F&WW/FDA Workplans
70 70
103 104 101 100
80 83
92 90 *
* 2011 figure represents budgetary request.
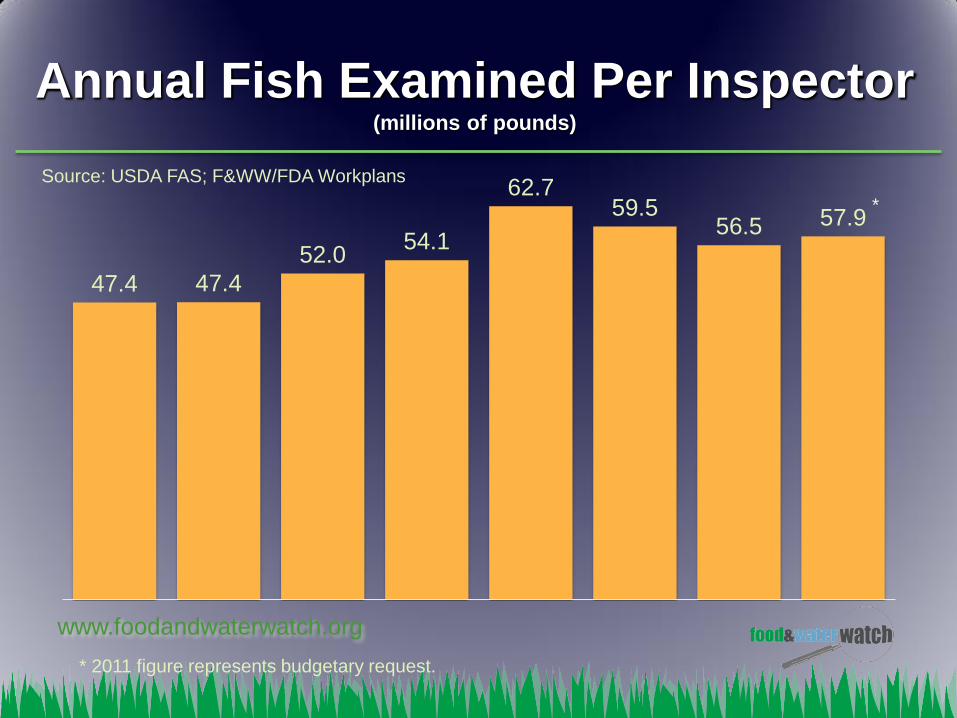
Annual Fish Examined Per Inspector (millions of pounds)
www.foodandwaterwatch.org
47.4 47.4
52.0 54.1
62.7 59.5
56.5 57.9
Source: USDA FAS; F&WW/FDA Workplans
*
* 2011 figure represents budgetary request.

www.foodandwaterwatch.org
FDA Seafood Inspection &
Laboratory Sample Rate (Percentage of shipments)
1.23% 1.25% 1.17% 1.34%
1.20%
0.88% 0.64%
0.68% 0.59%
Source: F&WW/FDA
*
* 2007 figure includes border and laboratory inspections

FDA Fish Refusals for Illegal Antibiotics,
Drugs & Chemicals from TPP Countries
www.foodandwaterwatch.org
6
14
32 37
19
52 54
88
20
49
58
Source: F&WW analysis of FDA data

Chemicals Tested for by FDA
www.foodandwaterwatch.org
Chemical Year FDA
Started
Testing
Human Health
Hazards
Common
Aquaculture Fish
Chloramphenicol
(AB)
2002 Aplastic anemia,
potential carcinogen,
antibiotic resistance
Shrimp, crab,
crayfish
Nitrofurans (AB) 2004 Potential carcinogen,
antibiotic resistance
Shrimp
Quinolones (AB) 2003/2004 Antibiotic resistance Catfish, salmon,
shrimp, tilapia
Malachite Green
(AF)
2005 Potential carcinogen Catfish, eel, salmon
Gentian Violet (AF) 2006 Potential carcinogen Catfish, eel, salmon
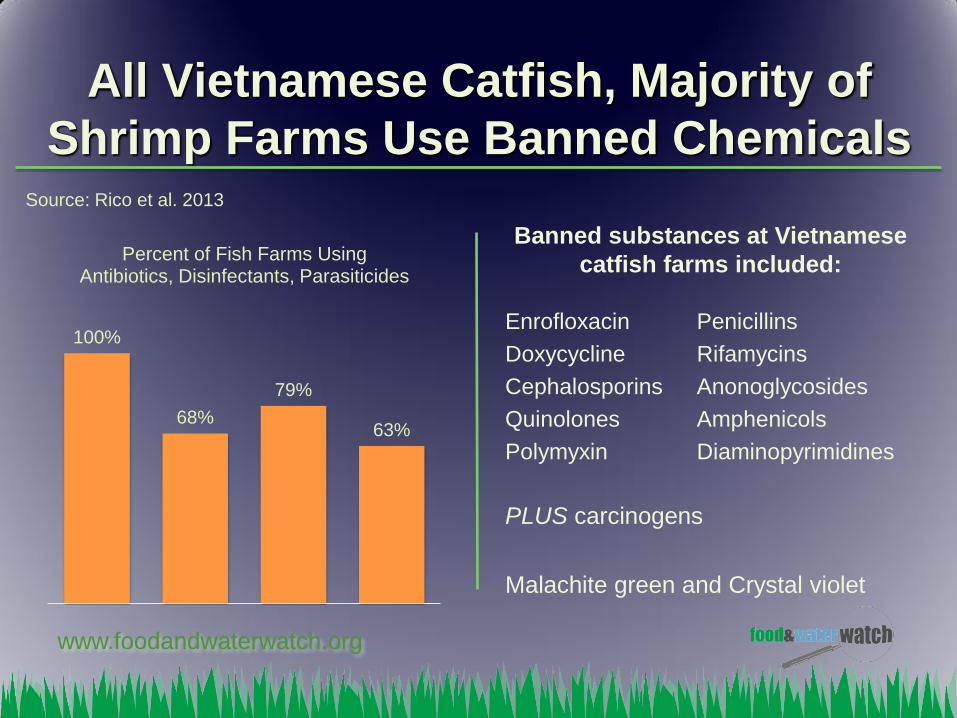
All Vietnamese Catfish, Majority of
Shrimp Farms Use Banned Chemicals
www.foodandwaterwatch.org
Source: Rico et al. 2013
100%
68%
79%
63%
Percent of Fish Farms Using Antibiotics, Disinfectants, Parasiticides
Banned substances at Vietnamese
catfish farms included:
Enrofloxacin Penicillins
Doxycycline Rifamycins
Cephalosporins Anonoglycosides
Quinolones Amphenicols
Polymyxin Diaminopyrimidines
PLUS carcinogens
Malachite green and Crystal violet
Other Food Safety Issues
“Harmonization” and “equivalence” privatized meat inspection in U.S. and abroad
USDA certified equivalent privatized inspection beef plants exported tainted meat (Washington Post, 9/20/13)
USDA rejected 11 shipments of Australian beef for visible fecal matter in past 2 years;
Canadian plant exported 2.2 million pounds of e-coli tainted ground beef in 2012
In U.S., 3 of 5 hog processing plants in pilot privatized inspection among “10 worst offenders” for health and safety violations (Washington Post, 9-8-13)