Embed Size (px)
Citation preview
Confidential
April 2008
PRELIMINARY | SUBJECT TO FURTHER REVIEW AND EVALUATIONThese materials may not be used or relied upon for any purpose other than as specifically contemplated by a written agreement with Credit Suisse.
Software 2008 Presentation Slides for CS Panel
Confidential
1
$1 $0
$3
$1 $1
$3 $2$1 $1 $1
$7
$5 $5
$3
$5
$9
$5$4
$19 $19
$2 $2 $1
$5
$2$4
$7
$0$0$0
10194
73
153
168
155
115
144
216
120
68
249
202
22 20 21
67
42
55
73
24
3 414
3816
35 3240 40
53
$0
$2
$4
$6
$8
$10
$12
$14
$16
$18
$20
1978 1979 1980 1981 1982 1983 1984 1985 1986 1987 1988 1989 1990 1991 1992 1993 1994 1995 1996 1997 1998 1999 2000 2001 2002 2003 2004 2005 2006 2007 2008
Val
ue
of
Tra
nsa
ctio
n (
$BN
)
0
50
100
150
200
250
Nu
mb
er o
f Tra
nsa
ctio
ns
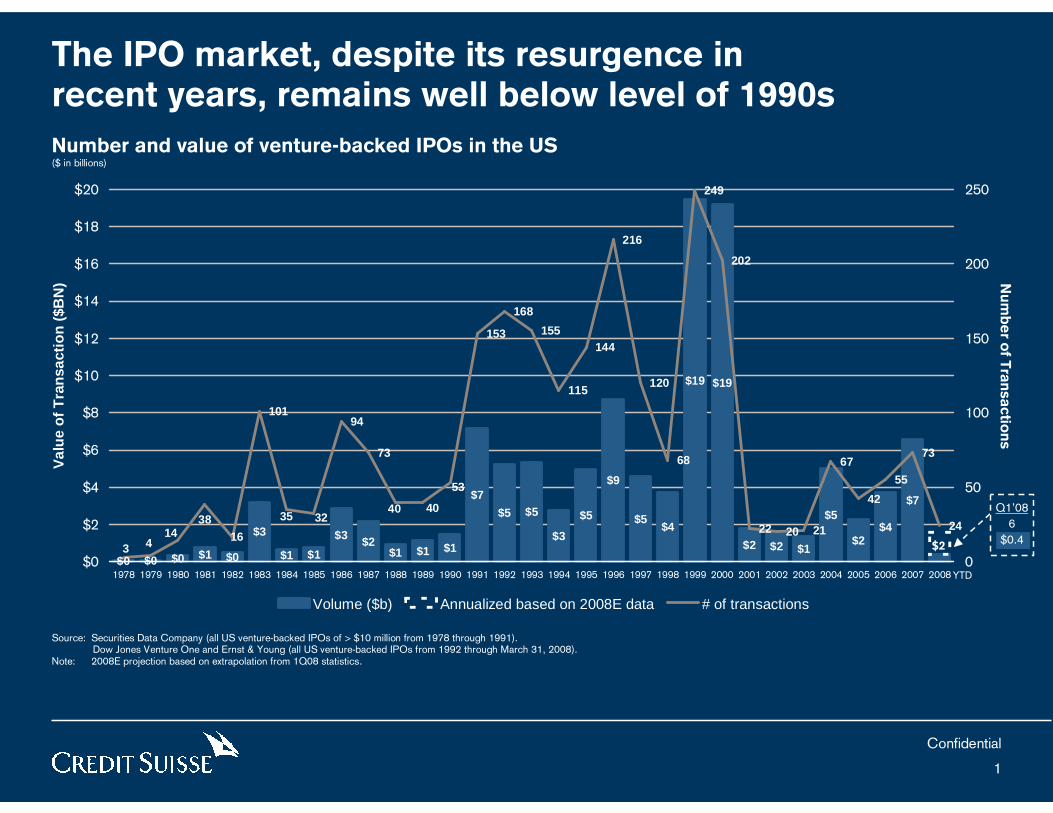
Q1’08
6
$0.4
The IPO market, despite its resurgence in recent years, remains well below level of 1990s
Number and value of venture-backed IPOs in the US($ in billions)
Source: Securities Data Company (all US venture-backed IPOs of > $10 million from 1978 through 1991).Dow Jones Venture One and Ernst & Young (all US venture-backed IPOs from 1992 through March 31, 2008).
Note: 2008E projection based on extrapolation from 1Q08 statistics.
Volume ($b) Annualized based on 2008E data # of transactions
$2
YTD
Confidential
2
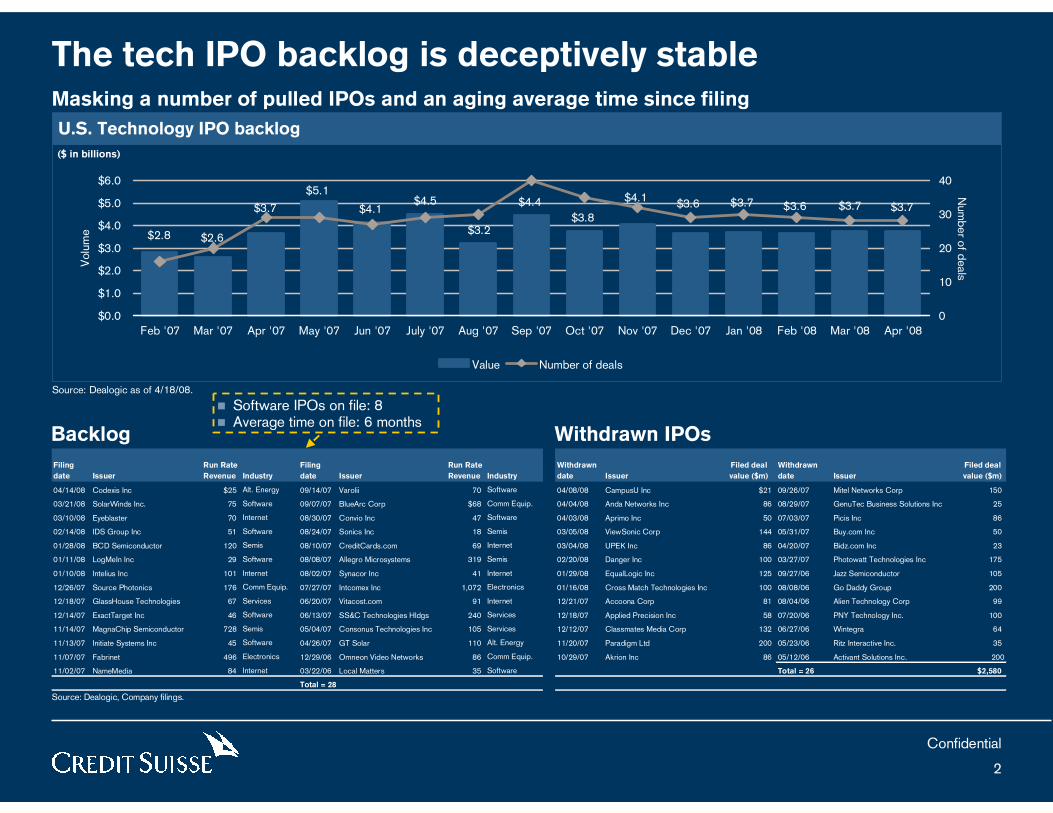
U.S. Technology IPO backlog
The tech IPO backlog is deceptively stable
Source: Dealogic, Company filings.
Masking a number of pulled IPOs and an aging average time since filing
Source: Dealogic as of 4/18/08.
$4.1$4.4
$3.8
$4.1
$3.2
$4.5
$2.6
$3.6 $3.7$3.6$3.7$5.1
$3.7 $3.7
$2.8
$0.0
$1.0
$2.0
$3.0
$4.0
$5.0
$6.0
Feb '07 Mar '07 Apr '07 May '07 Jun '07 July '07 Aug '07 Sep '07 Oct '07 Nov '07 Dec '07 Jan '08 Feb '08 Mar '08 Apr '08
Volu
me
0
10
20
30
40
Num
ber o
f deals
Value Number of deals
($ in billions)
Backlog Withdrawn IPOs
Filing
date Issuer
Run Rate
Revenue Industry
Filing
date Issuer
Run Rate
Revenue Industry
Withdrawn
date Issuer
Filed deal
value ($m)
Withdrawn
date Issuer
Filed deal
value ($m)
04/14/08 Codexis Inc $25 Alt. Energy 09/14/07 Varolii 70 Software 04/08/08 CampusU Inc $21 09/26/07 Mitel Networks Corp 150
03/21/08 SolarWinds Inc. 75 Software 09/07/07 BlueArc Corp $68 Comm Equip. 04/04/08 Anda Networks Inc 86 08/29/07 GenuTec Business Solutions Inc 25
03/10/08 Eyeblaster 70 Internet 08/30/07 Convio Inc 47 Software 04/03/08 Aprimo Inc 50 07/03/07 Picis Inc 86
02/14/08 IDS Group Inc 51 Software 08/24/07 Sonics Inc 18 Semis 03/05/08 ViewSonic Corp 144 05/31/07 Buy.com Inc 50
01/28/08 BCD Semiconductor 120 Semis 08/10/07 CreditCards.com 69 Internet 03/04/08 UPEK Inc 86 04/20/07 Bidz.com Inc 23
01/11/08 LogMeIn Inc 29 Software 08/08/07 Allegro Microsystems 319 Semis 02/20/08 Danger Inc 100 03/27/07 Photowatt Technologies Inc 175
01/10/08 Intelius Inc 101 Internet 08/02/07 Synacor Inc 41 Internet 01/29/08 EqualLogic Inc 125 09/27/06 Jazz Semiconductor 105
12/26/07 Source Photonics 176 Comm Equip. 07/27/07 Intcomex Inc 1,072 Electronics 01/16/08 Cross Match Technologies Inc 100 08/08/06 Go Daddy Group 200
12/18/07 GlassHouse Technologies 67 Services 06/20/07 Vitacost.com 91 Internet 12/21/07 Accoona Corp 81 08/04/06 Alien Technology Corp 99
12/14/07 ExactTarget Inc 46 Software 06/13/07 SS&C Technologies Hldgs 240 Services 12/18/07 Applied Precision Inc 58 07/20/06 PNY Technology Inc. 100
11/14/07 MagnaChip Semiconductor 728 Semis 05/04/07 Consonus Technologies Inc 105 Services 12/12/07 Classmates Media Corp 132 06/27/06 Wintegra 64
11/13/07 Initiate Systems Inc 45 Software 04/26/07 GT Solar 110 Alt. Energy 11/20/07 Paradigm Ltd 200 05/23/06 Ritz Interactive Inc. 35
11/07/07 Fabrinet 496 Electronics 12/29/06 Omneon Video Networks 86 Comm Equip. 10/29/07 Akrion Inc 86 05/12/06 Activant Solutions Inc. 200
11/02/07 NameMedia 84 Internet 03/22/06 Local Matters 35 Software Total = 26 $2,580
Total = 28
� Software IPOs on file: 8� Average time on file: 6 months
Confidential
3
$10 $17 $34
$97$111
$153
$426
$588
$130
$54$77
$91
$144
$236
$281
35
382
228
164120
9565
809
327
196215
278
340
396
521
444
$0
$100
$200
$300
$400
$500
$600
1993 1994 1995 1996 1997 1998 1999 2000 2001 2002 2003 2004 2005 2006 2007 2008YTD
Val
ue
of
Tra
nsa
ctio
ns
($B
N)
0
100
200
300
400
500
600
700
800
900
Nu
mb
er of T
ransactio
ns
Volume ($b) Annualized based on 2008E data # of transactions
$112
Q1’08
$28
111
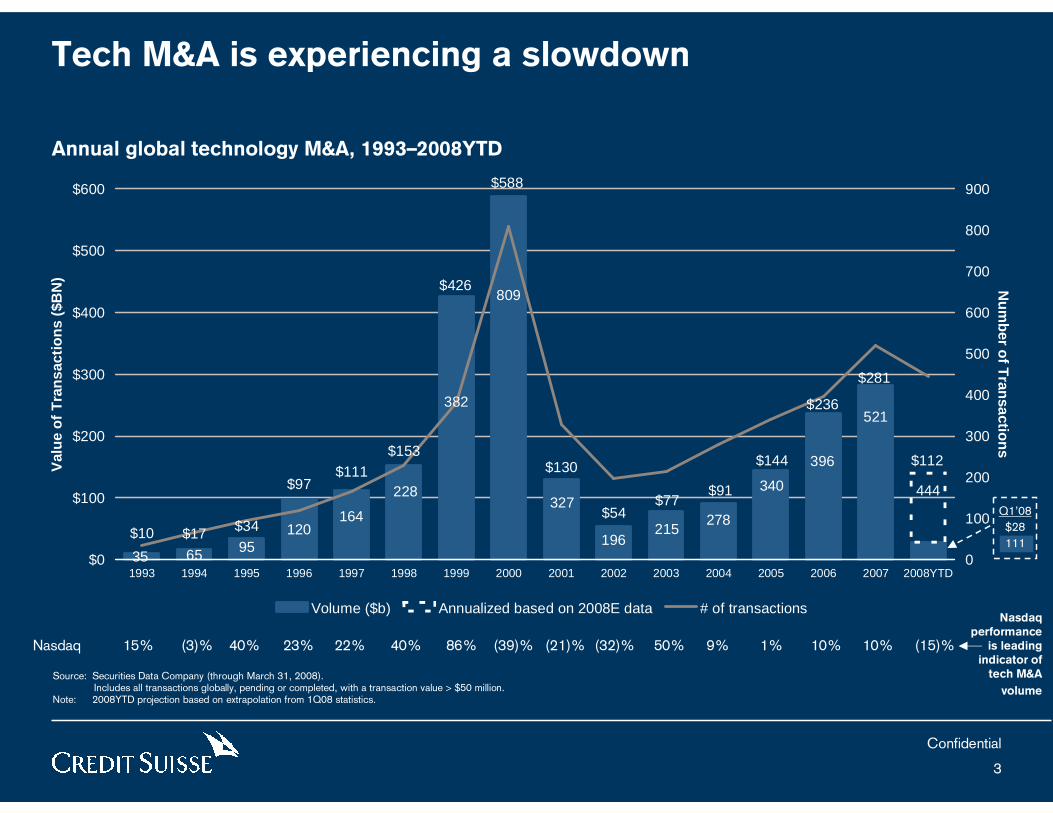
Tech M&A is experiencing a slowdown
Nasdaq 15% (3)% 40% 23% 22% 40% 86% (39)% (21)% (32)% 50% 9% 1% 10% 10% (15)%
Nasdaqperformance
is leadingindicator of
tech M&A
volume
Annual global technology M&A, 1993–2008YTD
Source: Securities Data Company (through March 31, 2008).Includes all transactions globally, pending or completed, with a transaction value > $50 million.
Note: 2008YTD projection based on extrapolation from 1Q08 statistics.
Confidential
4
69
53
77
38
48
25 28 3
4
32
16
24
17
7
22
74 77
77
70
43
71
18
14
10
24
14 19
8 5 17
12
13
16
8
18
13
24
11
27
12
37
25
5 5 4
8
4
9
1
6
2
6
50
20
40
60
80
100
Q1 Q2 Q3 Q4 Q1 Q2 Q3 Q4 Q1 Q2 Q3 Q4 Q1 Q2 Q3 Q4 Q1 Q2 Q3 Q4 Q1 Q2 Q3 Q4 Q1 Q2 Q3 Q4 Q1 Q2 Q3 Q4 Q1 Q2 Q3 Q4 Q1 Q2 Q3 Q4 Q1 Q2 Q3 Q4 Q1 Q2 Q3 Q4 Q1 Q2 Q3 Q4 Q1
21
49
49
46 47 52
42
55
69
48
67
62 7
1
53
86
81 84
12
5
11
3
11
6
10
4
10
6
10
4
99
95
88
11
4
89 92
76 8
4
97
83
105
10
8
10
6
10
1
94 98 1
11
99 10
8
10
6
97
81
10
2
93 97 10
6
67
11
813
0
20
40
60
80
100
120
140
Q1 Q2 Q3 Q4 Q1 Q2 Q3 Q4 Q1 Q2 Q3 Q4 Q1 Q2 Q3 Q4 Q1 Q2 Q3 Q4 Q1 Q2 Q3 Q4 Q1 Q2 Q3 Q4 Q1 Q2 Q3 Q4 Q1 Q2 Q3 Q4 Q1 Q2 Q3 Q4 Q1 Q2 Q3 Q4 Q1 Q2 Q3 Q4 Q1 Q2 Q3 Q4 Q1
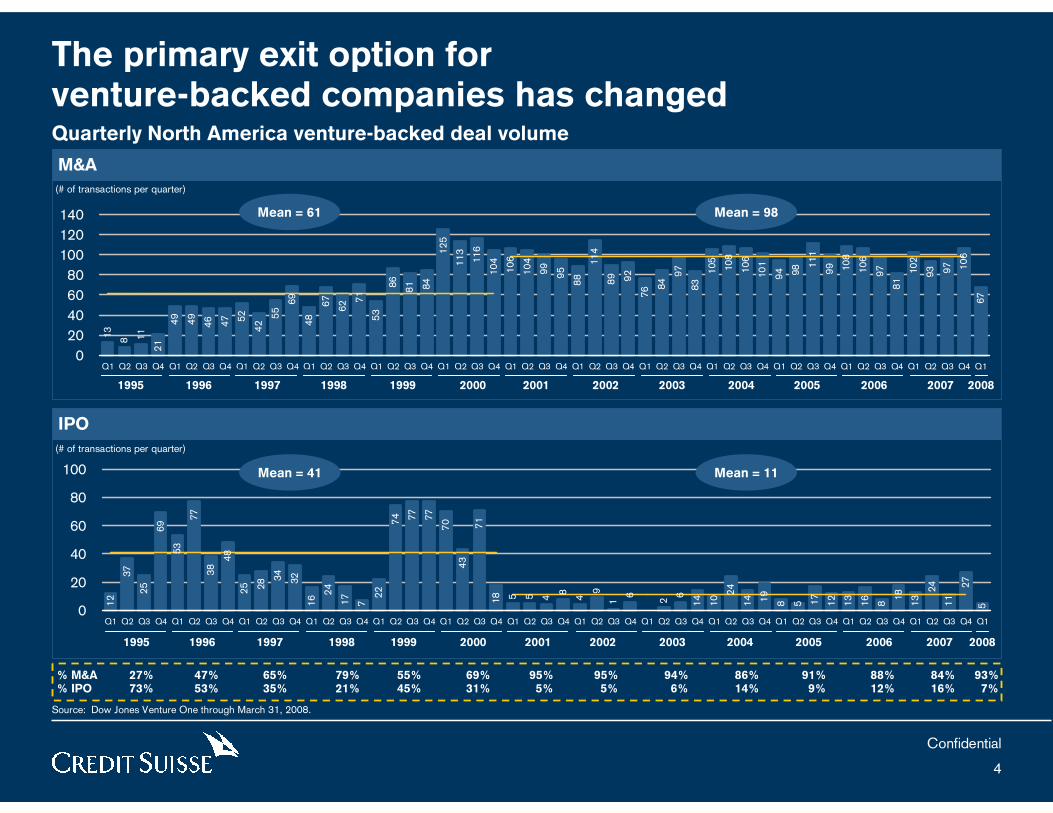
The primary exit option for venture-backed companies has changed
M&A
IPO
Quarterly North America venture-backed deal volume
Source: Dow Jones Venture One through March 31, 2008.
(# of transactions per quarter)
(# of transactions per quarter)
Mean = 61 Mean = 98
Mean = 41 Mean = 11
1995 1996 1997 1998 1999 2000 2001 2002 2003 2004 2005 2006 2007 2008
1995 1996 1997 1998 1999 2000 2001 2002 2003 2004 2005 2006 2007 2008
% M&A 27% 47% 65% 79% 55% 69% 95% 95% 94% 86% 91% 88% 84% 93%% IPO 73% 53% 35% 21% 45% 31% 5% 5% 6% 14% 9% 12% 16% 7%
Confidential
5
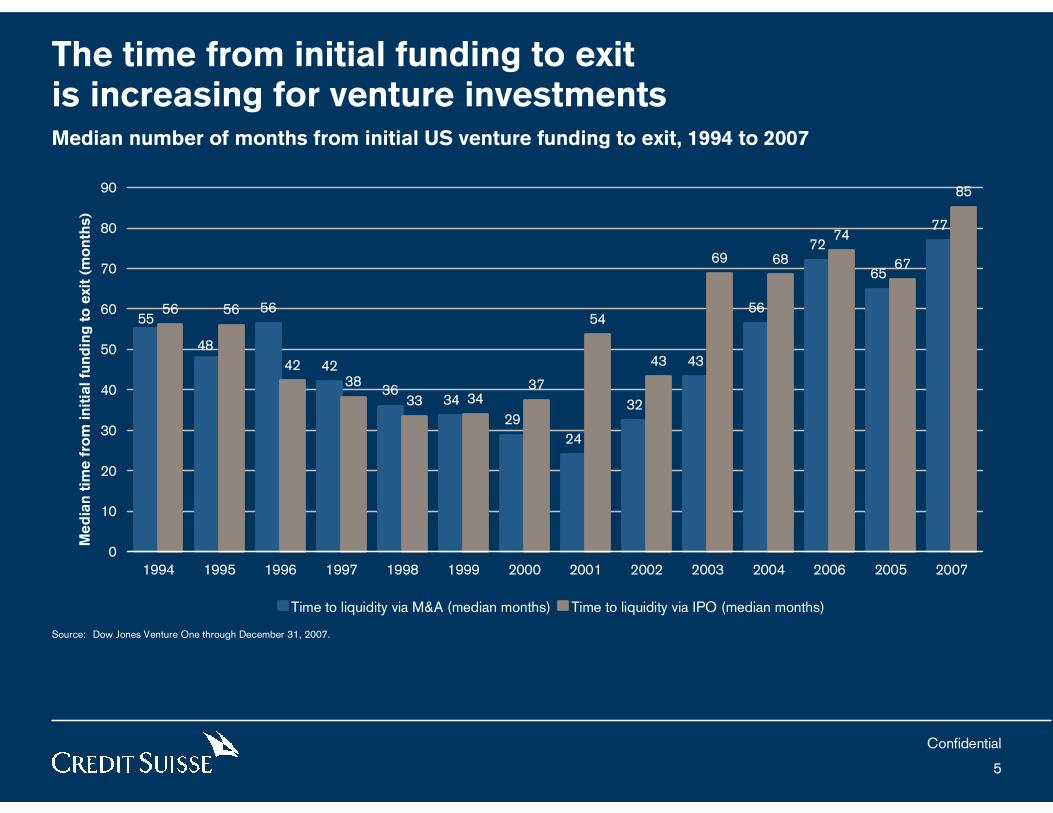
The time from initial funding to exit is increasing for venture investmentsMedian number of months from initial US venture funding to exit, 1994 to 2007
Source: Dow Jones Venture One through December 31, 2007.
56
42
3634
29
24
32
43
56
72
65
77
56 56
4238
33 3437
54
43
69 68
74
67
85
0
10
20
30
40
50
60
70
80
90
1994 1995 1996 1997 1998 1999 2000 2001 2002 2003 2004 2006 2005 2007
Me
dia
n t
ime
fro
m in
itia
l fu
nd
ing
to
exit
(m
on
ths)
Time to liquidity via M&A (median months) Time to liquidity via IPO (median months)
55
48
Confidential
6
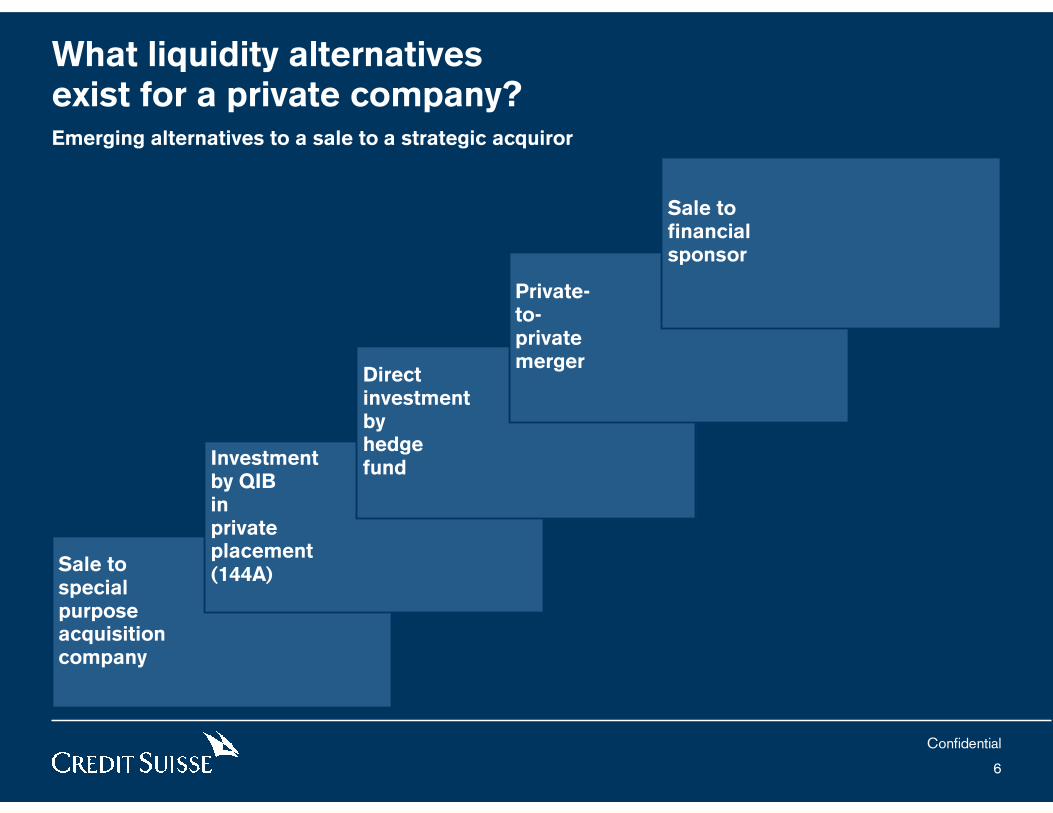
What liquidity alternatives exist for a private company?Emerging alternatives to a sale to a strategic acquiror
Sale tospecialpurposeacquisitioncompany
Investmentby QIBin privateplacement (144A)
Directinvestmentbyhedgefund
Private-to-privatemerger
Sale tofinancialsponsor
Confidential
7
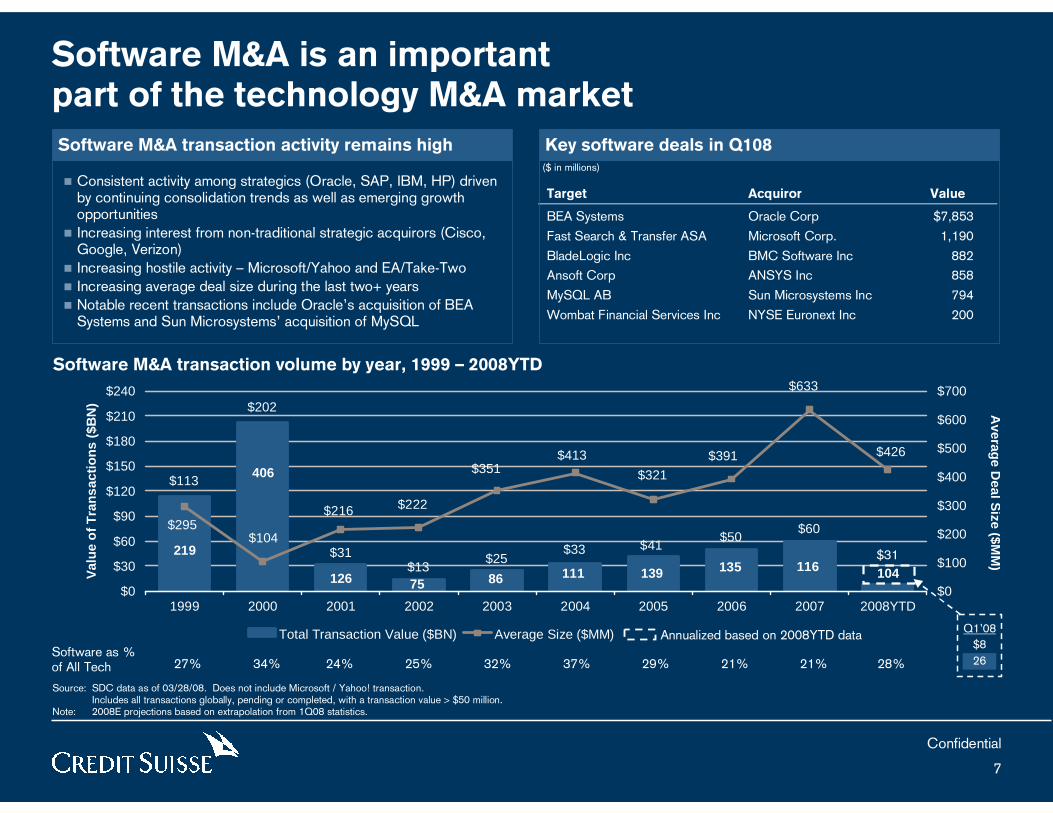
$60$50
$41$33$25
$13$31
$202
$113
$426
$633
$391
$321
$413$351
$222$216
$104$295
$0
$30
$60
$90
$120
$150
$180
$210
$240
1999 2000 2001 2002 2003 2004 2005 2006 2007 2008YTD
Val
ue
of
Tra
nsa
ctio
ns
($B
N)
$0
$100
$200
$300
$400
$500
$600
$700
Total Transaction Value ($BN) Average Size ($MM)
Averag
e Deal S
ize ($MM
)
219
406
126 75 86 111 139 135 116 104
Target Acquiror Value
BEA Systems Oracle Corp $7,853
Fast Search & Transfer ASA Microsoft Corp. 1,190
BladeLogic Inc BMC Software Inc 882
Ansoft Corp ANSYS Inc 858
MySQL AB Sun Microsystems Inc 794
Wombat Financial Services Inc NYSE Euronext Inc 200
Software M&A is an important part of the technology M&A market
� Consistent activity among strategics (Oracle, SAP, IBM, HP) driven by continuing consolidation trends as well as emerging growth opportunities
� Increasing interest from non-traditional strategic acquirors (Cisco, Google, Verizon)
� Increasing hostile activity – Microsoft/Yahoo and EA/Take-Two� Increasing average deal size during the last two+ years� Notable recent transactions include Oracle’s acquisition of BEA
Systems and Sun Microsystems’ acquisition of MySQL
Software M&A transaction volume by year, 1999 – 2008YTD
Annualized based on 2008YTD data
$31
Software M&A transaction activity remains high Key software deals in Q108
Source: SDC data as of 03/28/08. Does not include Microsoft / Yahoo! transaction.Includes all transactions globally, pending or completed, with a transaction value > $50 million.
Note: 2008E projections based on extrapolation from 1Q08 statistics.
27% 34% 24% 25% 32% 37% 29% 21% 21% 28%Software as %of All Tech
Q1’08
$8
26
($ in millions)
Confidential
8
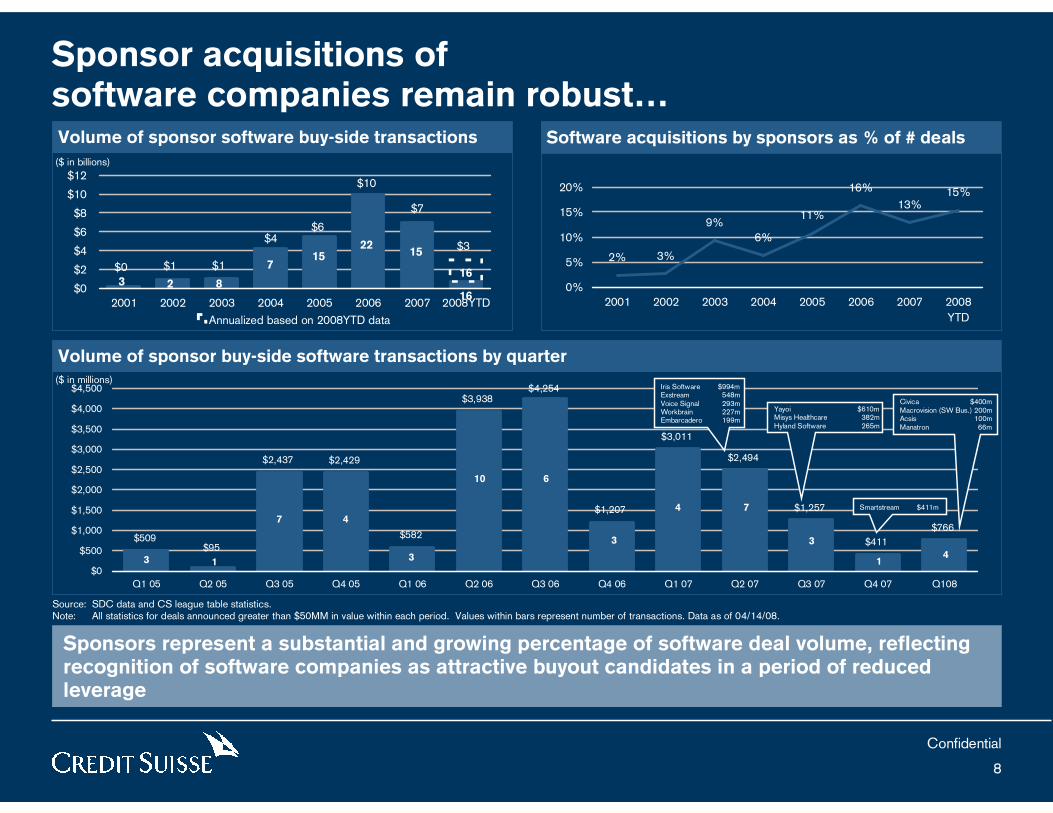
$509
$2,437 $2,429
$582
$3,938$4,254
$1,207
$3,011
$2,494
$1,257
$411
$766
$95
$0
$500
$1,000
$1,500
$2,000
$2,500
$3,000
$3,500
$4,000
$4,500
Q1 05 Q2 05 Q3 05 Q4 05 Q1 06 Q2 06 Q3 06 Q4 06 Q1 07 Q2 07 Q3 07 Q4 07 Q108
3 1
7 4
3
10 6
3
4 7
3
14
2% 3%
9%6%
11%
16%
13%15%
0%
5%
10%
15%
20%
2001 2002 2003 2004 2005 2006 2007 2008
YTD
$0 $1 $1
$4$6
$10
$7
$3
$0
$2
$4
$6
$8
$10
$12
2001 2002 2003 2004 2005 2006 2007 2008YTD
Annualized based on 2008YTD data
3 2 8
715
2215
16
16
Sponsor acquisitions ofsoftware companies remain robust…Volume of sponsor software buy-side transactions Software acquisitions by sponsors as % of # deals
Volume of sponsor buy-side software transactions by quarter
Sponsors represent a substantial and growing percentage of software deal volume, reflecting recognition of software companies as attractive buyout candidates in a period of reduced leverage
($ in billions)
Source: SDC data and CS league table statistics.Note: All statistics for deals announced greater than $50MM in value within each period. Values within bars represent number of transactions. Data as of 04/14/08.
($ in millions)Iris Software $994m Exstream 548mVoice Signal 293mWorkbrain 227mEmbarcadero 199m
Yayoi $610mMisys Healthcare 382mHyland Software 265m
Smartstream $411m
Civica $400mMacrovision (SW Bus.) 200mAcsis 100mManatron 66m
Confidential
9
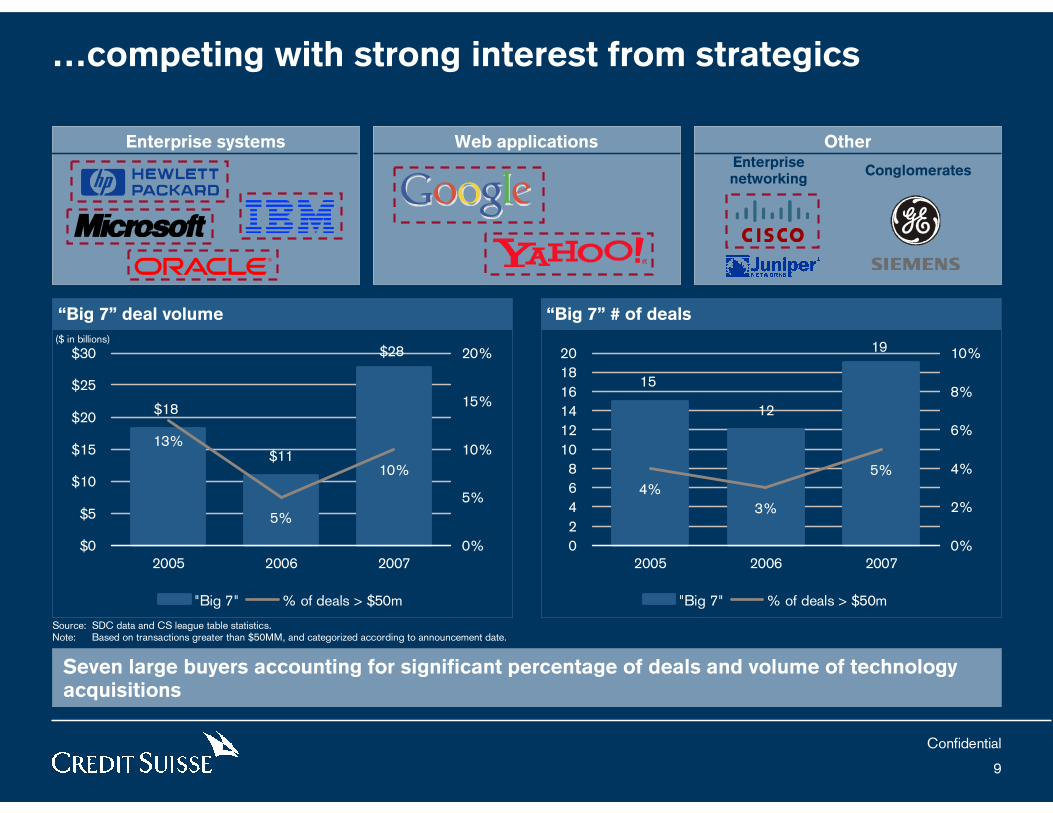
…competing with strong interest from strategics
Enterprise systems Web applications Other
“Big 7” deal volume “Big 7” # of deals
Seven large buyers accounting for significant percentage of deals and volume of technology acquisitions
$28
$18
$11
5%
10%
13%
$0
$5
$10
$15
$20
$25
$30
2005 2006 20070%
5%
10%
15%
20%
"Big 7" % of deals > $50m
($ in billions)19
15
12
3%
5%
4%
0
2
4
6
8
10
12
14
16
18
20
2005 2006 20070%
2%
4%
6%
8%
10%
"Big 7" % of deals > $50m
Source: SDC data and CS league table statistics.Note: Based on transactions greater than $50MM, and categorized according to announcement date.
ConglomeratesEnterprisenetworking
Confidential
10
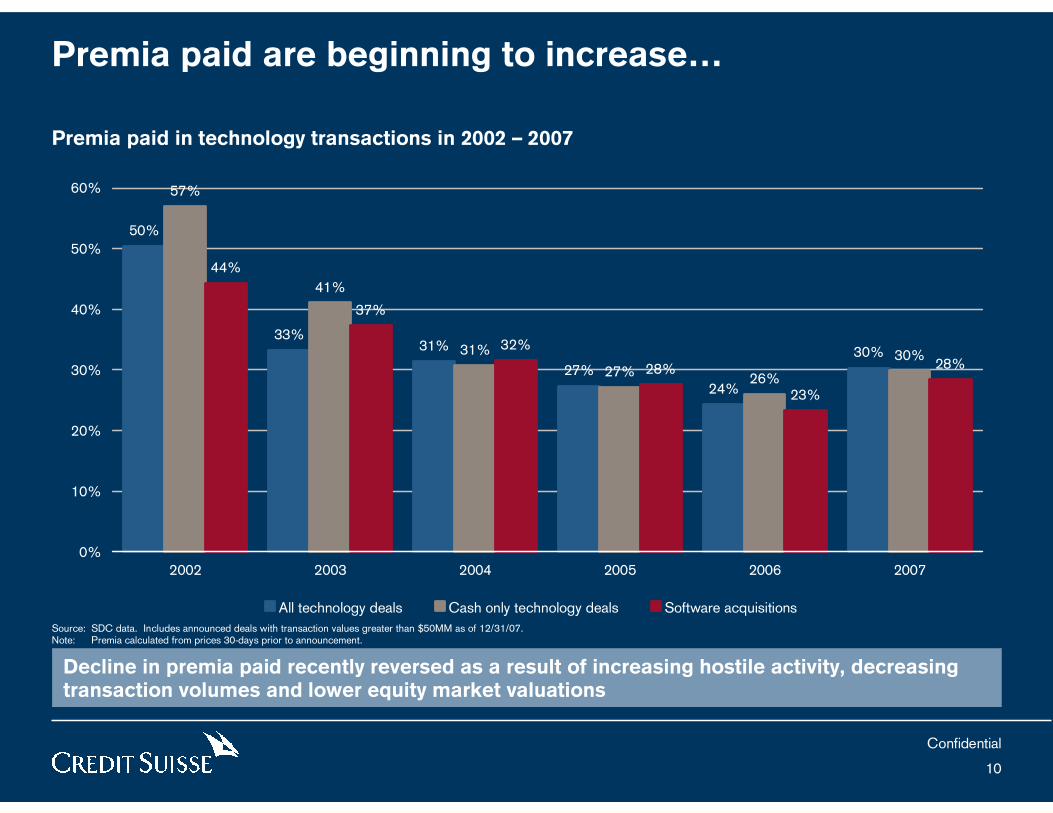
50%
33%31%
27%24%
30%
57%
41%
31%
27% 26%
30%
44%
37%
32%
28%
23%
28%
0%
10%
20%
30%
40%
50%
60%
2002 2003 2004 2005 2006 2007
All technology deals Cash only technology deals Software acquisitions
Premia paid are beginning to increase…
Premia paid in technology transactions in 2002 – 2007
Decline in premia paid recently reversed as a result of increasing hostile activity, decreasing transaction volumes and lower equity market valuations
Source: SDC data. Includes announced deals with transaction values greater than $50MM as of 12/31/07.Note: Premia calculated from prices 30-days prior to announcement.
Confidential
11
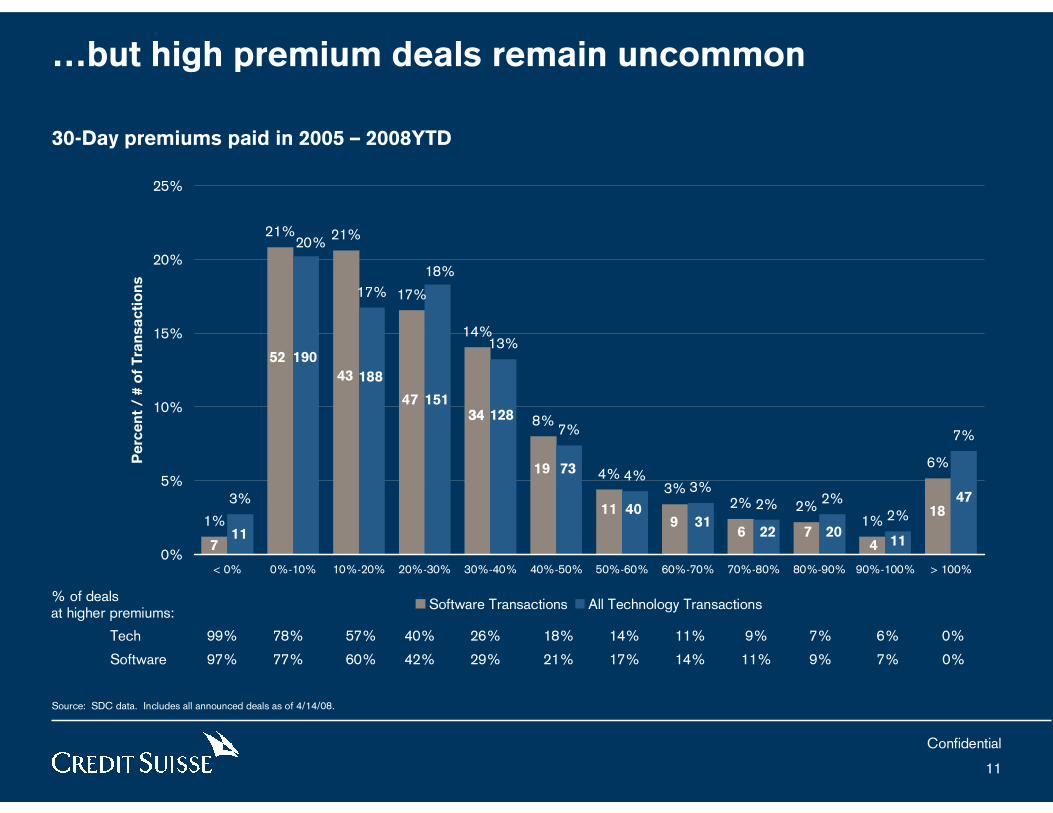
…but high premium deals remain uncommon
30-Day premiums paid in 2005 – 2008YTD
% of dealsat higher premiums:
Source: SDC data. Includes all announced deals as of 4/14/08.
Tech 99% 78% 57% 40% 26% 18% 14% 11% 9% 7% 6% 0%
Software 97% 77% 60% 42% 29% 21% 17% 14% 11% 9% 7% 0%
6%
1%2%2%
3%4%
8%
14%
17%
21%21%
1%
7%
2%2%2%
3%4%
7%
13%
18%
17%
20%
3%
0%
5%
10%
15%
20%
25%
< 0% 0%-10% 10%-20% 20%-30% 30%-40% 40%-50% 50%-60% 60%-70% 70%-80% 80%-90% 90%-100% > 100%
Pe
rce
nt
/ #
of
Tra
nsa
cti
on
s
Software Transactions All Technology Transactions
711
52 190
43 188
47 15134 12834
19 73
11 409 31
6 22 7 204 11
1847
Confidential
12
42%24%
35%20%
53%35%
60% 55%68%
55%69% 69% 77%
68% 73% 77% 77% 77%90% 83%
11%
10%
15%
15%
13%
16%
14% 19%12%
18%11% 17% 10%
14% 9% 10% 12% 14%8%
11%
46%
56%
48%
54%
32%
39%
24% 21%19%
19%18% 10% 9% 14% 15% 7% 7% 6% 7%11% 11% 10% 5% 7% 2% 4% 4% 5% 3% 6%
2%2% 2% 2% 2% 1% 3%3%
0%
20%
40%
60%
80%
100%
T S T S T S T S T S T S T S T S T S T S
Cash Hybrid Stock Other
1999 2000 2001 2002 2003 2004 2005 2006 2007 2008YTD
4%
11%12%
17%15% 15%
10% 11%9% 8%
0%
5%
10%
15%
20%
1999 2000 2001 2002 2003 2004 2005 2006 2007 2008 (1)
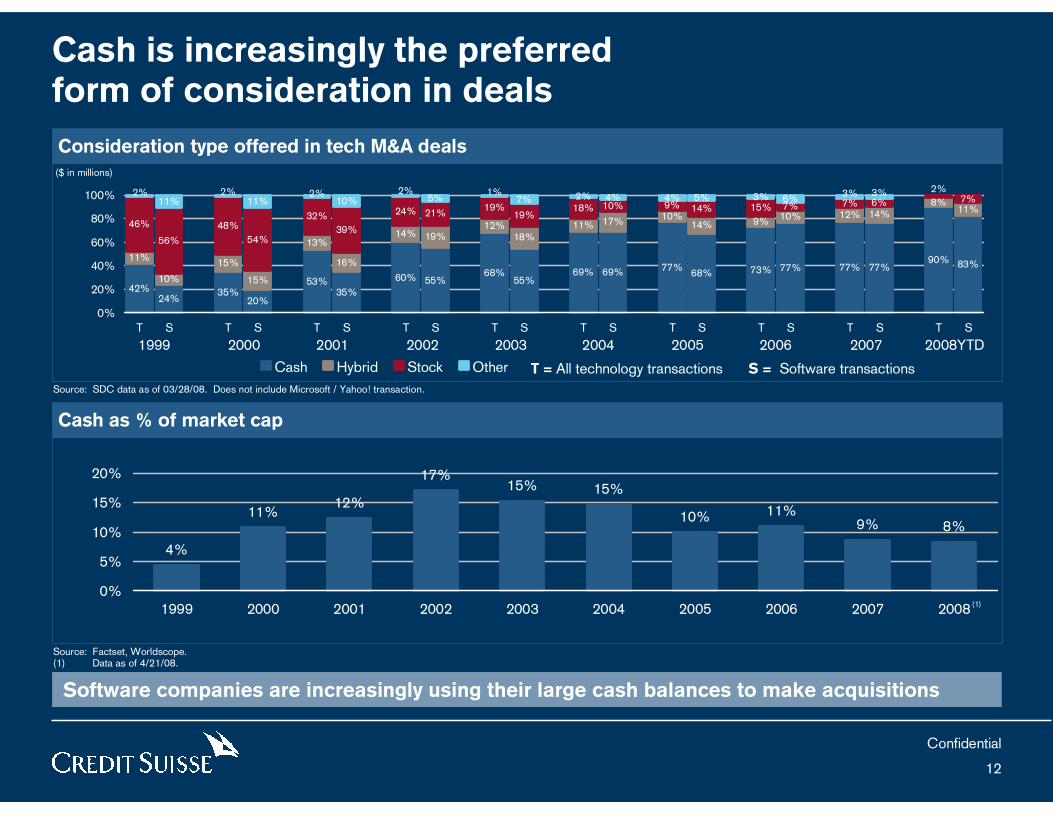
Cash is increasingly the preferredform of consideration in deals
Consideration type offered in tech M&A deals
Source: SDC data as of 03/28/08. Does not include Microsoft / Yahoo! transaction.
Software companies are increasingly using their large cash balances to make acquisitions
Cash as % of market cap
Source: Factset, Worldscope.(1) Data as of 4/21/08.
($ in millions)
T = All technology transactions S = Software transactions
Confidential
13
29%23%
16%
8%
41%
31%
48%
75%
90% 100%
0%
10%
20%
30%
40%
50%
$10MM-$100MM $100MM-$500MM $500MM-$1BN $1BN-$5BN >$5BN
Annual revenue
% m
arg
in
0%
20%
40%
60%
80%
100%
% o
f co
mp
anie
s
Mean NTM EBITDA margin % of companies w/ positive EBITDA ests.
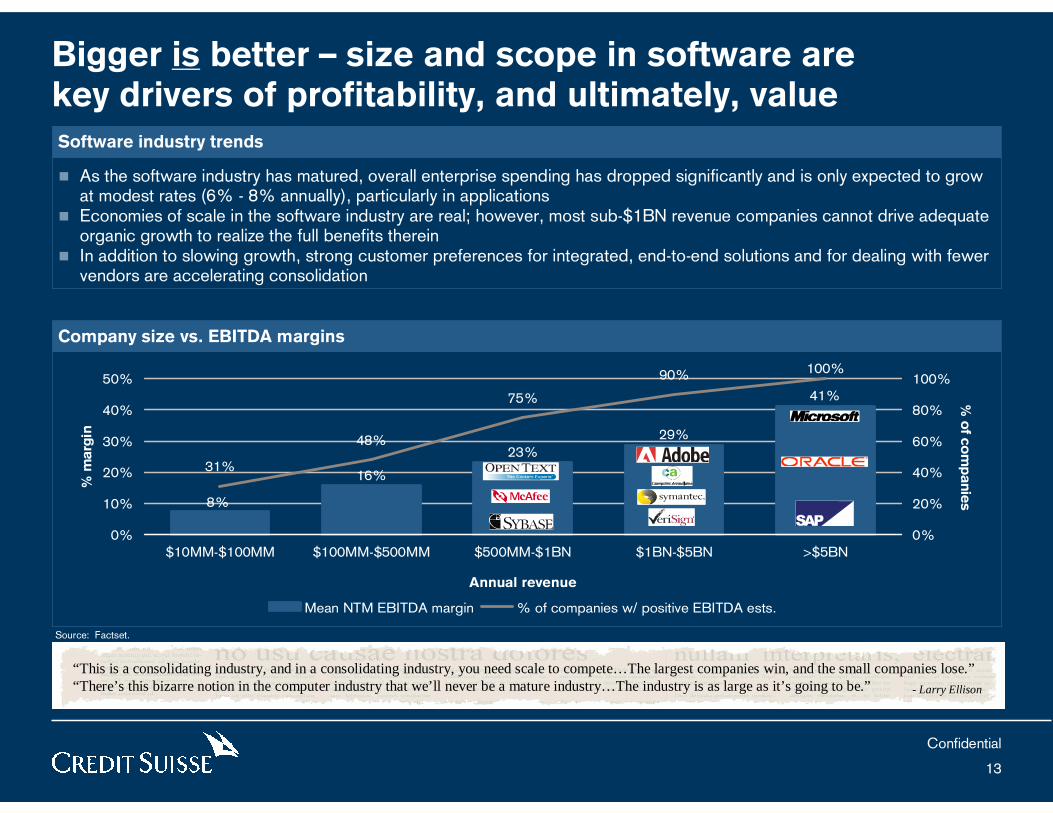
Bigger is better – size and scope in software are key drivers of profitability, and ultimately, valueSoftware industry trends
� As the software industry has matured, overall enterprise spending has dropped significantly and is only expected to grow at modest rates (6% - 8% annually), particularly in applications
� Economies of scale in the software industry are real; however, most sub-$1BN revenue companies cannot drive adequate organic growth to realize the full benefits therein
� In addition to slowing growth, strong customer preferences for integrated, end-to-end solutions and for dealing with fewer vendors are accelerating consolidation
Company size vs. EBITDA margins
- Larry Ellison
“This is a consolidating industry, and in a consolidating industry, you need scale to compete…The largest companies win, and the small companies lose.”“There’s this bizarre notion in the computer industry that we’ll never be a mature industry…The industry is as large as it’s going to be.”
Source: Factset.
Credit Suisse does not provide any tax advice. Any tax statement herein regarding any US federal tax is not intended or written to be used, and cannot be used, by any taxpayer for the purpose of avoiding any penalties. Any such statement herein was written to support the marketing or promotion of the transaction(s) or matter(s) to which the statement relates. Each taxpayer should seek advice based on the taxpayer's particular circumstances from an independent tax advisor.
These materials have been provided to you by Credit Suisse in connection with an actual or potential mandate or engagement and may not be used or relied upon for any purpose other than as specifically contemplated by a written agreement with Credit Suisse. In addition, these materials may not be disclosed, in whole or in part, or summarized or otherwise referred to except as agreed in writing by Credit Suisse. The information used in preparing these materials was obtained from or through you or your representatives or from public sources. Credit Suisse assumes no responsibility for independent verification of such information and has relied on such information being complete and accurate in all material respects. To the extent such information includes estimates and forecasts of future financial performance (including estimates of potential cost savings and synergies) prepared by or reviewed or discussed with the managements of your company and/or other potential transaction participants or obtained from public sources, we have assumed that such estimates and forecasts have been reasonably prepared on bases reflecting the best currently available estimates and judgments of such managements (or, with respect to estimates and forecasts obtained from public sources, represent reasonable estimates). These materials were designed for use by specific persons familiar with the business and the affairs of your company and Credit Suisse assumes no obligation to update or otherwise revise these materials. Nothing contained herein should be construed as tax, accounting or legal advice. You (and each of your employees, representatives or other agents) may disclose to any and all persons, without limitation of any kind, the tax treatment and tax structure of the transactions contemplated by these materials and all materials of any kind (including opinions or other tax analyses) that are provided to you relating to such tax treatment and structure. For this purpose, the tax treatment of a transaction is the purported or claimed US federal income tax treatment of the transaction and the tax structure of a transaction is any fact that may be relevant to understanding the purported or claimed US federal income tax treatment of the transaction.
Credit Suisse has adopted policies and guidelines designed to preserve the independence of its research analysts. Credit Suisse’s policies prohibit employees from directly or indirectly offering a favorable research rating or specific price target, or offering to change a research rating or price target, as consideration for or an inducement to obtain business or other compensation. Credit Suisse’s policies prohibit research analysts from being compensated for their involvement in investment banking transactions.
C:\
Docu
men
ts a
nd S
ettin
gs\
dch
orney
\Des
ktop
\Softw
are
Slid
es (
Pro
ject
ed).
pp
t
Confidential
14
Confidential
15
CREDIT SUISSE SECURITIES (USA) LLC
Eleven Madison Avenue
New York, NY 10010-3629
+1 212 325 2000
www.credit-suisse.com


![Software Engineering.ppt [호환 모드] - Konkukdslab.konkuk.ac.kr/Class/2008/08SMA/Presentation/Class B... · 2012. 9. 13. · Title: Microsoft PowerPoint - Software Engineering.ppt](https://img.dokumen.tips/doc/110x75/6121bf52e3836428e4353694/software-eeoe-konkukdslabkonkukackrclass200808smapresentationclass.jpg)


![Software Presentation[1]](https://img.dokumen.tips/doc/110x75/558bb9c2d8b42ab07c8b463e/software-presentation1.jpg)