Embed Size (px)
Citation preview
Don’t leave your customers behind:Explore secrets to demonstrating smart meter value for customers
Thursday, 15 October 2015
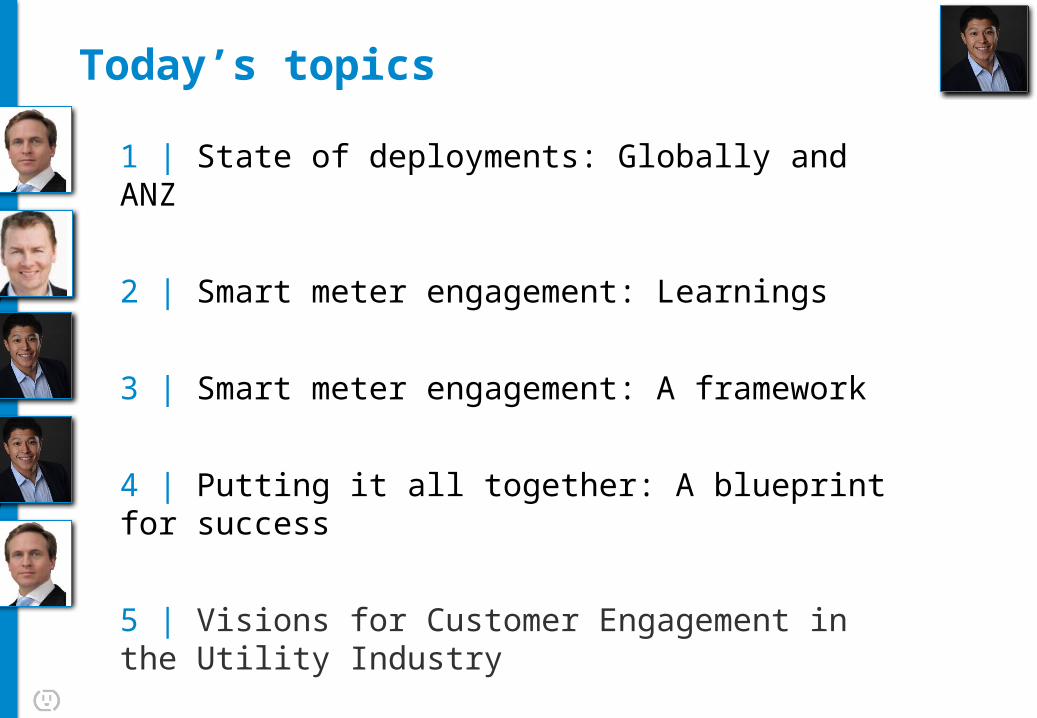
Today’s topics
1 | State of deployments: Globally and ANZ
2 | Smart meter engagement: Learnings
3 | Smart meter engagement: A framework
4 | Putting it all together: A blueprint for success
5 | Visions for Customer Engagement in the Utility Industry
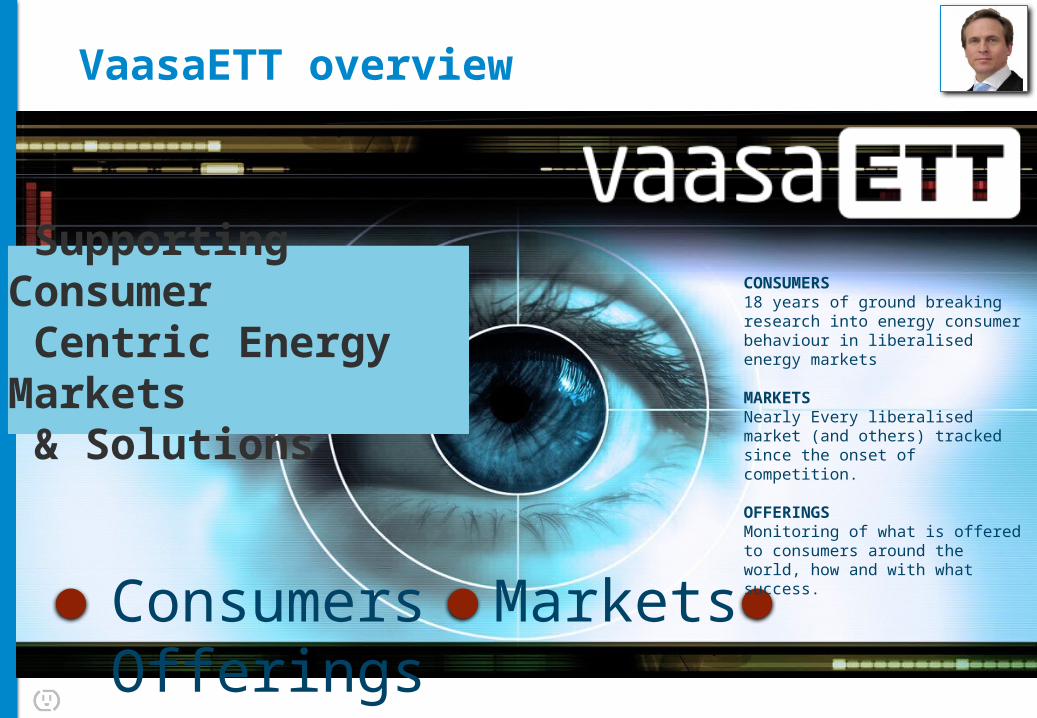
VaasaETT overview
Supporting Consumer Centric Energy Markets & Solutions
Consumers Markets Offerings
CONSUMERS 18 years of ground breaking research into energy consumer behaviour in liberalised energy markets
MARKETSNearly Every liberalised market (and others) tracked since the onset of competition.
OFFERINGSMonitoring of what is offered to consumers around the world, how and with what success.
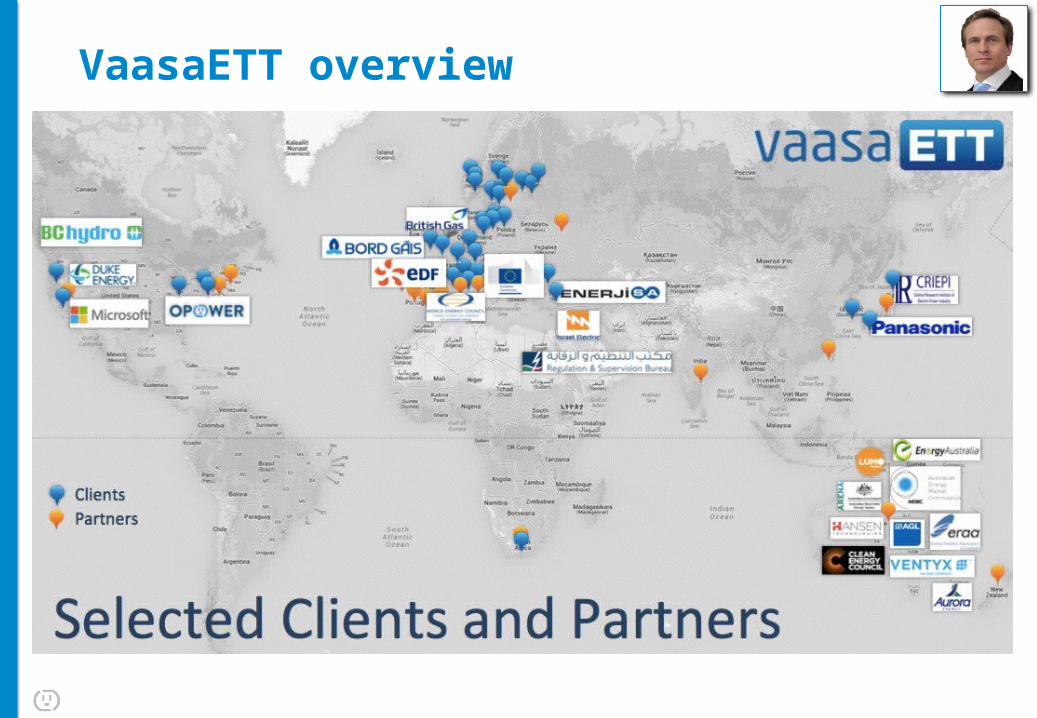
VaasaETT overview
VaasaETT overview
VaasaETT has researched or assisted over 100 customer engagement programmes around the world
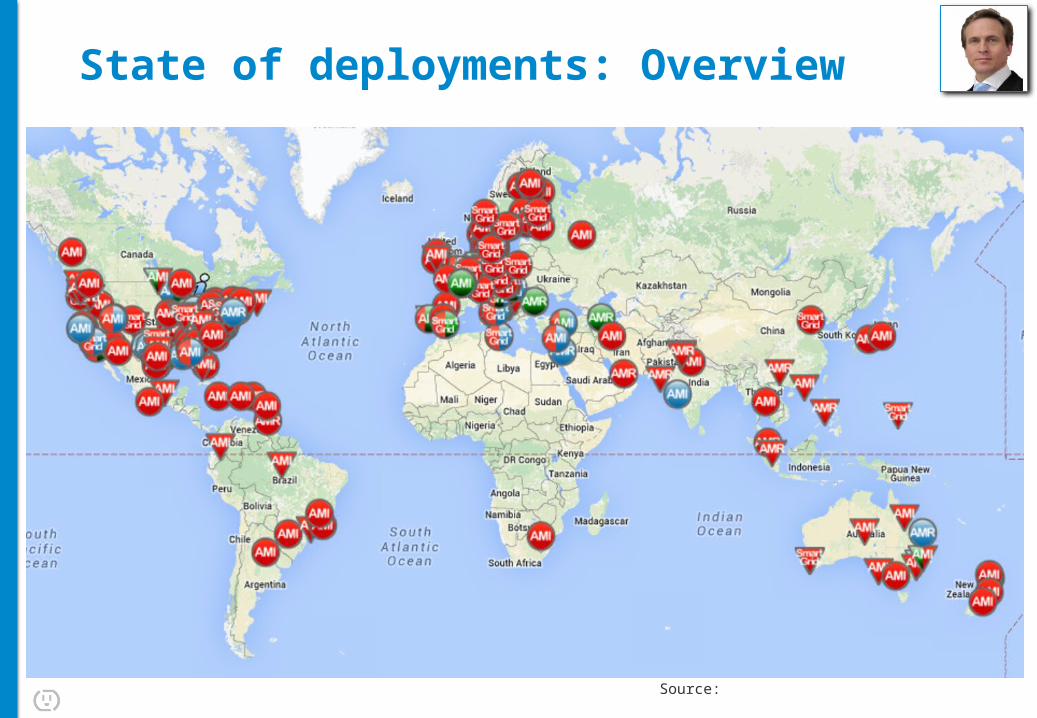
State of deployments: Overview
Source:
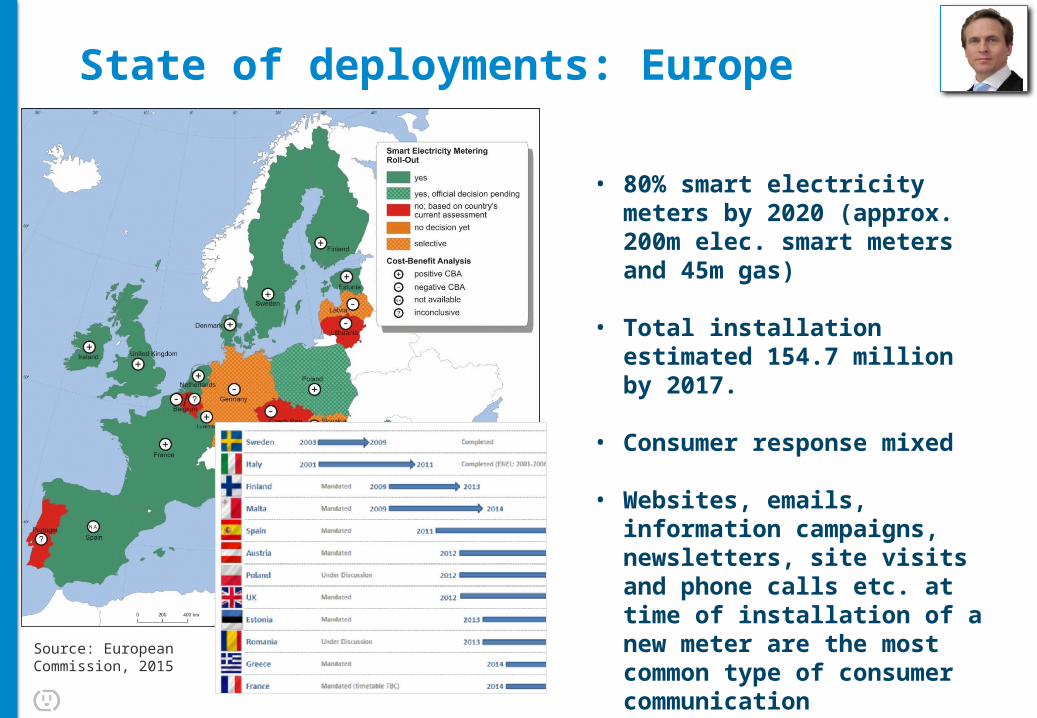
State of deployments: Europe
• 80% smart electricity meters by 2020 (approx. 200m elec. smart meters and 45m gas)
• Total installation estimated 154.7 million by 2017.
• Consumer response mixed
• Websites, emails, information campaigns, newsletters, site visits and phone calls etc. at time of installation of a new meter are the most common type of consumer communication
Source: European Commission, 2015
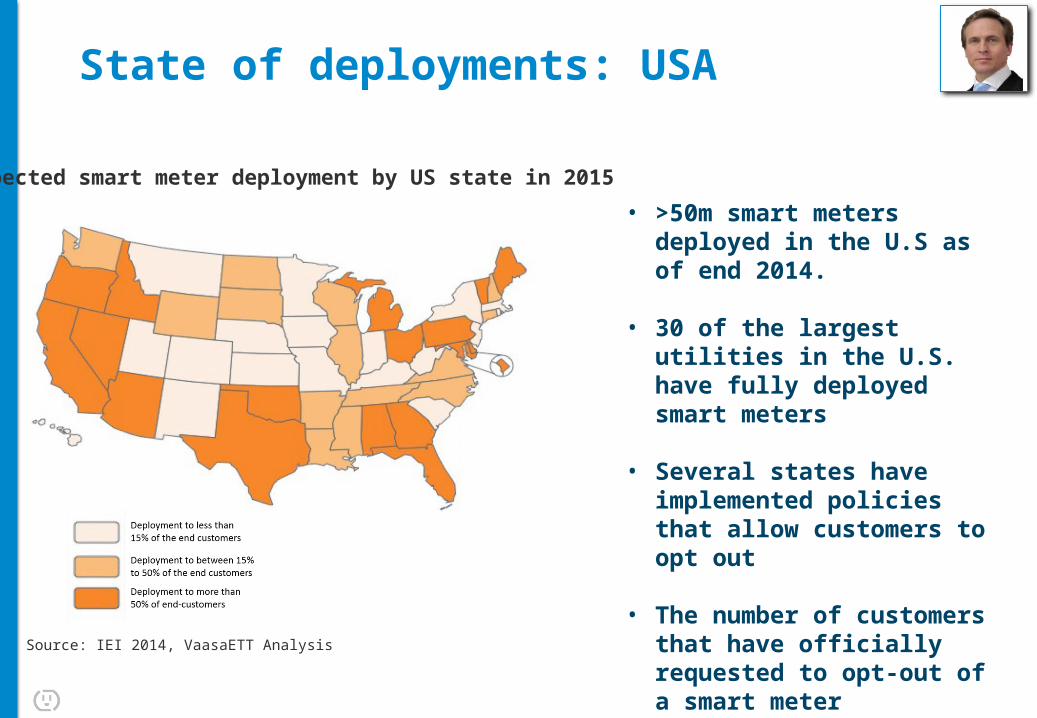
State of deployments: USA
Expected smart meter deployment by US state in 2015
• >50m smart meters deployed in the U.S as of end 2014.
• 30 of the largest utilities in the U.S. have fully deployed smart meters
• Several states have implemented policies that allow customers to opt out
• The number of customers that have officially requested to opt-out of a smart meter installation is low (according to IEI 2014 Smart Meter survey)
Source: IEI 2014, VaasaETT Analysis
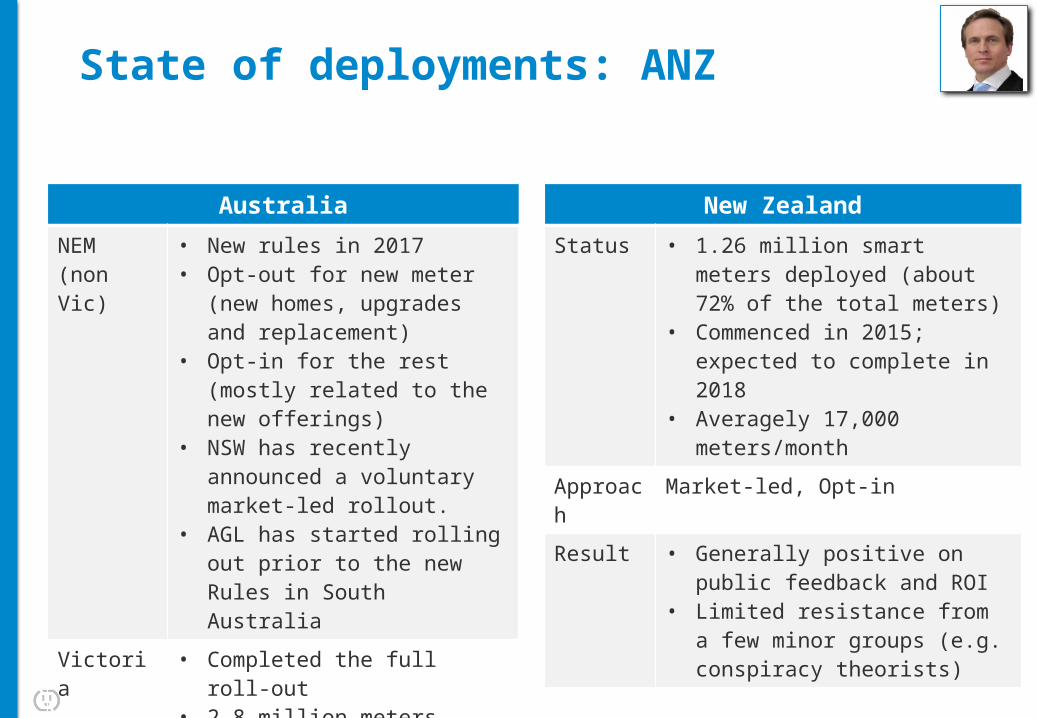
State of deployments: ANZ
AustraliaNEM(non Vic)
• New rules in 2017• Opt-out for new meter (new
homes, upgrades and replacement)
• Opt-in for the rest (mostly related to the new offerings)
• NSW has recently announced a voluntary market-led rollout.
• AGL has started rolling out prior to the new Rules in South Australia
Victoria • Completed the full roll-out• 2.8 million meters installed• Mandated roll-out
Result Very negative in VIC, Negative elsewhere so far
New ZealandStatus • 1.26 million smart meters deployed
(about 72% of the total meters)• Commenced in 2015; expected to
complete in 2018• Averagely 17,000 meters/month
Approach Market-led, Opt-inResult • Generally positive on public
feedback and ROI• Limited resistance from a few minor
groups (e.g. conspiracy theorists)
Audience Question #1
In your view, which area will see the most significant value from current and future smart meter deployments in Australia and New Zealand?
1. Customer-driven value added services2. Demand side management3. Operational savings and grid reliability4. Integration of renewables & distributed generation

Today’s topics
1 | State of deployments: Globally and ANZ
2 | Smart meter engagement: Learnings
3 | Smart meter engagement: A framework
4 | Putting it all together: A blueprint for success
5 | Visions for Customer Engagement in the Utility Industry
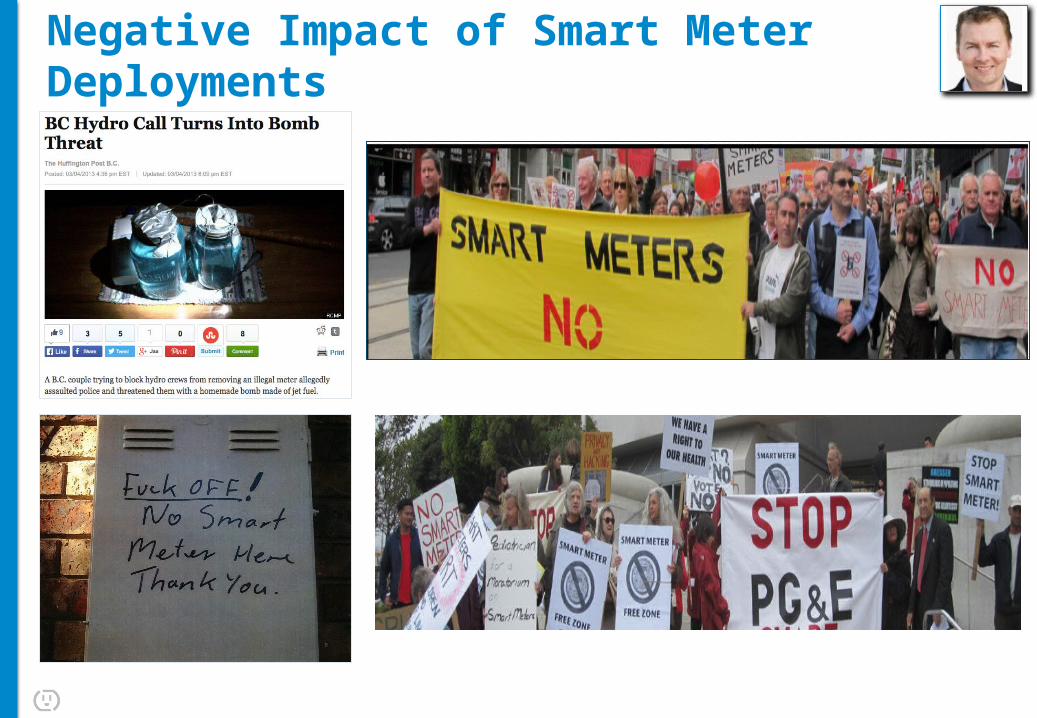
Negative Impact of Smart Meter Deployments
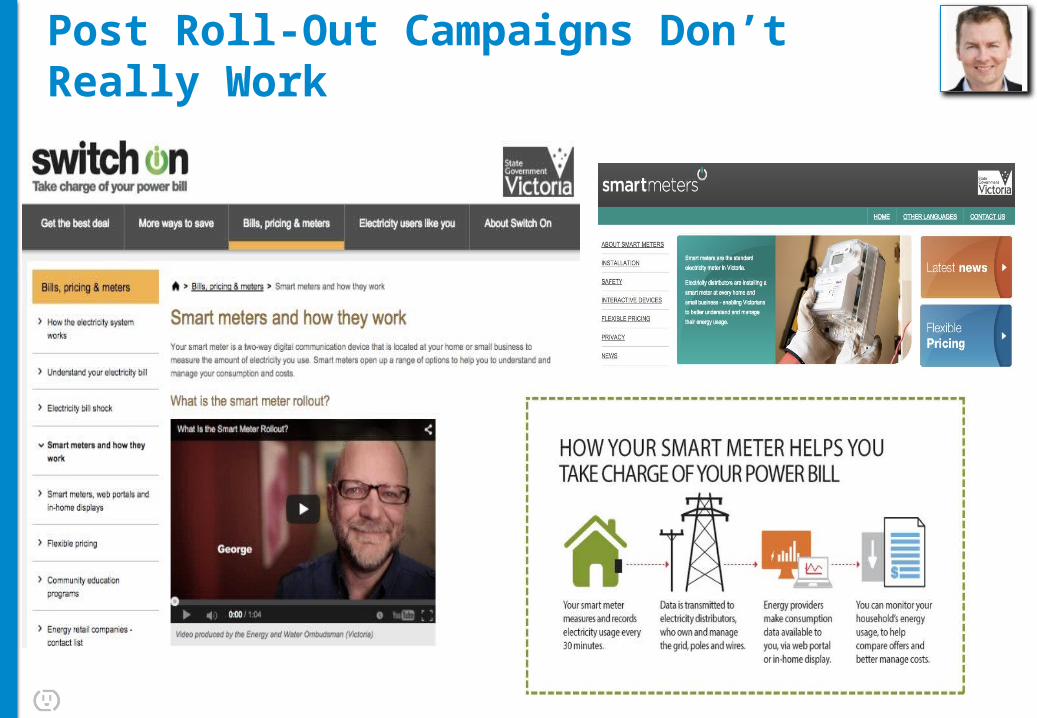
Post Roll-Out Campaigns Don’t Really Work
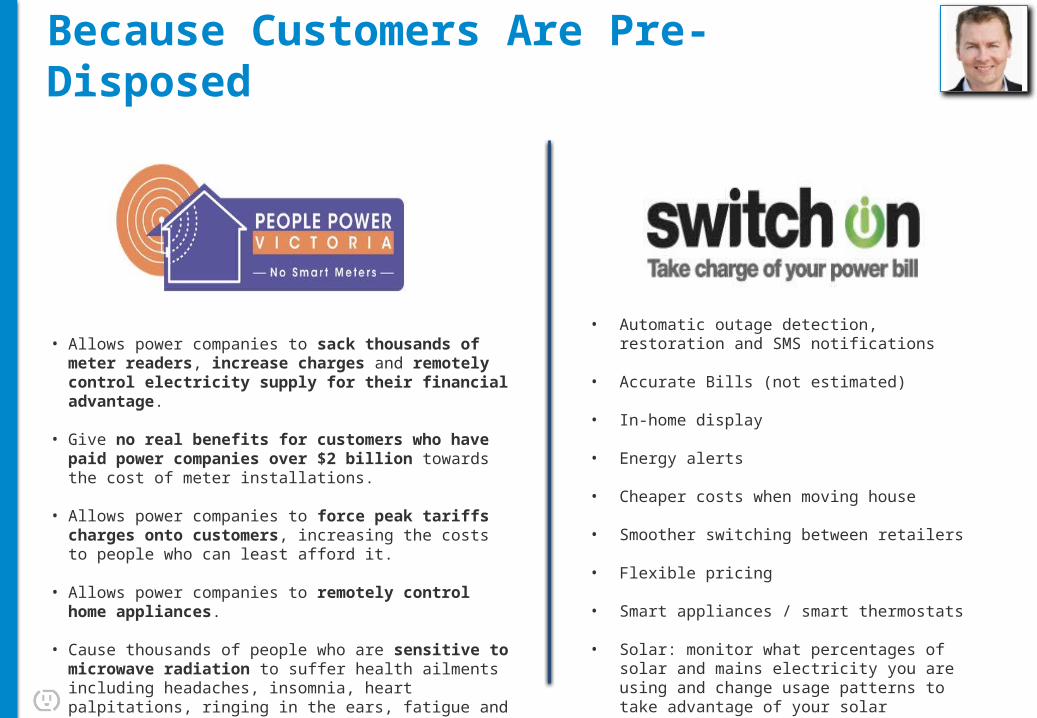
Because Customers Are Pre-Disposed
• Automatic outage detection, restoration and SMS notifications
• Accurate Bills (not estimated)
• In-home display
• Energy alerts
• Cheaper costs when moving house
• Smoother switching between retailers
• Flexible pricing
• Smart appliances / smart thermostats
• Solar: monitor what percentages of solar and mains electricity you are using and change usage patterns to take advantage of your solar generation.
• Allows power companies to sack thousands of meter readers, increase charges and remotely control electricity supply for their financial advantage.
• Give no real benefits for customers who have paid power companies over $2 billion towards the cost of meter installations.
• Allows power companies to force peak tariffs charges onto customers, increasing the costs to people who can least afford it.
• Allows power companies to remotely control home appliances.
• Cause thousands of people who are sensitive to microwave radiation to suffer health ailments including headaches, insomnia, heart palpitations, ringing in the ears, fatigue and other health issues.
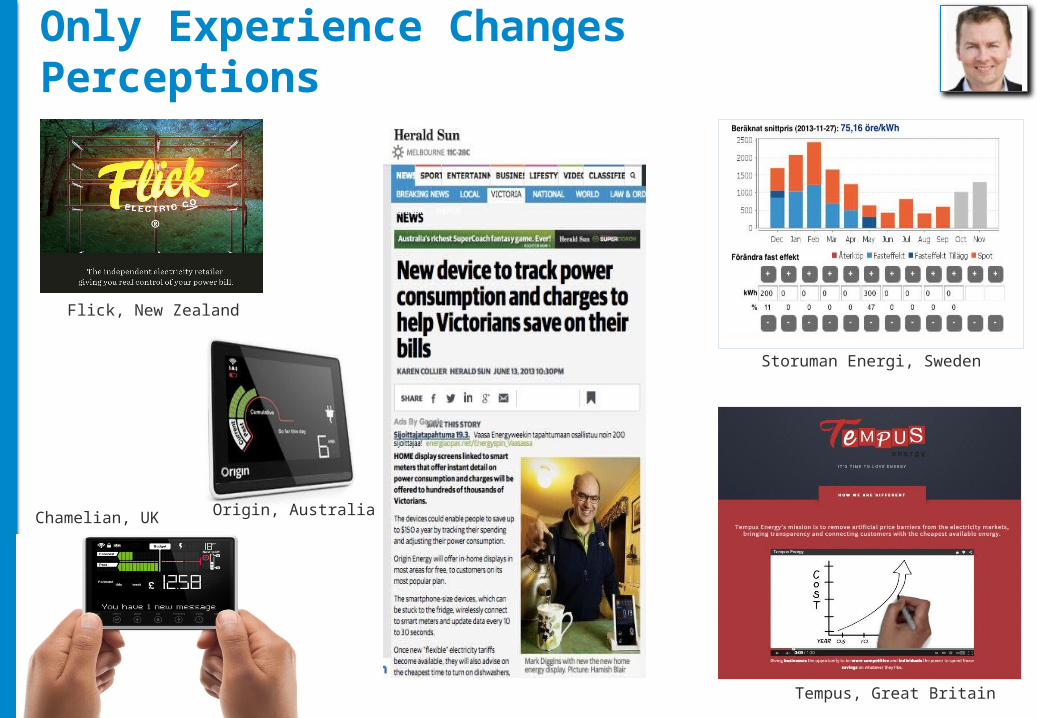
Only Experience Changes Perceptions
Storuman Energi, Sweden
Flick, New Zealand
Tempus, Great Britain
Origin, AustraliaChamelian, UK
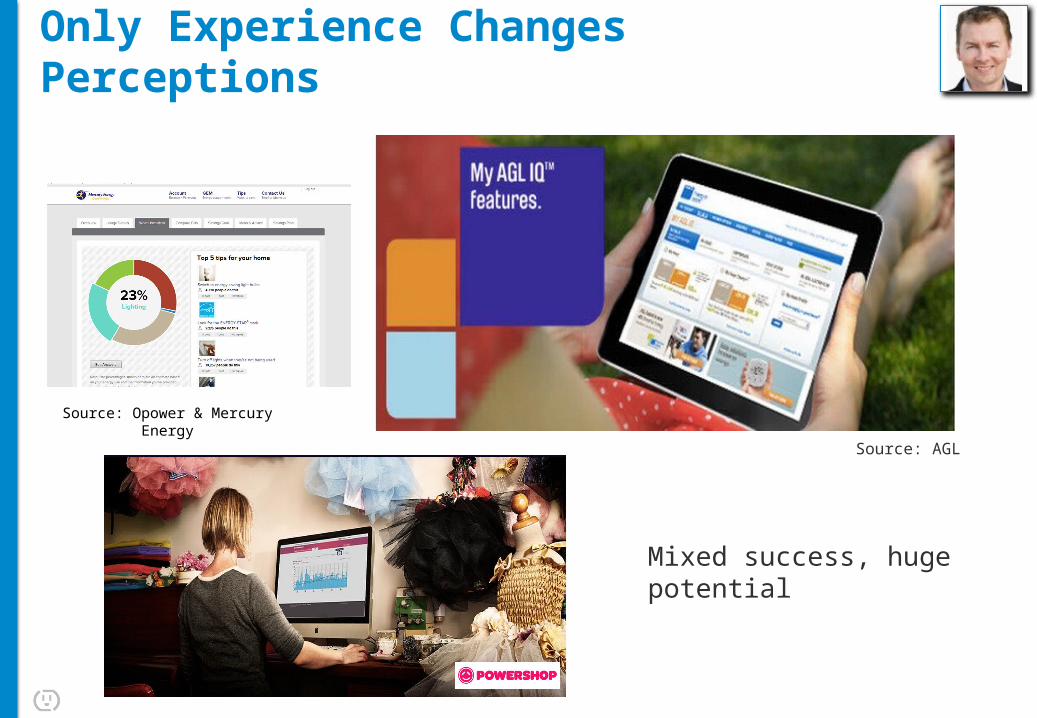
Only Experience Changes Perceptions
Source: AGL
Source: Opower & Mercury Energy
Mixed success, huge potential
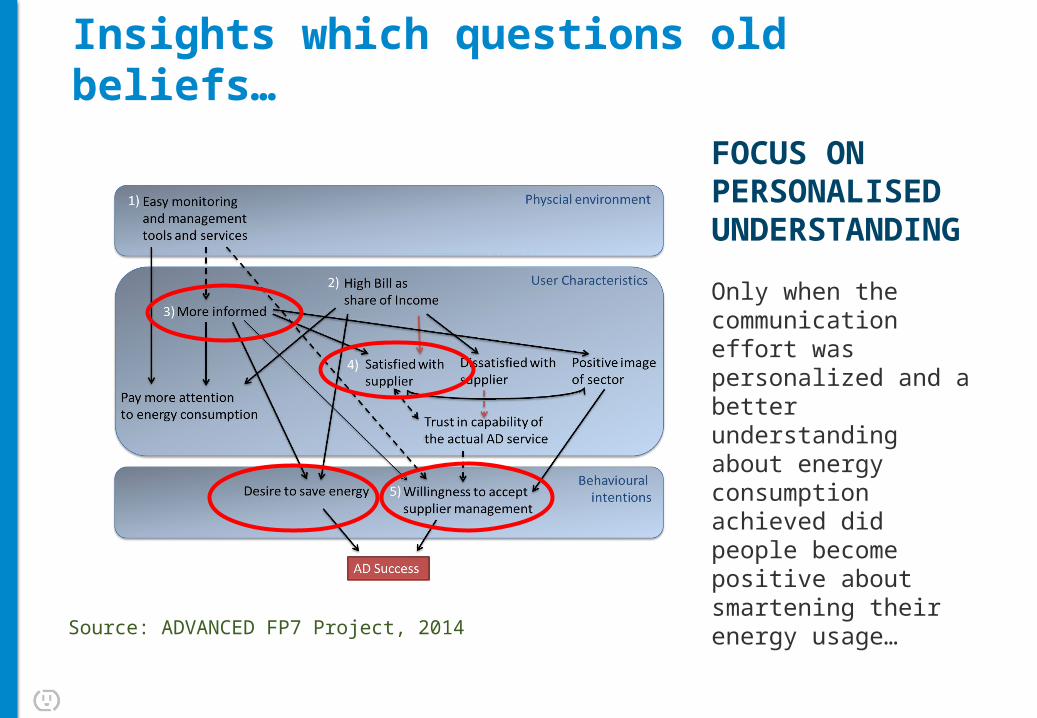
Source: ADVANCED FP7 Project, 2014
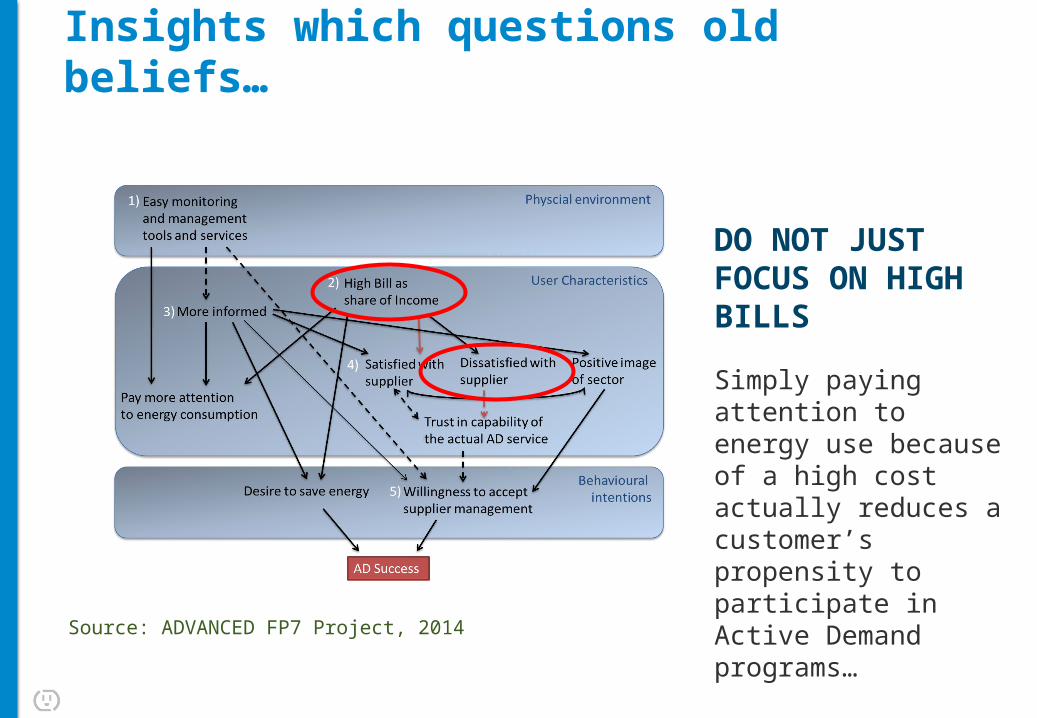
Insights which questions old beliefs…
DO NOT JUST FOCUS ON HIGH BILLS
Simply paying attention to energy use because of a high cost actually reduces a customer’s propensity to participate in Active Demand programs…
Source: ADVANCED FP7 Project, 2014
Insights which questions old beliefs…
FOCUS ON PERSONALISED UNDERSTANDING
Only when the communication effort was personalized and a better understanding about energy consumption achieved did people become positive about smartening their energy usage…

Insights: What Works?
1. Segmentation 2. Harvesting data3. Communication
a) Simpleb) Linked to behaviourc) Not primarily about savingsd) Not primarily about being greene) But by taking the customer’s concerns seriouslyf) Non-stop journeyg) Do not promote the smart meter as the benefit but the benefits as the smart meterh) MAKING IT FUN & Fashionable - Something to shout about
4. Preparation for changes not only within the minds of the customers but also internally in the organizations of your industry
5. Before, during and after smart meter roll-out
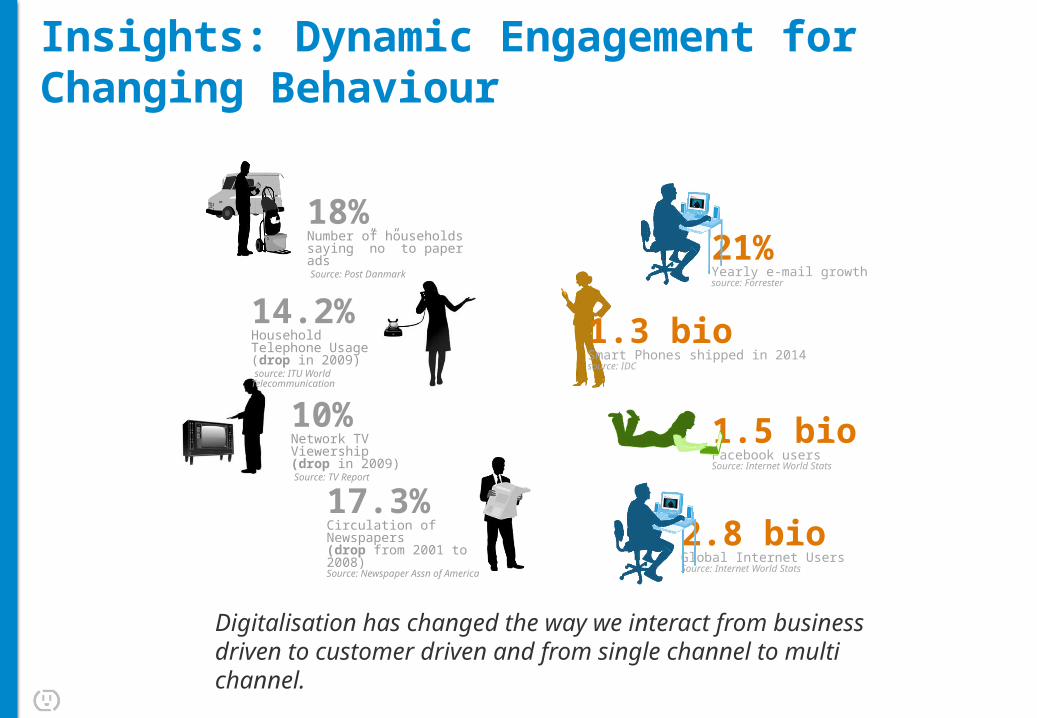
17.3% Circulation of Newspapers(drop from 2001 to 2008)Source: Newspaper Assn of America
18% Number of households saying ”no” to paper ads Source: Post Danmark
10%Network TV Viewership(drop in 2009) Source: TV Report
14.2%Household Telephone Usage (drop in 2009) source: ITU World Telecommunication
21%Yearly e-mail growthsource: Forrester
1.3 bio Smart Phones shipped in 2014source: IDC
2.8 bioGlobal Internet UsersSource: Internet World Stats
1.5 bioFacebook usersSource: Internet World Stats
Insights: Dynamic Engagement for Changing Behaviour
Digitalisation has changed the way we interact from business driven to customer driven and from single channel to multi channel.
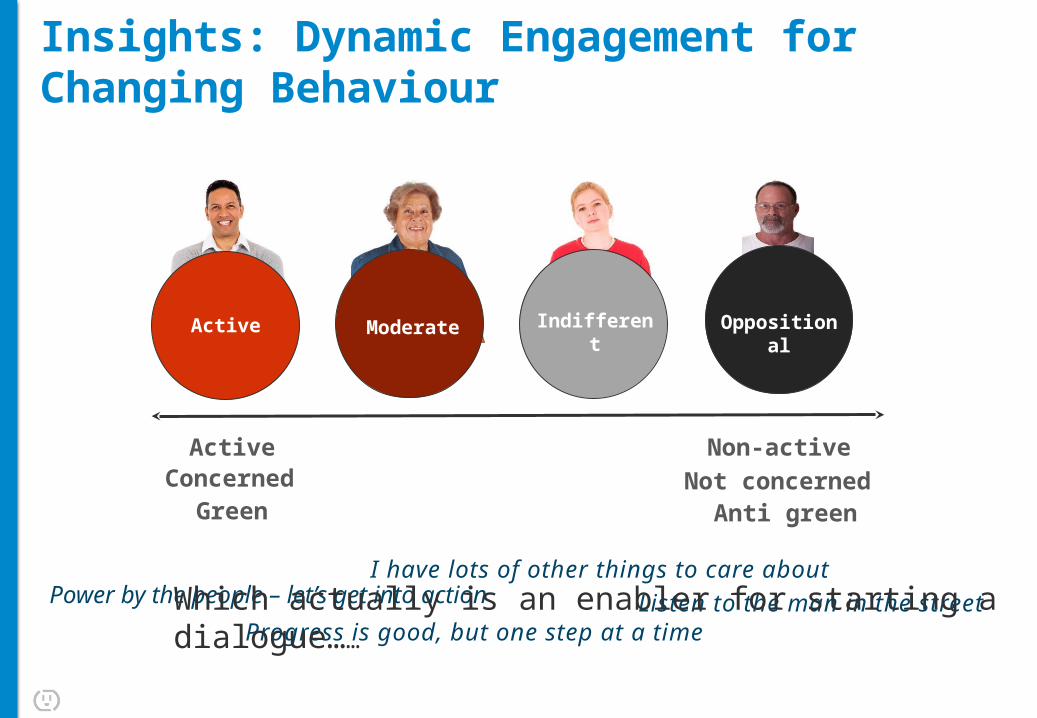
Non-activeActive
IndifferentActive OppositionalModerate
ConcernedGreen
Not concernedAnti green
Listen to the man in the street I have lots of other things to care about
Progress is good, but one step at a timePower by the people – let’s get into actionWhich actually is an enabler for starting a dialogue……
Insights: Dynamic Engagement for Changing Behaviour
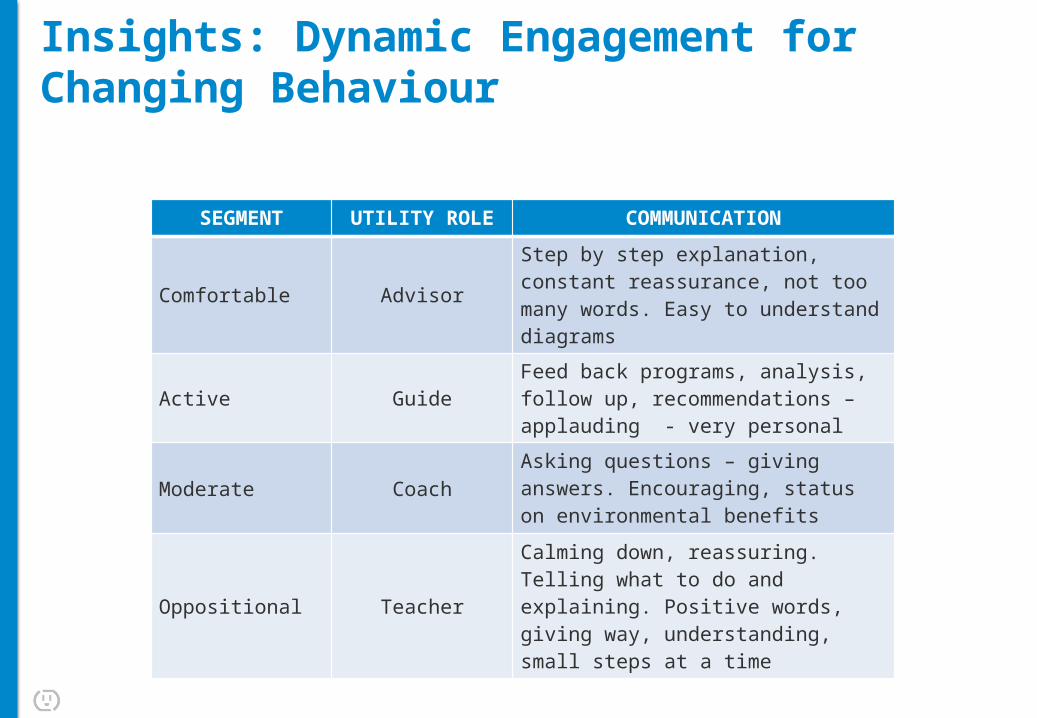
SEGMENT UTILITY ROLE COMMUNICATION
Comfortable Advisor
Step by step explanation, constant reassurance, not too many words. Easy to understand diagrams
Active GuideFeed back programs, analysis, follow up, recommendations – applauding - very personal
Moderate Coach
Asking questions – giving answers. Encouraging, status on environmental benefits
Oppositional Teacher
Calming down, reassuring. Telling what to do and explaining. Positive words, giving way, understanding, small steps at a time
Insights: Dynamic Engagement for Changing Behaviour
1 | State of deployments: Globally and ANZ
2 | Why smart meter engagement?
3 | Smart meter engagement: A framework
4 | Putting it all together: A blueprint for success
5 | Visions for Customer Engagement in the Utility Industry
Today’s topics
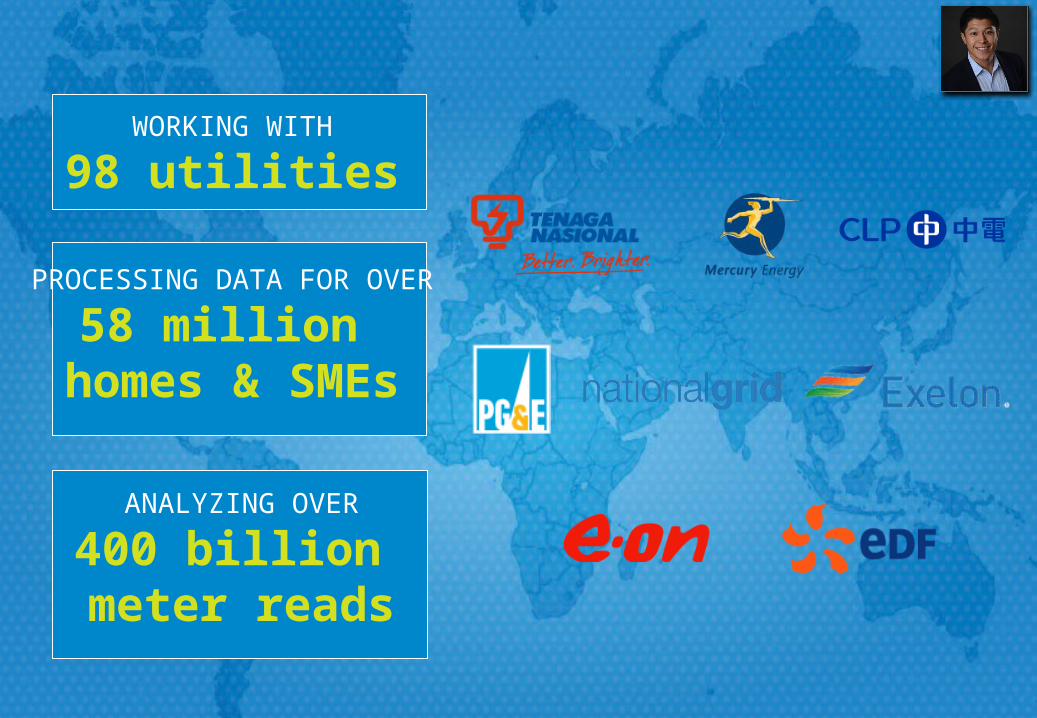
WORKING WITH
98 utilities
PROCESSING DATA FOR OVER
58 million homes & SMEs
ANALYZING OVER
400 billion meter reads
Continuous value creation
Post-installation engagement
Roll-outcampaign
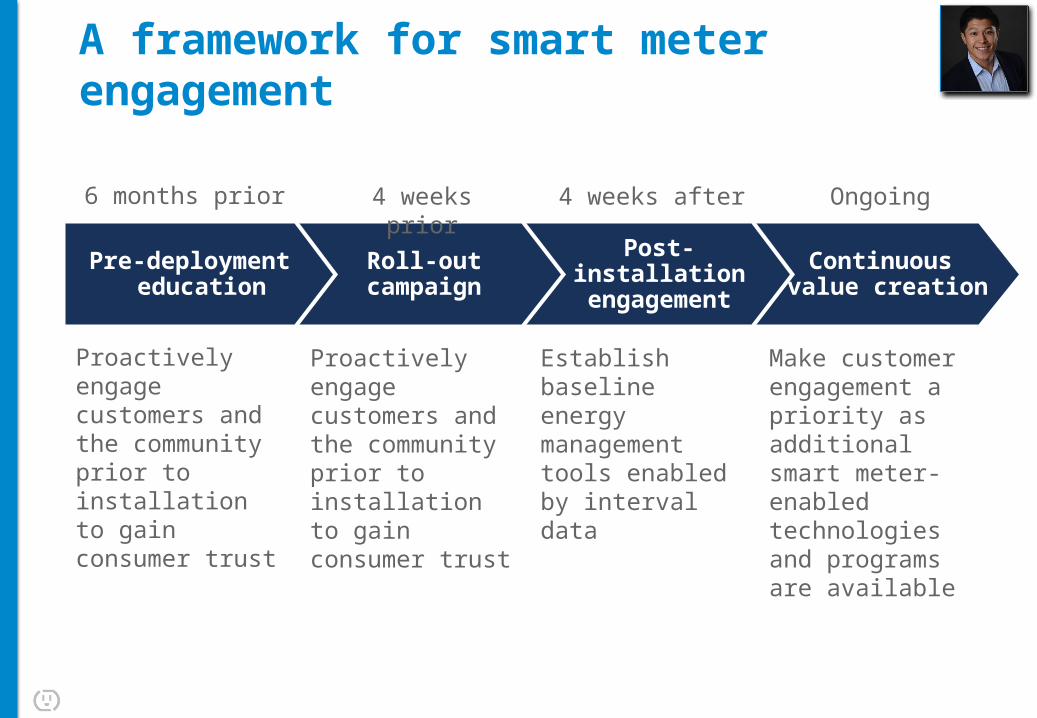
A framework for smart meter engagement
Pre-deployment education
Proactively engage customers and the community prior to installation to gain consumer trust
Proactively engage customers and the community prior to installation to gain consumer trust
Establish baseline energy management tools enabled by interval data
Make customer engagement a priority as additional smart meter-enabled technologies and programs are available
6 months prior 4 weeks prior 4 weeks after Ongoing
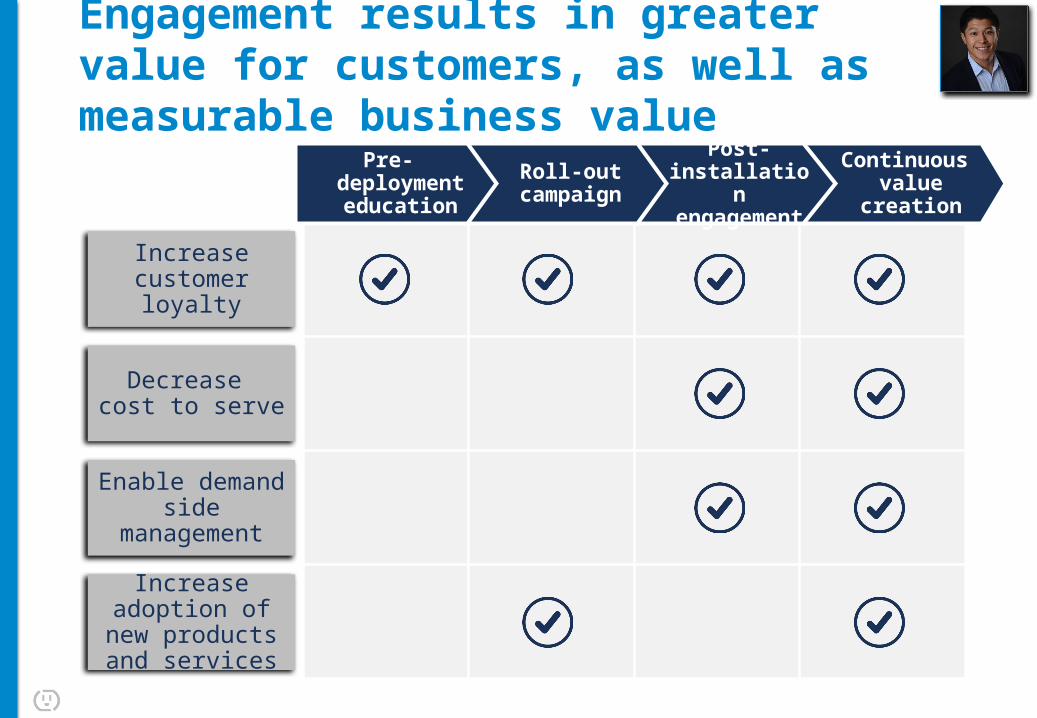
Engagement results in greater value for customers, as well as measurable business value
Increase customer loyalty
Decrease cost to serve
Enable demand side management
Increase adoption of new products
and services
Continuous value creation
Post-installation
engagement
Roll-outcampaign
Pre-deployment education
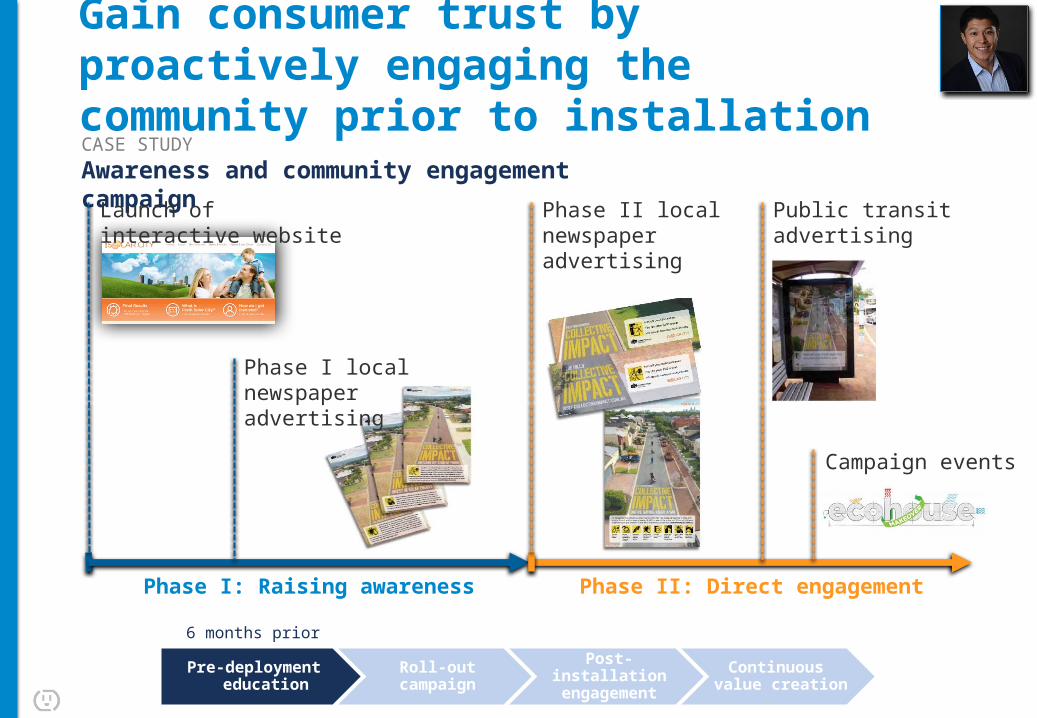
Gain consumer trust by proactively engaging the community prior to installation
Continuous value creation
Post-installation engagement
Roll-outcampaign
Pre-deployment education
6 months prior
CASE STUDYAwareness and community engagement campaign
Phase I: Raising awareness Phase II: Direct engagement
Launch of interactive website
Phase I local newspaper advertising
Phase II local newspaper advertising
Public transit advertising
Campaign events
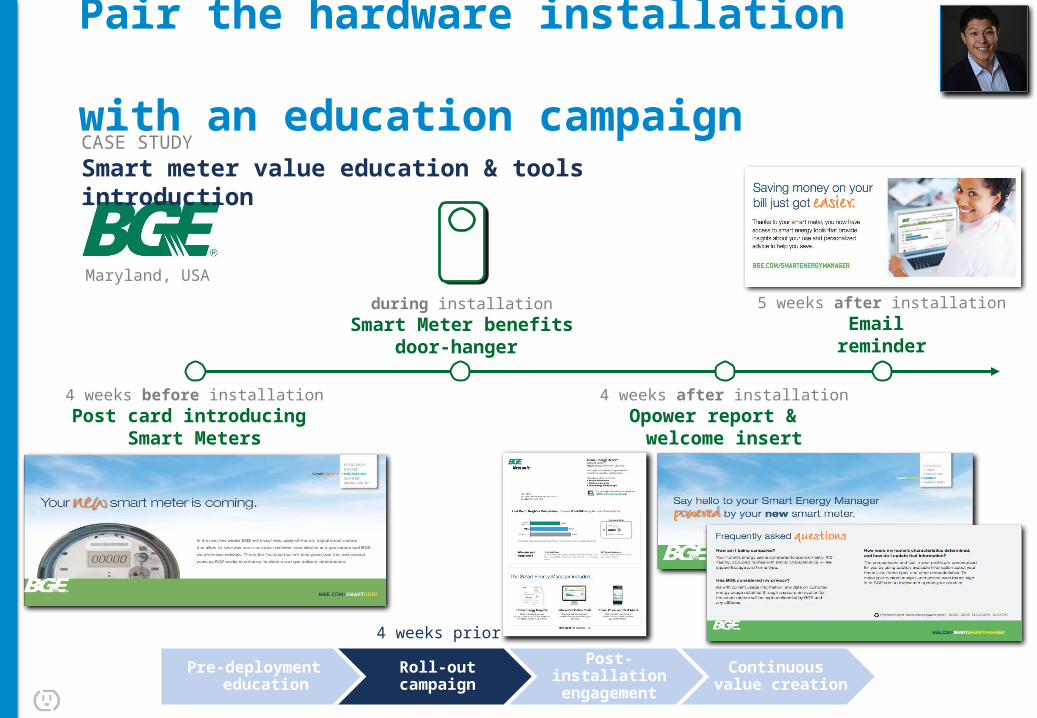
Maryland, USA
Pair the hardware installation with an education campaign
Continuous value creation
Post-installation engagement
Roll-outcampaign
Pre-deployment education
4 weeks prior
CASE STUDYSmart meter value education & tools introduction
4 weeks before installationPost card introducing
Smart Meters
during installationSmart Meter benefits
door-hanger
4 weeks after installationOpower report &
welcome insert
5 weeks after installationEmail
reminder
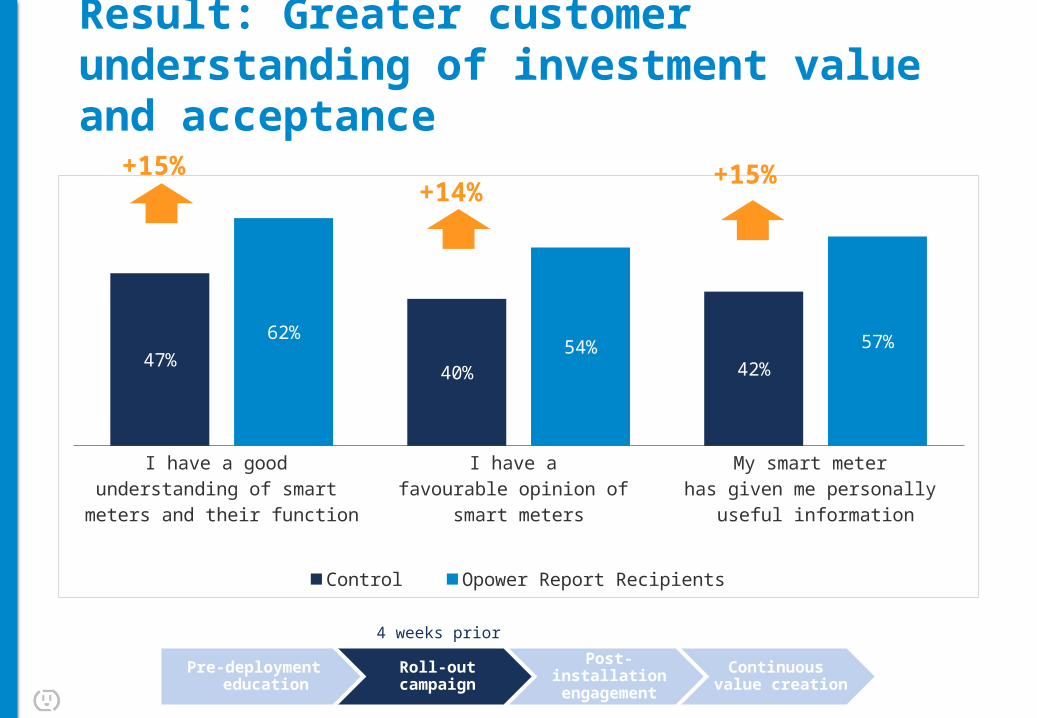
Result: Greater customer understanding of investment value and acceptance
I have a good understanding of smart
meters and their function
I have a favourable opinion of
smart meters
My smart meter has given me personally
useful information
47%40% 42%
62%54% 57%
Control Opower Report Recipients
+15% +14%
Continuous value creation
Post-installation engagement
Roll-outcampaign
Pre-deployment education
4 weeks prior
+15%
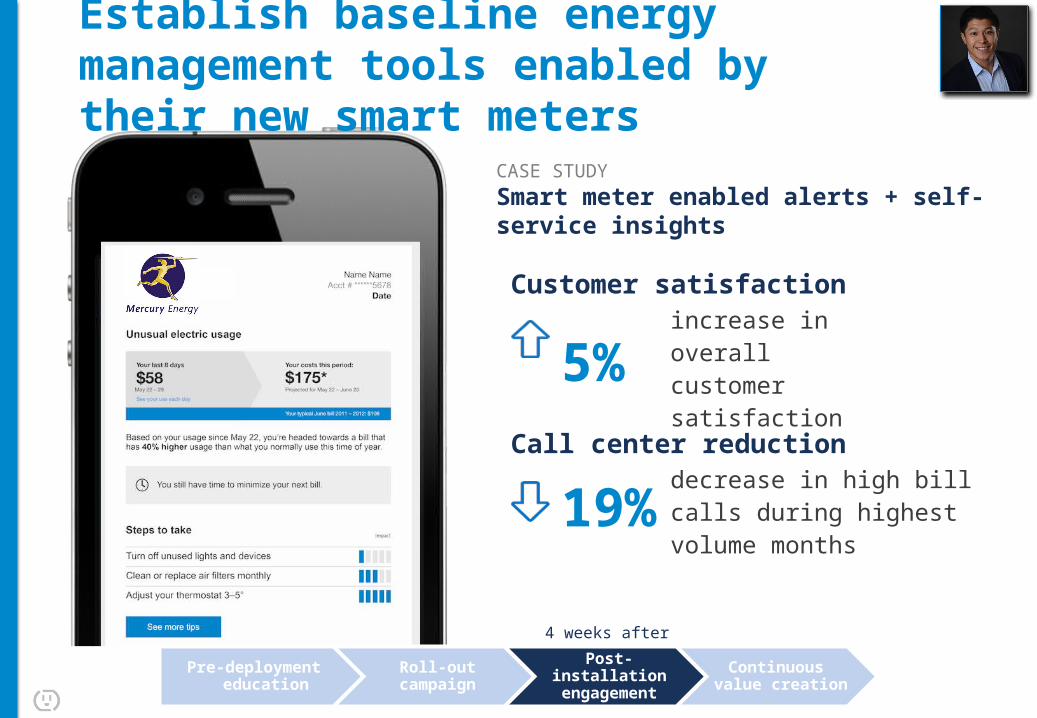
CASE STUDYSmart meter enabled alerts + self-service insights
Establish baseline energy management tools enabled by their new smart meters
4 weeks after
Continuous value creation
Post-installation engagement
Roll-outcampaign
Pre-deployment education
Customer satisfaction
5% increase in overall customer satisfaction
Call center reduction
19% decrease in high bill calls during highest volume months
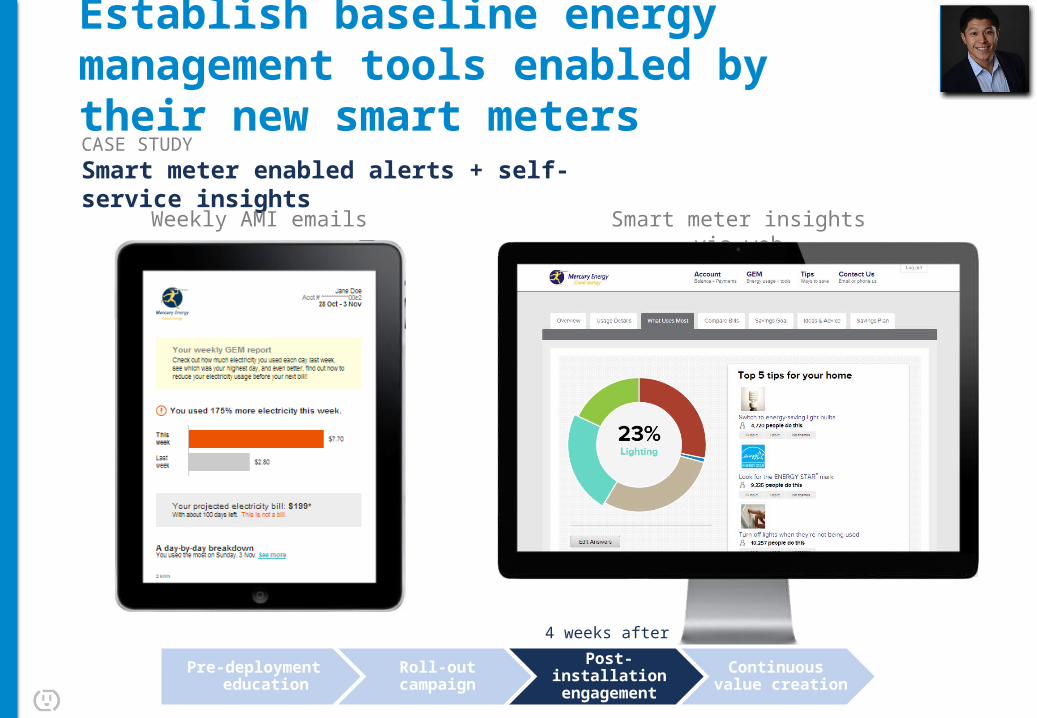
CASE STUDYSmart meter enabled alerts + self-service insights
Weekly AMI emails Smart meter insights via web
Continuous value creation
Post-installation engagement
Roll-outcampaign
Pre-deployment education
4 weeks after
Establish baseline energy management tools enabled by their new smart meters
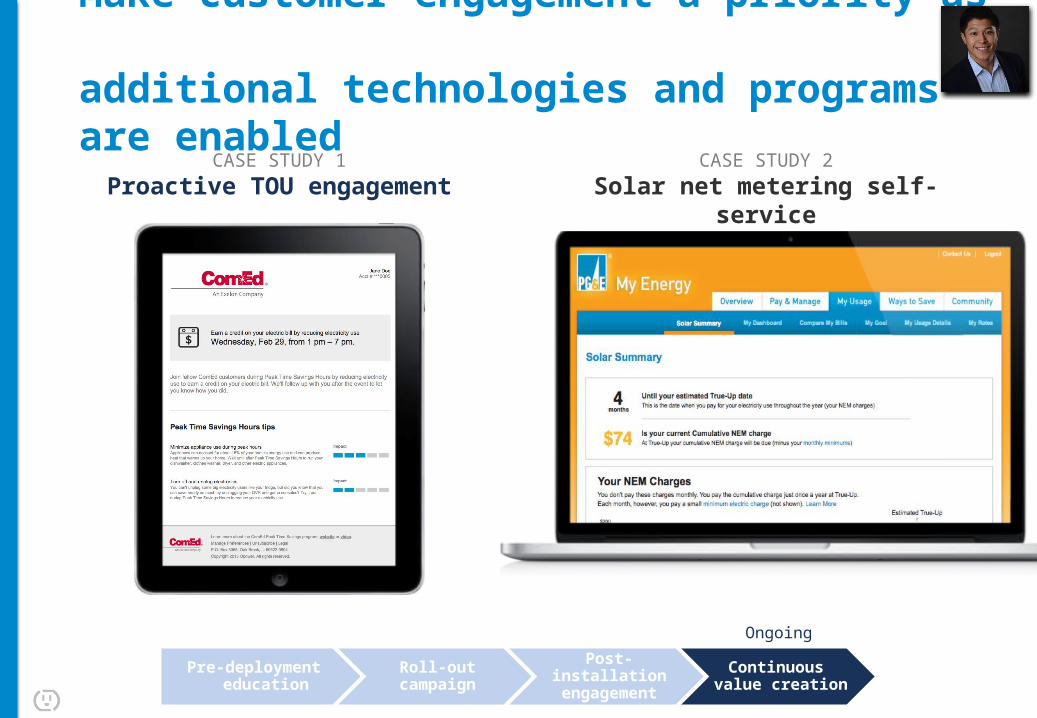
CASE STUDY 1Proactive TOU engagement
Ongoing
Continuous value creation
Post-installation engagement
Roll-outcampaign
Pre-deployment education
Make customer engagement a priority as additional technologies and programs are enabled
CASE STUDY 2Solar net metering self-service
Audience Question #2
Which of the four stages are the most important for your business in the next 2 years?
1. Pre-deployment education2. Rollout campaign3. Post-installation engagement4. Continuous value creation
1 | State of deployments: Globally and ANZ
2 | Why smart meter engagement?
3 | Smart meter engagement: A framework
4 | Putting it all together: A blueprint for success
5 | Visions for Customer Engagement in the Utility Industry
Today’s topics
Three requirements for a successful deployment
Qualify the business case for a smart meter deployment1
2 Establish the underlying technology platform
3 Execute on the smart meter engagement framework
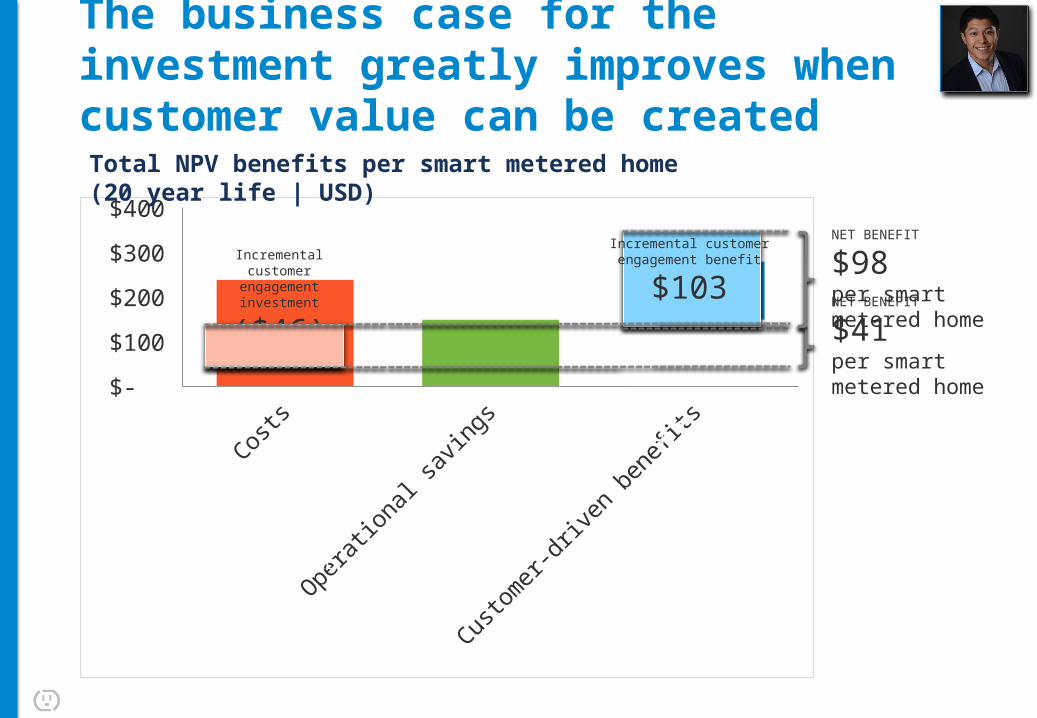
The business case for the investment greatly improves when customer value can be created
Costs
Operational
savings
Customer-d
riven benefits
$- $50
$100 $150 $200 $250 $300 $350 $400
Total NPV benefits per smart metered home (20 year life | USD)
Incremental customer engagement investment
($46)
Technology + installation
($237) $148
$130
Incremental customer engagement benefit
$103 NET BENEFIT
$41 per smart metered home
NET BENEFIT
$98per smart metered home
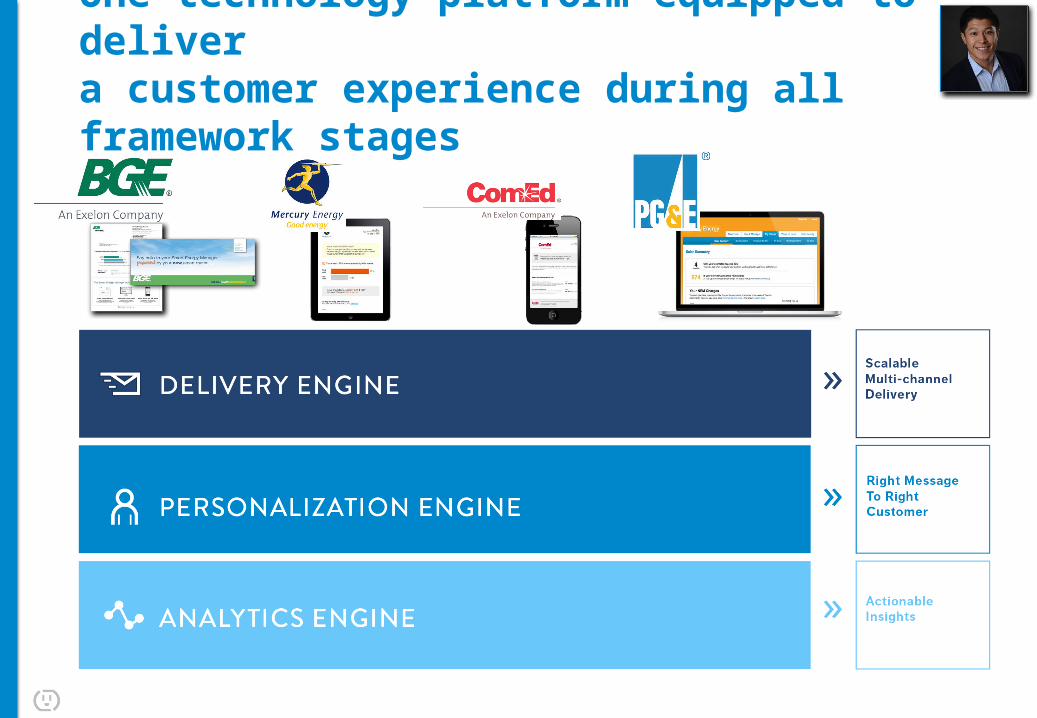
One technology platform equipped to delivera customer experience during all framework stages
Today’s topics
1 | State of deployments: Globally and ANZ
2 | Smart meter engagement – Reasons and Realities
3 | Smart meter engagement: A framework
4 | Putting it all together: A blueprint for success
5 | Visions for Customer Engagement in the Utility Industry
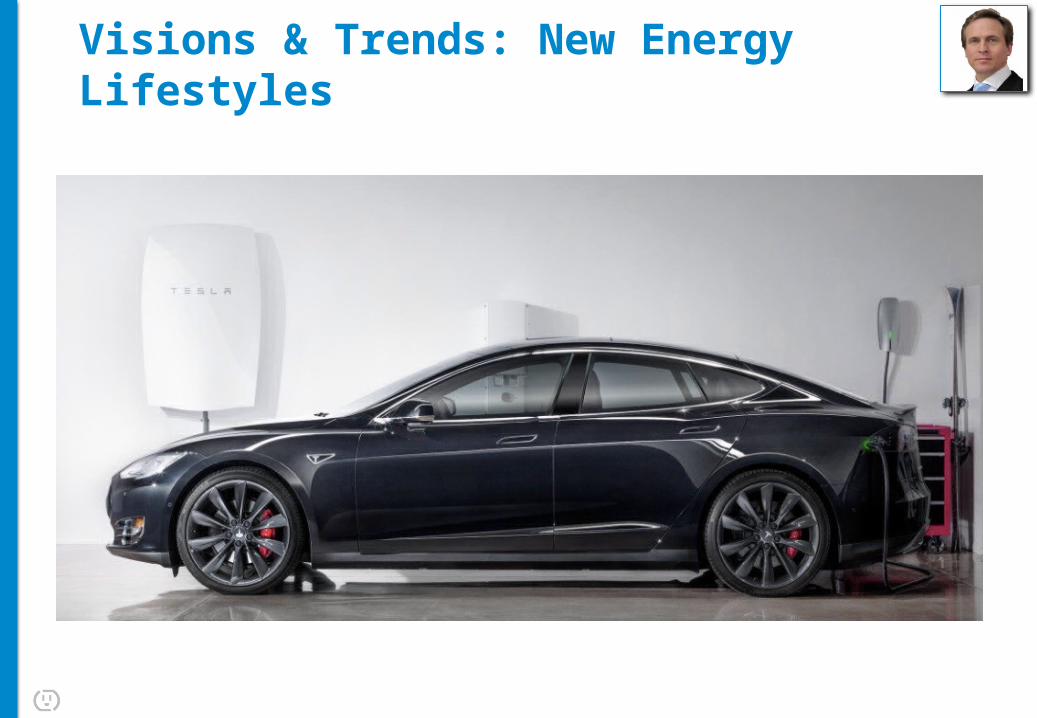
Visions & Trends: New Energy Lifestyles
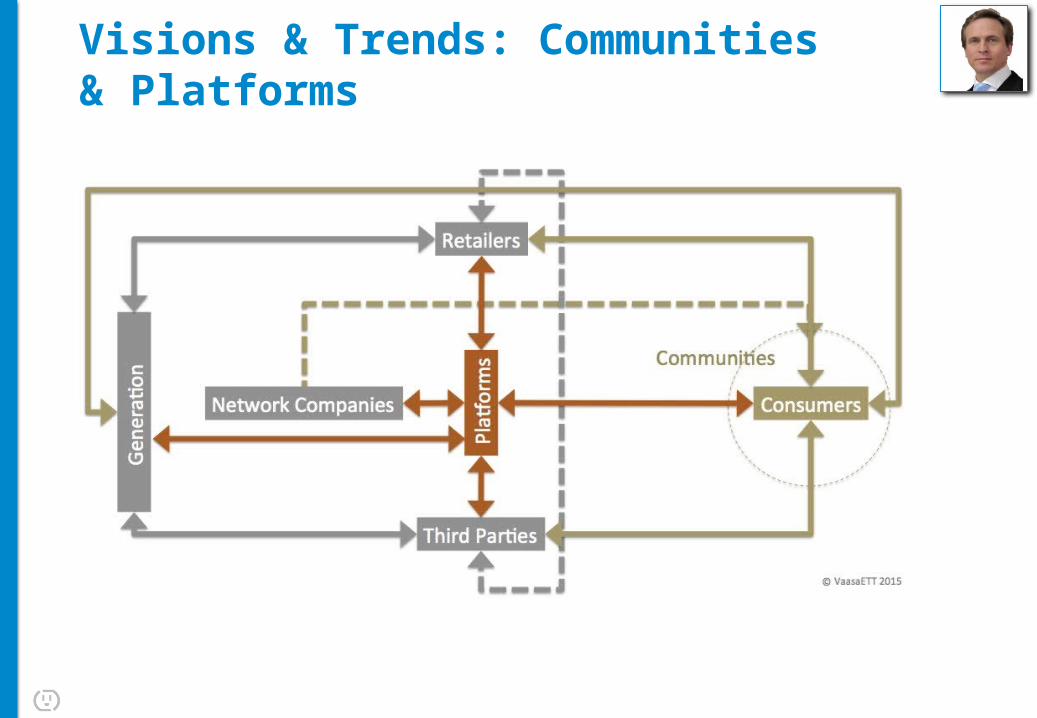
Visions & Trends: Communities & Platforms
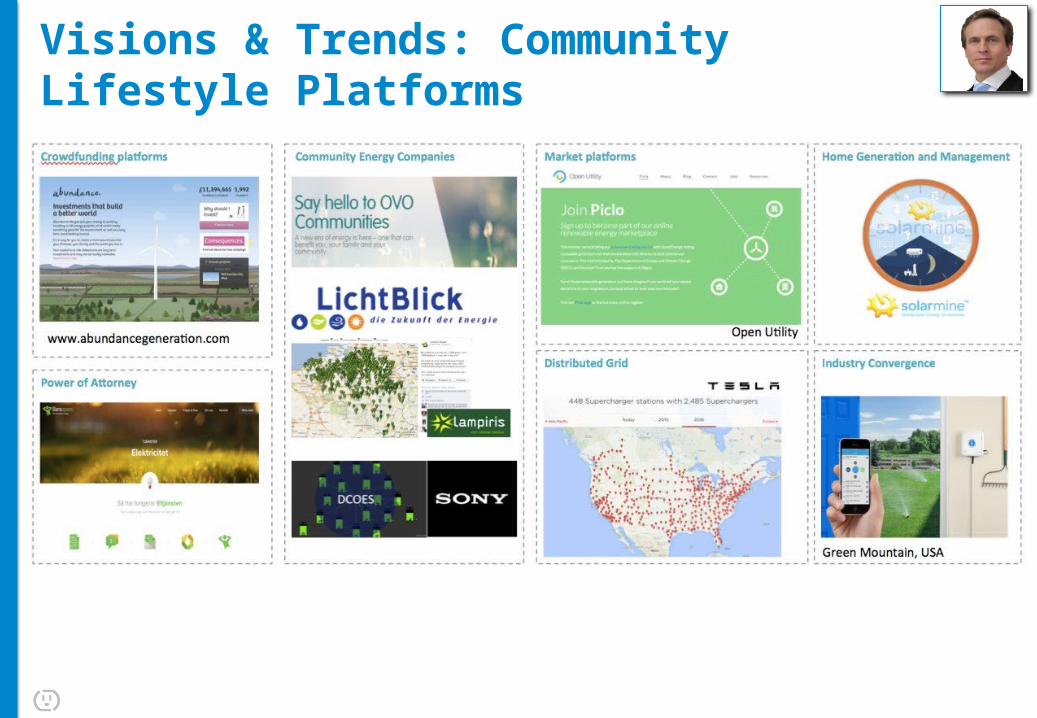
Visions & Trends: Community Lifestyle Platforms
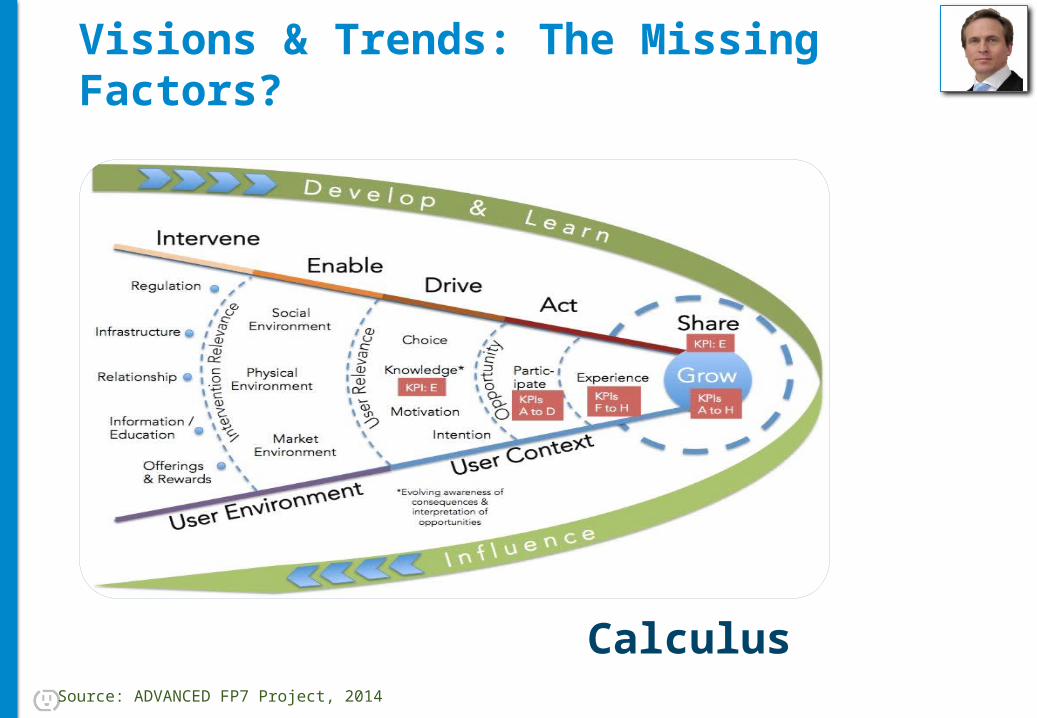
Visions & Trends: The Missing Factors?
Source: ADVANCED FP7 Project, 2014
Calculus
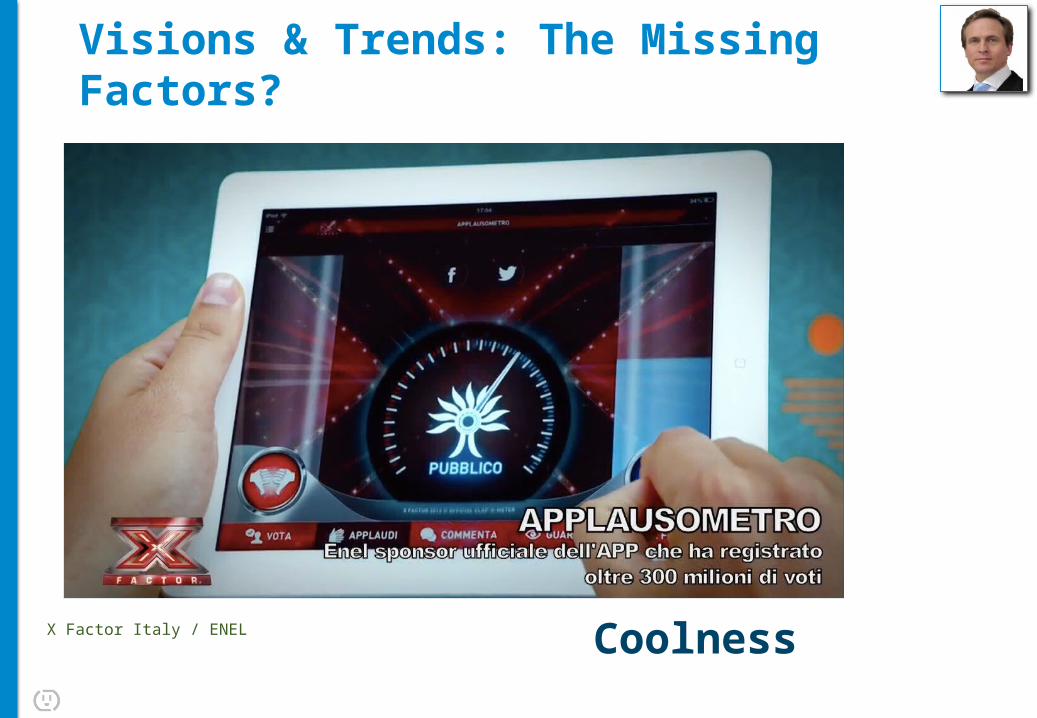
Visions & Trends: The Missing Factors?
X Factor Italy / ENEL Coolness
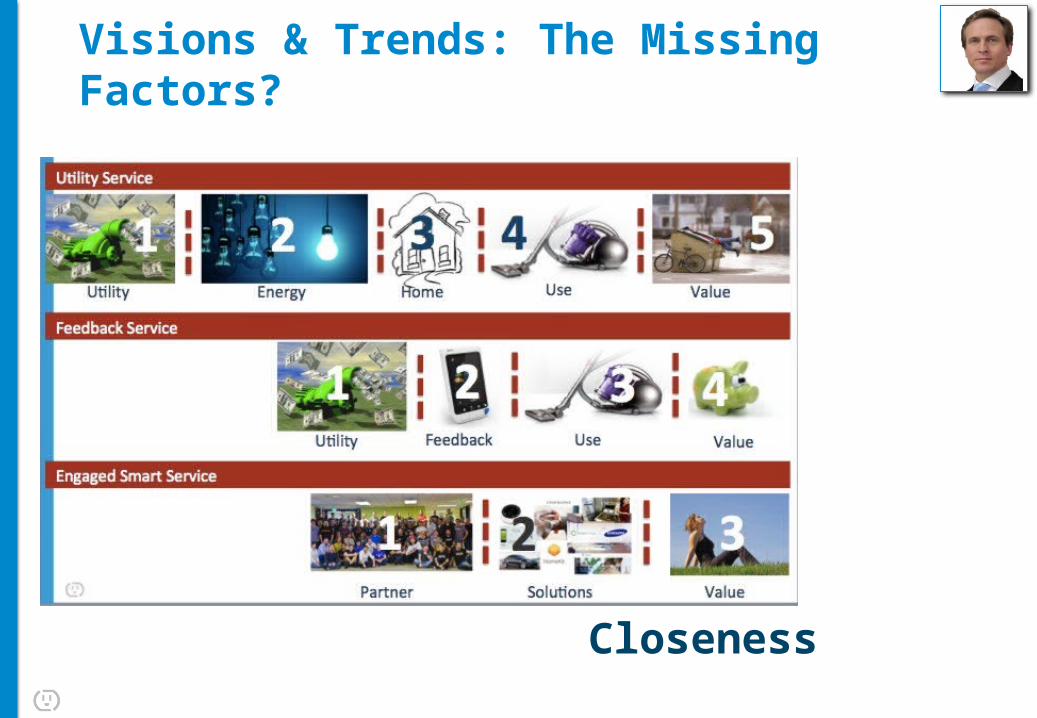
Visions & Trends: The Missing Factors?
Closeness

Thank you.