Embed Size (px)
Citation preview

Pseudo Haptic in Augmented Reality Environment
Based on Touch Screen
Chien-Hsu, Chen / Ya-Hsin, Horng / Fong-Gong, Wu
National Cheng-kung University, Industrial Design department
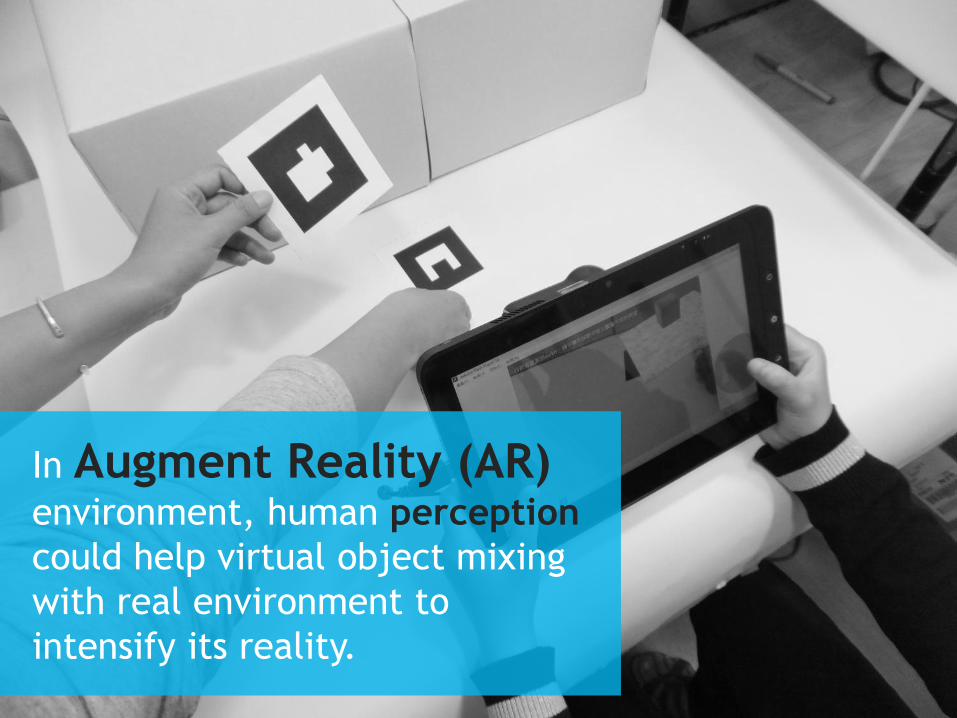
In Augment Reality (AR) environment, human perception
could help virtual object mixing
with real environment to
intensify its reality.
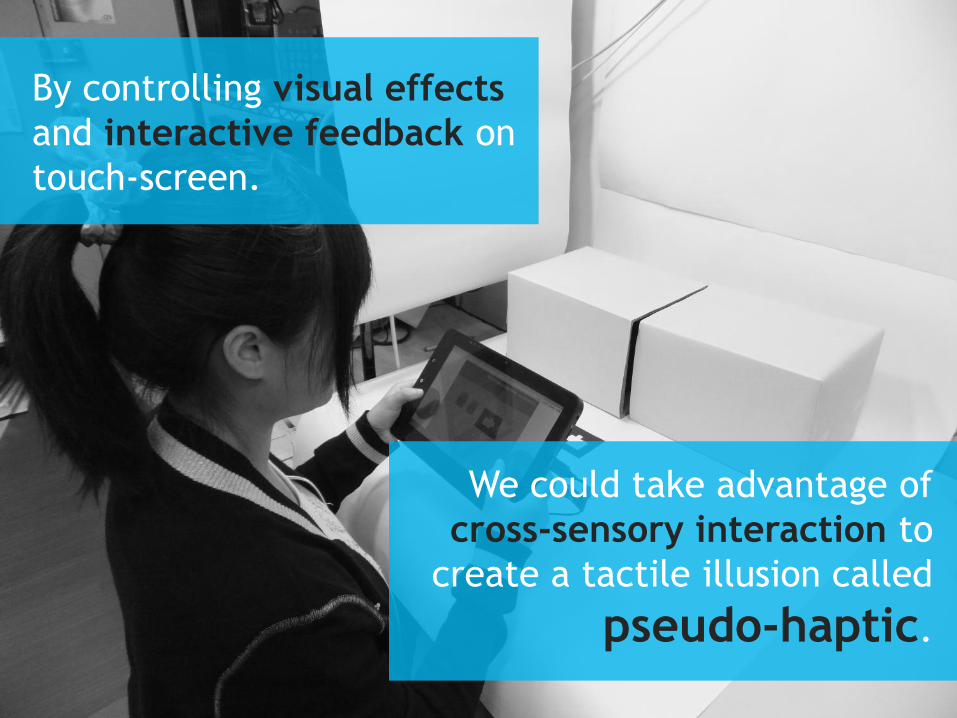
By controlling visual effects
and interactive feedback on
touch-screen.
We could take advantage of
cross-sensory interaction to
create a tactile illusion called
pseudo-haptic.
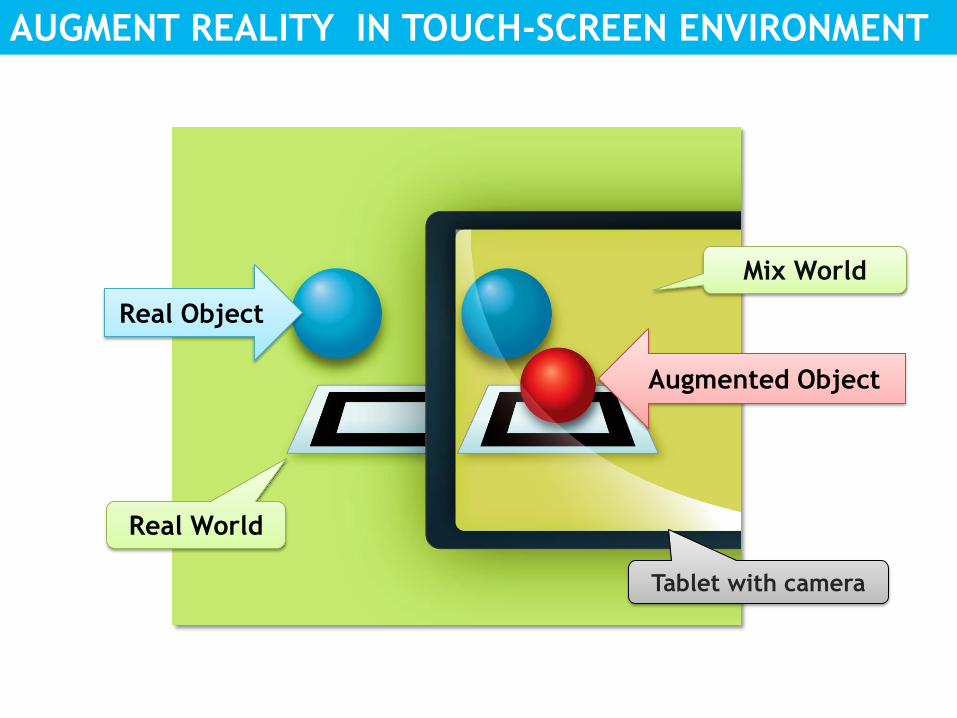
Augmented Object
Real World
Mix World
Tablet with camera
Real Object
AUGMENT REALITY IN TOUCH-SCREEN ENVIRONMENT
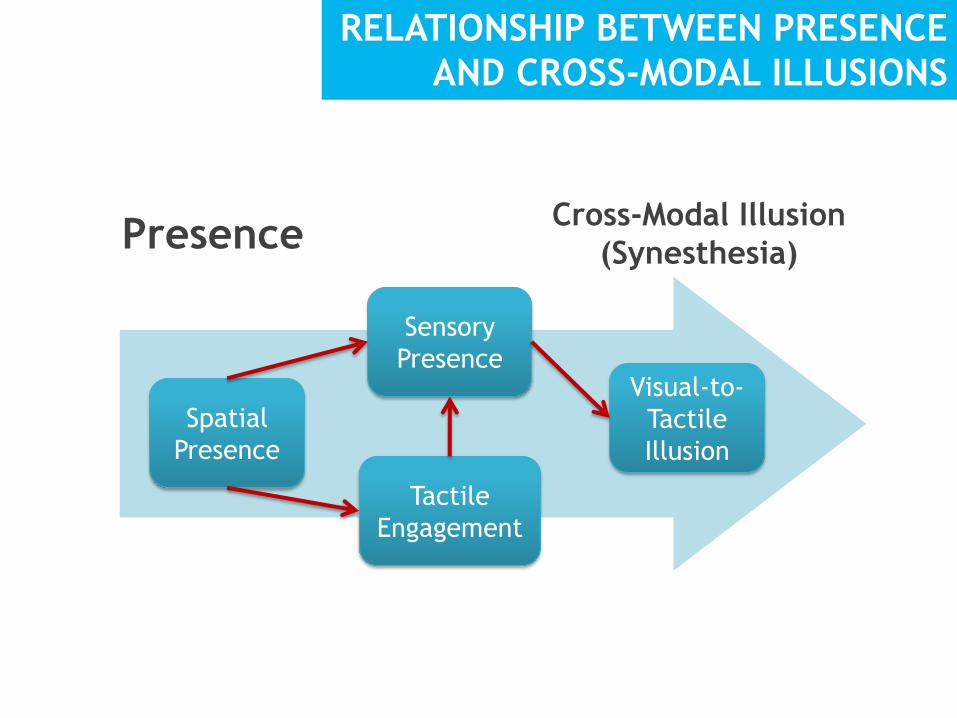
Spatial
Presence
Tactile
Engagement
Sensory
Presence Visual-to-
Tactile
Illusion
Presence Cross-Modal Illusion
(Synesthesia)
RELATIONSHIP BETWEEN PRESENCE
AND CROSS-MODAL ILLUSIONS
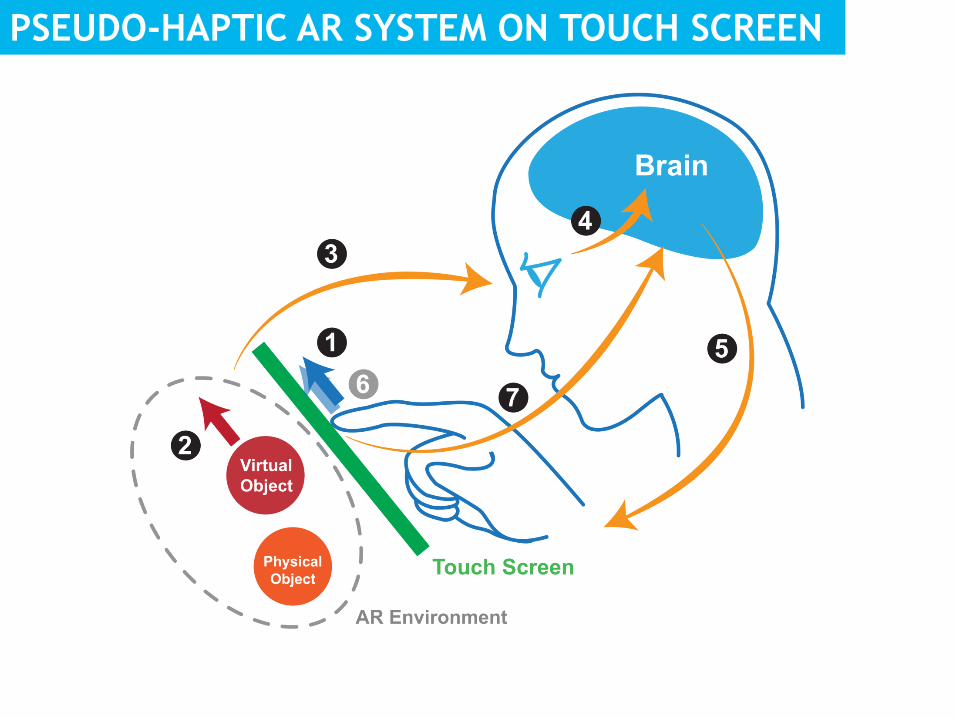
PSEUDO-HAPTIC AR SYSTEM ON TOUCH SCREEN
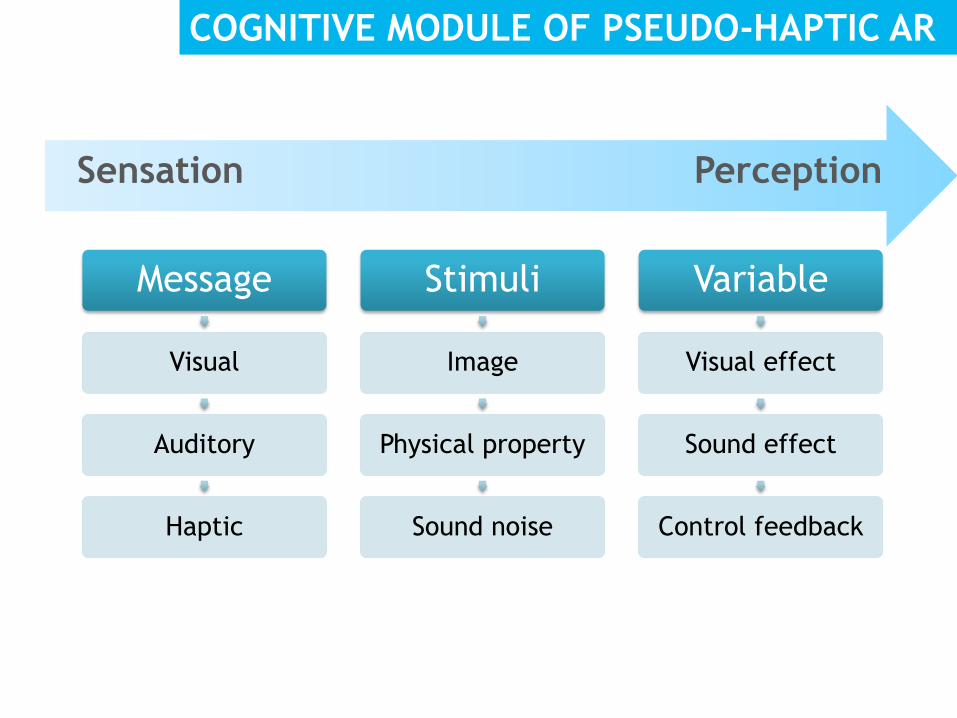
Message
Visual
Auditory
Haptic
Stimuli
Image
Physical property
Sound noise
Variable
Visual effect
Sound effect
Control feedback
Sensation Perception
COGNITIVE MODULE OF PSEUDO-HAPTIC AR

Experiment Control Group (Visual Only )
Experimental Group (Pseudo Haptic)
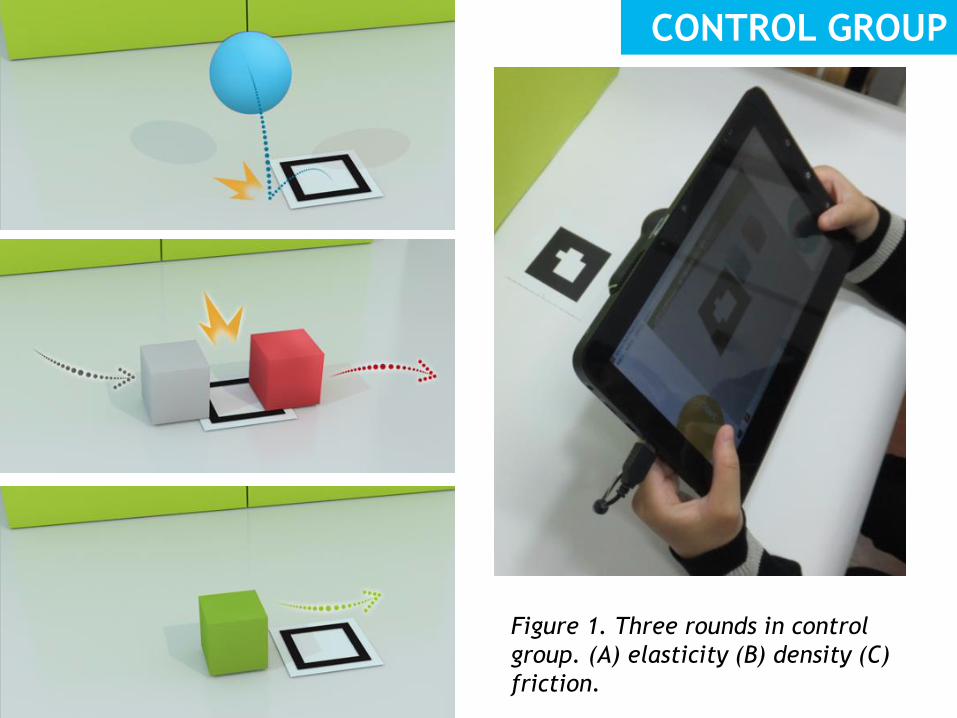
Figure 1. Three rounds in control
group. (A) elasticity (B) density (C)
friction.
CONTROL GROUP
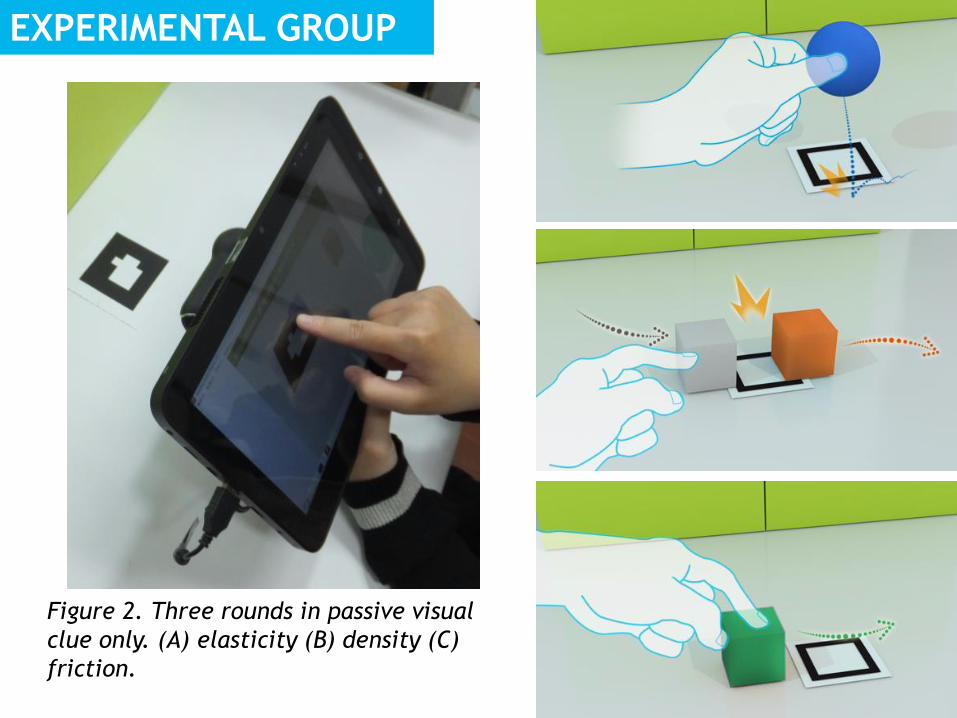
Figure 2. Three rounds in passive visual
clue only. (A) elasticity (B) density (C)
friction.
EXPERIMENTAL GROUP
Result liner regressions
accuracy
volume
LINER REGRESSION
1.187
1.028
1.187
1.133 1.15
1.274
1.084
1.132
1
1.05
1.1
1.15
1.2
1.25
1.3
Elasticity Density Friction All
Slp
oe v
alu
e o
f th
e r
egre
ssio
n
Control Group Experimental Group
0.970 0.698 0.933 0.859
0.974
0.761
0.938
0.874
0.6
0.65
0.7
0.75
0.8
0.85
0.9
0.95
1
Elasticity Density Friction All
R s
quare
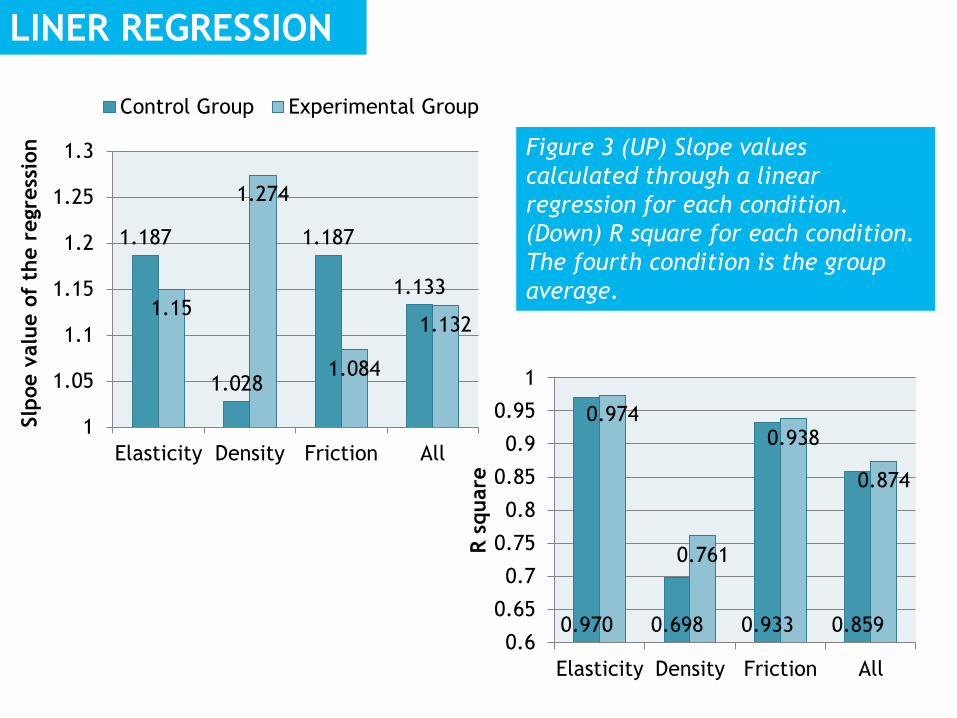
Figure 3 (UP) Slope values
calculated through a linear
regression for each condition.
(Down) R square for each condition.
The fourth condition is the group
average.
PHYSICAL PROPERTY
0
0.2
0.4
0.6
0.8
1
1.2
1 2 3 4 5 1 2 3 4 5 1 2 3 4 5
Devia
tion
Big Middle Small
elastic Density Friction
0
0.2
0.4
0.6
0.8
1
1.2
1 2 3 4 5 1 2 3 4 5 1 2 3 4 5
Devia
tion
Big Middle Small
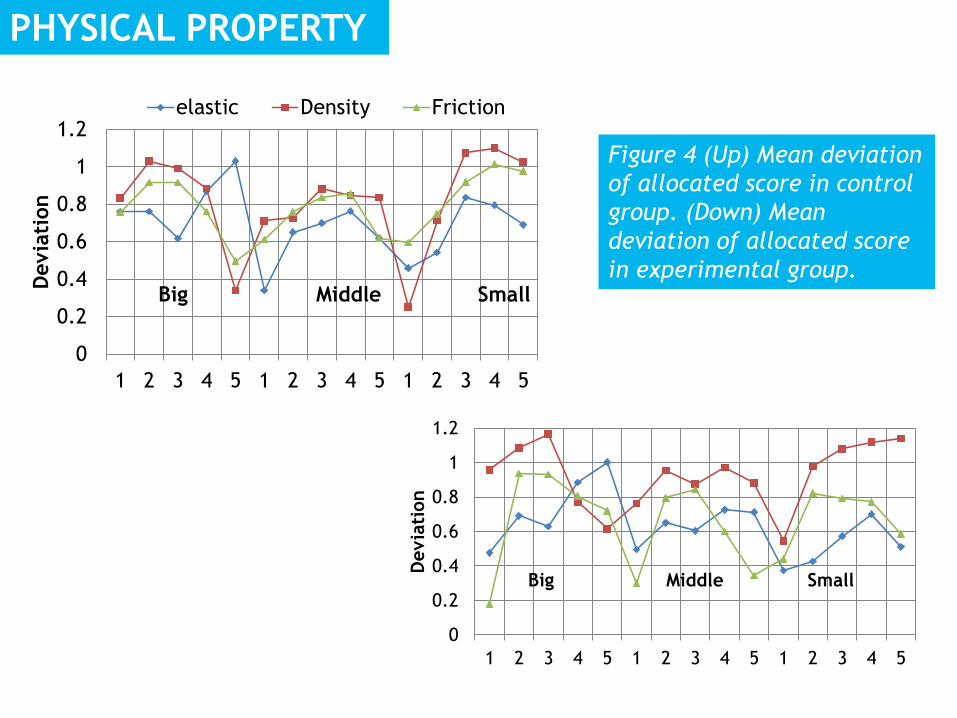
Figure 4 (Up) Mean deviation
of allocated score in control
group. (Down) Mean
deviation of allocated score
in experimental group.
VOLUME
0.925 1.128 0.881
0.684
0.896 0.830
0.702
1.191
0.967
0.4
0.5
0.6
0.7
0.8
0.9
1
1.1
1.2
1.3
1.4
Elasticity Denisty Friction
Devia
tion
Big Middle Small
0.844 1.029 0.758
0.681
1.078
0.793
0.543
1.335
0.839
0.4
0.5
0.6
0.7
0.8
0.9
1
1.1
1.2
1.3
1.4
Elasticity Denisty Friction
Devia
tion
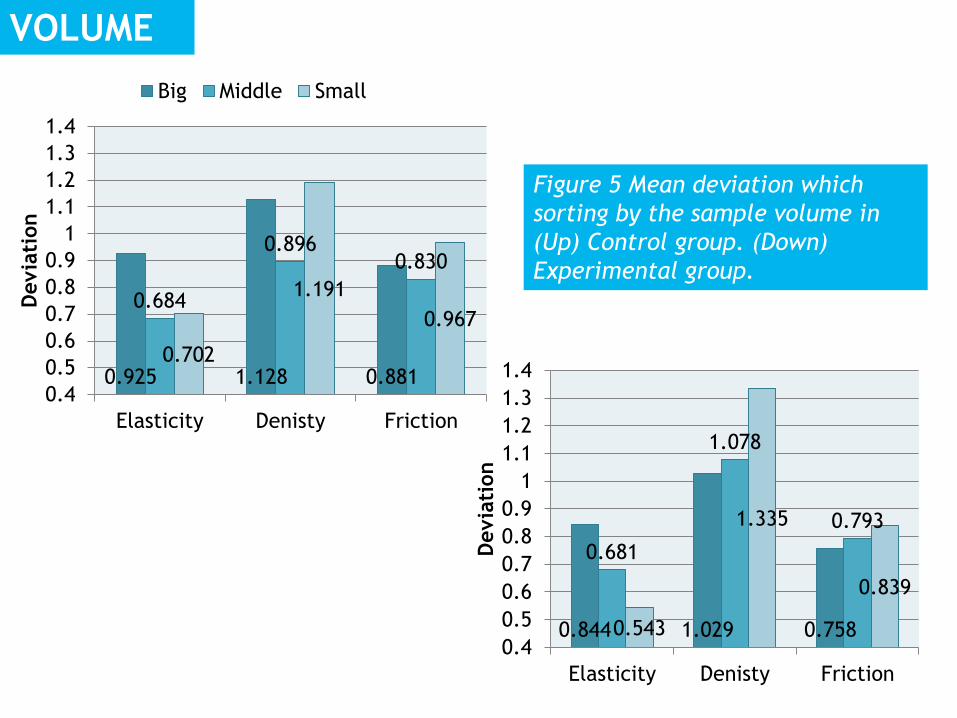
Figure 5 Mean deviation which
sorting by the sample volume in
(Up) Control group. (Down)
Experimental group.

Conclusion
Experiment
Discussion
EXPERIMENT
Value of R2 and the slope of the regression in
experimental group represent better than control
group.
Participant’s allocated score is in direct ratio to the
actual parameter, but the accuracy of reported value is
not quite high.
Mean of deviation of control group is 0.914, the
experiment group has the lower mean as 0.878. (T-test,
α=95%, p=0.605)
DISCUSSION
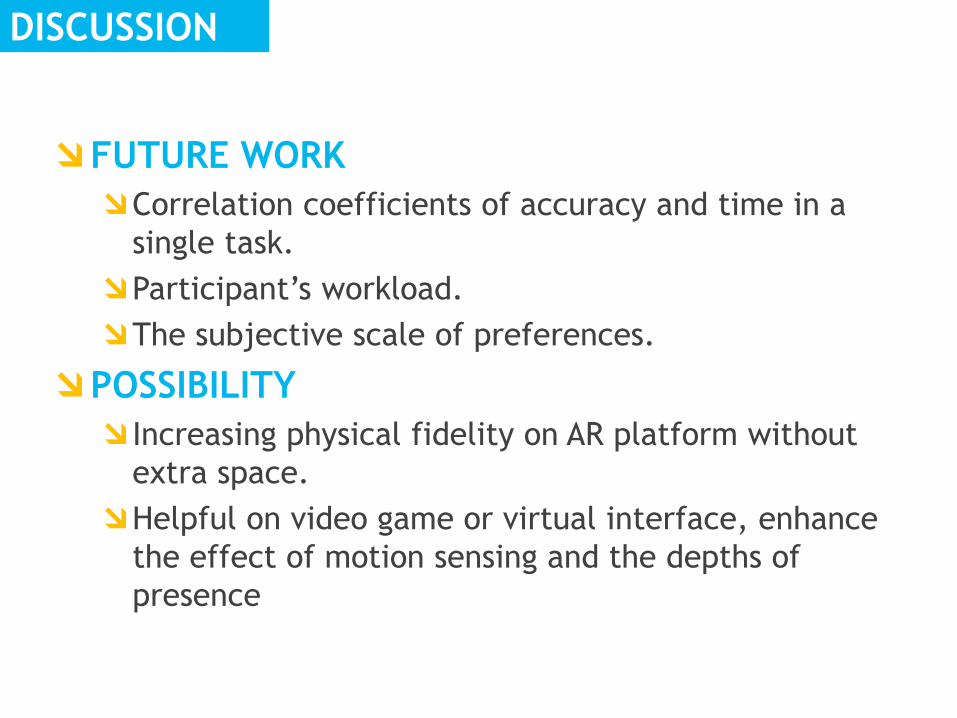
FUTURE WORK
Correlation coefficients of accuracy and time in a
single task.
Participant’s workload.
The subjective scale of preferences.
POSSIBILITY
Increasing physical fidelity on AR platform without
extra space.
Helpful on video game or virtual interface, enhance
the effect of motion sensing and the depths of
presence

END
THANKS FOR YOUR ATTENTION


![Touchscreen Haptic Augmentation Effects on Tapping, Drag ...vda.univie.ac.at/.../Lit-Tests/4TouchscreenHaptics.pdf · 2 BACKGROUND AND RELATED WORK Mclean [29] provides a broad overview](https://img.dokumen.tips/doc/110x75/5fcc8ab7baedb97221335b44/touchscreen-haptic-augmentation-effects-on-tapping-drag-vda-2-background-and.jpg)