Embed Size (px)
Citation preview

Paid Search Trendsi P R O S P E C T Q U A R T E R LY R E P O R T:
2017 Q2 By Jessica Freistat, Michael Engels and Michael Kelley
Executive Summary
02
i P R O S P E C T Q U A R T E R LY R E P O R T PA I D S E A R C H T R E N D S | 2 0 1 7 Q 2
© 2 0 1 7 i P R O S P E C T. A L L R I G H T S R E S E R V E D
Q2 was another costly quarter for paid search advertisers. iProspect’s Q2
year-over-year (YoY) Google AdWords data showed that while paid search continues
to be an outstanding performance media channel, continued CPC increases drove
costs to the highest level recorded since the inception of this report in 2014. This
CPC increase has, in turn, contributed to overall click declines by forcing advertisers
to spend more per click within constrained budgets, thus reducing the total number
of clicks they can afford. Analysis shows that the CPC increases were driven by two
primary factors:
• Competitive pressure on the mobile search engine results page (SERP)
increased as advertisers continued to invest more in mobile to align
with device-level search trends
• An update to Google’s Ad Rank calculation, which began rolling out
in May, placed more weight on keyword bids, resulting in a corresponding
reduction of the importance of other factors such as Quality Score
Shopping (PLA) investment and volume continue to grow and are higher than they
have ever been. This growth has been partially driven by the addition of the new
Shopping ad formats Google has rolled out over the past year, several of which
contain more PLA product units served per query or target higher funnel queries.
Both these attributes increase overall inventory and contribute to lower
Clickthrough rate (CTR) for Shopping campaigns as more impressions are served.
Along with the updates to Shopping ads, Google continues to improve the sophisti-
cation of its audience targeting capabilities within Search. Advertisers can help
offset the rising CPC by leveraging these new segmenting features to efficiently
funnel budget toward the most valuable customers. In addition to implementing
advanced audience targeting, advertisers should also customize ad copy for each
audience segment by utilizing IF statements and taking advantage of the increased
character limit of the Expanded Text Ad format. These tactics will help advertisers
develop targeted testing plans that ensure ad relevance and peak ad performance.
The following trends and insights are based on an analysis of the data from more than
1,800 Google AdWords accounts. All of these accounts are managed by iProspect
U.S. (though the spend is not confined to just U.S. markets), and together they
represent more than 200,000 active campaigns, spanning both Search and Shopping
(PLA) campaigns.
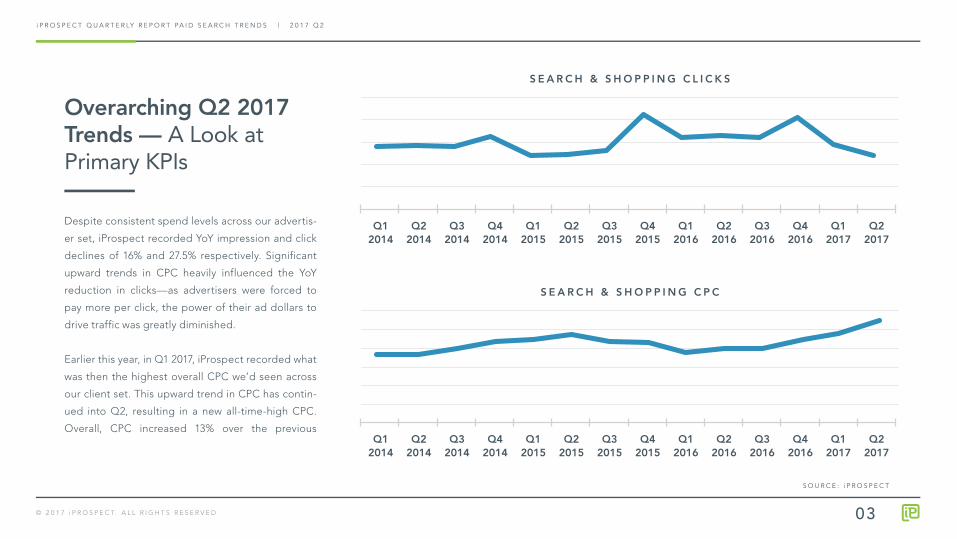
quarter and 36% YoY. These increases applied to all
devices with the largest increase in mobile (up 52%
YoY), followed by desktop and tablet at 33% and
18.5% growth YoY, respectively. As iProspect
anticipated, mobile CPC has continued to close in on
desktop CPC and has reached 76% that of desktop
(up from 71% in Q1).
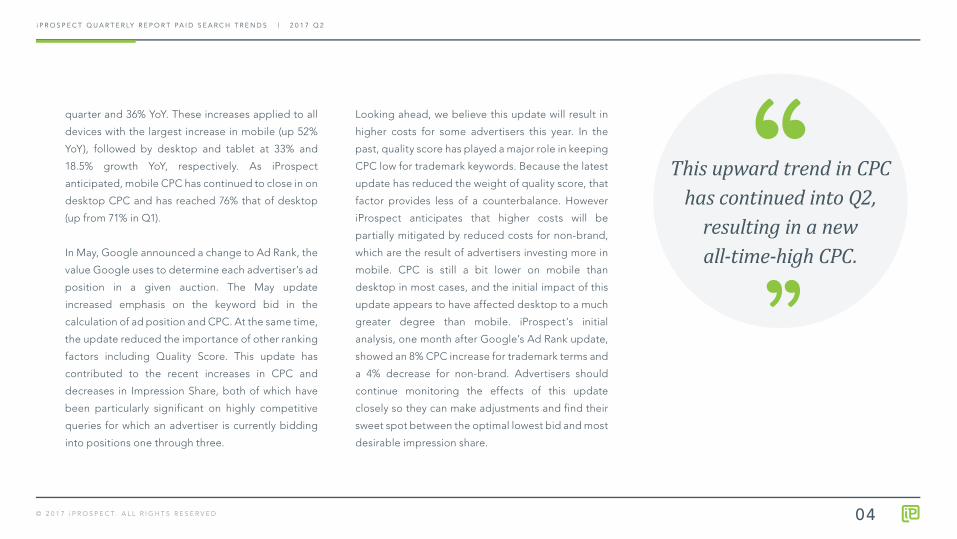
In May, Google announced a change to Ad Rank, the
value Google uses to determine each advertiser’s ad
position in a given auction. The May update
increased emphasis on the keyword bid in the
calculation of ad position and CPC. At the same time,
the update reduced the importance of other ranking
factors including Quality Score. This update has
contributed to the recent increases in CPC and
decreases in Impression Share, both of which have
been particularly significant on highly competitive
queries for which an advertiser is currently bidding
into positions one through three.
03© 2 0 1 7 i P R O S P E C T. A L L R I G H T S R E S E R V E D
i P R O S P E C T Q U A R T E R LY R E P O R T PA I D S E A R C H T R E N D S | 2 0 1 7 Q 2
Overarching Q2 2017 Trends — A Look at Primary KPIs
Despite consistent spend levels across our advertis-
er set, iProspect recorded YoY impression and click
declines of 16% and 27.5% respectively. Significant
upward trends in CPC heavily influenced the YoY
reduction in clicks—as advertisers were forced to
pay more per click, the power of their ad dollars to
drive traffic was greatly diminished.
Earlier this year, in Q1 2017, iProspect recorded what
was then the highest overall CPC we’d seen across
our client set. This upward trend in CPC has contin-
ued into Q2, resulting in a new all-time-high CPC.
Overall, CPC increased 13% over the previous
S O U R C E : i P R O S P E C T
Looking ahead, we believe this update will result in
higher costs for some advertisers this year. In the
past, quality score has played a major role in keeping
CPC low for trademark keywords. Because the latest
update has reduced the weight of quality score, that
factor provides less of a counterbalance. However
iProspect anticipates that higher costs will be
partially mitigated by reduced costs for non-brand,
which are the result of advertisers investing more in
mobile. CPC is still a bit lower on mobile than
desktop in most cases, and the initial impact of this
update appears to have affected desktop to a much
greater degree than mobile. iProspect’s initial
analysis, one month after Google’s Ad Rank update,
showed an 8% CPC increase for trademark terms and
a 4% decrease for non-brand. Advertisers should
continue monitoring the effects of this update
closely so they can make adjustments and find their
sweet spot between the optimal lowest bid and most
desirable impression share.
Mobile
S E A R C H & S H O P P I N G C P C
Q12014
Q22014
Q32014
Q42014
Q12015
Q22015
Q32015
Q42015
Q12016
Q22016
Q32016
Q42016
Q12017
Q22017
S E A R C H & S H O P P I N G C L I C K S
Q12014
Q22014
Q32014
Q42014
Q12015
Q22015
Q32015
Q42015
Q12016
Q22016
Q32016
Q42016
Q12017
Q22017
quarter and 36% YoY. These increases applied to all
devices with the largest increase in mobile (up 52%
YoY), followed by desktop and tablet at 33% and
18.5% growth YoY, respectively. As iProspect
anticipated, mobile CPC has continued to close in on
desktop CPC and has reached 76% that of desktop
(up from 71% in Q1).
In May, Google announced a change to Ad Rank, the
value Google uses to determine each advertiser’s ad
position in a given auction. The May update
increased emphasis on the keyword bid in the
calculation of ad position and CPC. At the same time,
the update reduced the importance of other ranking
factors including Quality Score. This update has
contributed to the recent increases in CPC and
decreases in Impression Share, both of which have
been particularly significant on highly competitive
queries for which an advertiser is currently bidding
into positions one through three.
04© 2 0 1 7 i P R O S P E C T. A L L R I G H T S R E S E R V E D
i P R O S P E C T Q U A R T E R LY R E P O R T PA I D S E A R C H T R E N D S | 2 0 1 7 Q 2
This upward trend in CPC has continued into Q2,
resulting in a new all-time-high CPC.
Despite consistent spend levels across our advertis-
er set, iProspect recorded YoY impression and click
declines of 16% and 27.5% respectively. Significant
upward trends in CPC heavily influenced the YoY
reduction in clicks—as advertisers were forced to
pay more per click, the power of their ad dollars to
drive traffic was greatly diminished.
Earlier this year, in Q1 2017, iProspect recorded what
was then the highest overall CPC we’d seen across
our client set. This upward trend in CPC has contin-
ued into Q2, resulting in a new all-time-high CPC.
Overall, CPC increased 13% over the previous
Looking ahead, we believe this update will result in
higher costs for some advertisers this year. In the
past, quality score has played a major role in keeping
CPC low for trademark keywords. Because the latest
update has reduced the weight of quality score, that
factor provides less of a counterbalance. However
iProspect anticipates that higher costs will be
partially mitigated by reduced costs for non-brand,
which are the result of advertisers investing more in
mobile. CPC is still a bit lower on mobile than
desktop in most cases, and the initial impact of this
update appears to have affected desktop to a much
greater degree than mobile. iProspect’s initial
analysis, one month after Google’s Ad Rank update,
showed an 8% CPC increase for trademark terms and
a 4% decrease for non-brand. Advertisers should
continue monitoring the effects of this update
closely so they can make adjustments and find their
sweet spot between the optimal lowest bid and most
desirable impression share.
i P R O S P E C T Q U A R T E R LY R E P O R T PA I D S E A R C H T R E N D S | 2 0 1 7 Q 2
05© 2 0 1 7 i P R O S P E C T. A L L R I G H T S R E S E R V E D
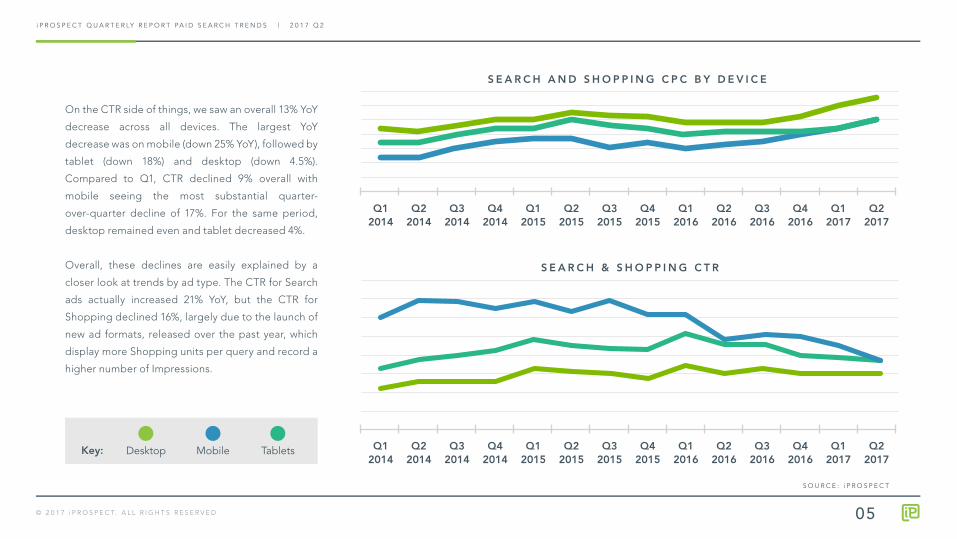
On the CTR side of things, we saw an overall 13% YoY
decrease across all devices. The largest YoY
decrease was on mobile (down 25% YoY), followed by
tablet (down 18%) and desktop (down 4.5%).
Compared to Q1, CTR declined 9% overall with
mobile seeing the most substantial quarter-
over-quarter decline of 17%. For the same period,
desktop remained even and tablet decreased 4%.
Overall, these declines are easily explained by a
closer look at trends by ad type. The CTR for Search
ads actually increased 21% YoY, but the CTR for
Shopping declined 16%, largely due to the launch of
new ad formats, released over the past year, which
display more Shopping units per query and record a
higher number of Impressions.
S E A R C H A N D S H O P P I N G C P C B Y D E V I C E
S O U R C E : i P R O S P E C T
Desktop Mobile TabletsKey:
S E A R C H & S H O P P I N G C T R
Q12014
Q22014
Q32014
Q42014
Q12015
Q22015
Q32015
Q42015
Q12016
Q22016
Q32016
Q42016
Q12017
Q22017
Q12014
Q22014
Q32014
Q42014
Q12015
Q22015
Q32015
Q42015
Q12016
Q22016
Q32016
Q42016
Q12017
Q22017
06© 2 0 1 7 i P R O S P E C T. A L L R I G H T S R E S E R V E D
i P R O S P E C T Q U A R T E R LY R E P O R T PA I D S E A R C H T R E N D S | 2 0 1 7 Q 2
Mobile
Mobile CPC has been consistently on the rise since Q1
2016, increasing 17% from Q1 to Q2 of this year and
52% YoY. Mobile impressions increased 18% YoY while
mobile clicks declined 12%. The decline in mobile
clicks is heavily influenced by the 52% YoY increase in
mobile CPC. The continuously rising mobile CPC is
largely a result of the mobile SERP becoming increas-
ingly competitive as advertisers shift a greater
percentage of their budgets to mobile in order to
align with mobile’s increasing share of searches.
Increased mobile investment is also fueled by the
advanced sophistication of emerging attribution
methodologies and online-to-offline measurement
tactics that allow marketers to assign value to mobile
traffic with a greater degree of accuracy.
Taking a Closer Look: Areas of Special Interest
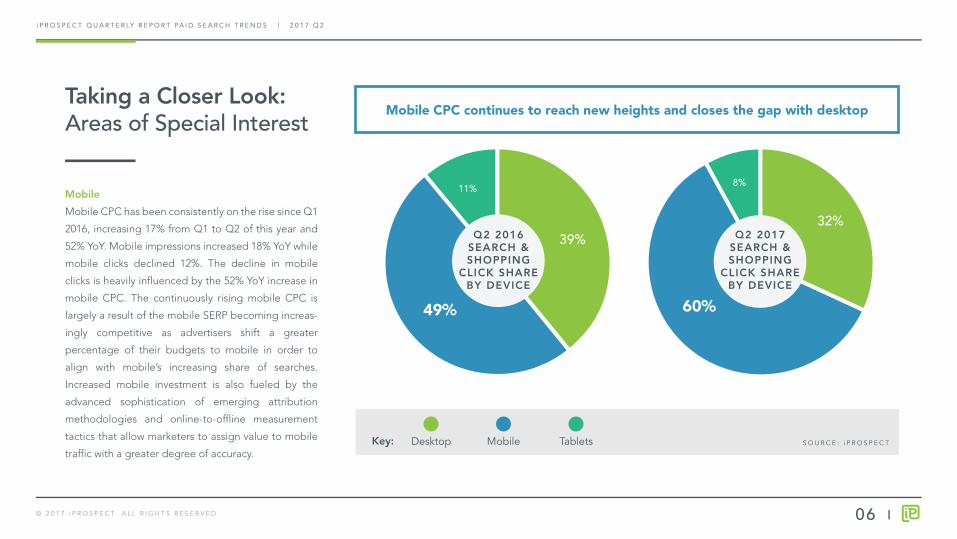
Q2 also saw continued increases in mobile click share,
with 60% of clicks coming from mobile vs. 32% from
desktop and 8% from tablet. Mobile click share
increased 22% YoY as user search trends drove
advertisers to spend ever larger percentages of their
paid search budgets on mobile.
Compared to other devices, tablet saw the most
significant declines in volume (-49% YoY) and the most
modest increase in CPC (up 18.5% YoY). For advertis-
ers who see strong performance on tablet because
their customers are frequent tablet users, these trends
may create the potential for a more efficient CPC
based on there being less competition.
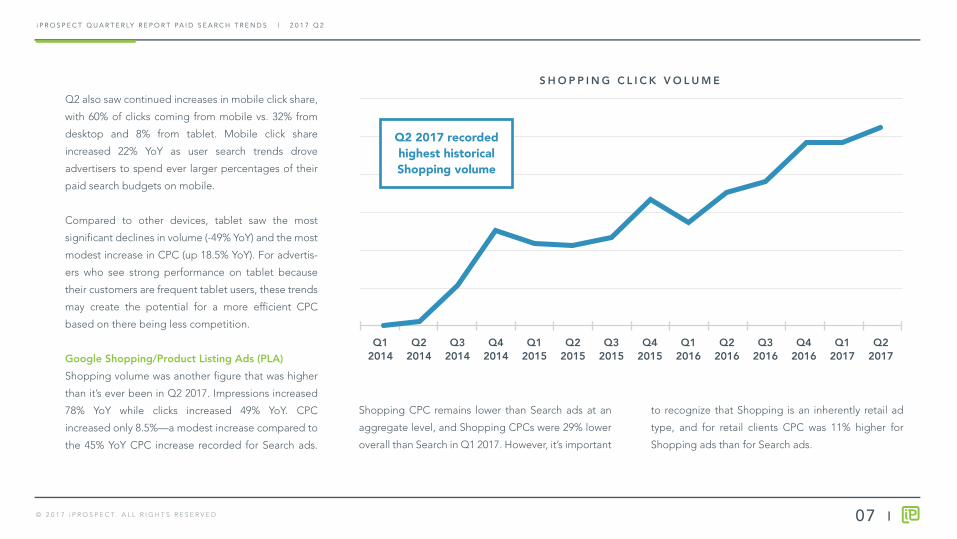
Google Shopping/Product Listing Ads (PLA)
Shopping volume was another figure that was higher
than it’s ever been in Q2 2017. Impressions increased
78% YoY while clicks increased 49% YoY. CPC
increased only 8.5%—a modest increase compared to
the 45% YoY CPC increase recorded for Search ads.
Shopping CPC remains lower than Search ads at an
aggregate level, and Shopping CPCs were 29% lower
overall than Search in Q1 2017. However, it’s important
to recognize that Shopping is an inherently retail ad
type, and for retail clients CPC was 11% higher for
Shopping ads than for Search ads.
60%
8%
32%
S O U R C E : i P R O S P E C TDesktop Mobile TabletsKey:
49%
11%
39%Q2 2016SEARCH & SHOPPING
CLICK SHAREBY DEVICE
Q2 2017SEARCH & SHOPPING
CLICK SHAREBY DEVICE
Mobile CPC continues to reach new heights and closes the gap with desktop
07© 2 0 1 7 i P R O S P E C T. A L L R I G H T S R E S E R V E D
i P R O S P E C T Q U A R T E R LY R E P O R T PA I D S E A R C H T R E N D S | 2 0 1 7 Q 2
Mobile
Mobile CPC has been consistently on the rise since Q1
2016, increasing 17% from Q1 to Q2 of this year and
52% YoY. Mobile impressions increased 18% YoY while
mobile clicks declined 12%. The decline in mobile
clicks is heavily influenced by the 52% YoY increase in
mobile CPC. The continuously rising mobile CPC is
largely a result of the mobile SERP becoming increas-
ingly competitive as advertisers shift a greater
percentage of their budgets to mobile in order to
align with mobile’s increasing share of searches.
Increased mobile investment is also fueled by the
advanced sophistication of emerging attribution
methodologies and online-to-offline measurement
tactics that allow marketers to assign value to mobile
traffic with a greater degree of accuracy.
Q2 also saw continued increases in mobile click share,
with 60% of clicks coming from mobile vs. 32% from
desktop and 8% from tablet. Mobile click share
increased 22% YoY as user search trends drove
advertisers to spend ever larger percentages of their
paid search budgets on mobile.
Compared to other devices, tablet saw the most
significant declines in volume (-49% YoY) and the most
modest increase in CPC (up 18.5% YoY). For advertis-
ers who see strong performance on tablet because
their customers are frequent tablet users, these trends
may create the potential for a more efficient CPC
based on there being less competition.
Google Shopping/Product Listing Ads (PLA)
Shopping volume was another figure that was higher
than it’s ever been in Q2 2017. Impressions increased
78% YoY while clicks increased 49% YoY. CPC
increased only 8.5%—a modest increase compared to
the 45% YoY CPC increase recorded for Search ads.
Shopping CPC remains lower than Search ads at an
aggregate level, and Shopping CPCs were 29% lower
overall than Search in Q1 2017. However, it’s important
to recognize that Shopping is an inherently retail ad
type, and for retail clients CPC was 11% higher for
Shopping ads than for Search ads.
S H O P P I N G C L I C K V O L U M E
Q12014
Q22014
Q32014
Q42014
Q12015
Q22015
Q32015
Q42015
Q12016
Q22016
Q32016
Q12017
Q22017
Q42016
Q2 2017 recorded highest historical Shopping volume
i P R O S P E C T Q U A R T E R LY R E P O R T PA I D S E A R C H T R E N D S | 2 0 1 7 Q 2
08© 2 0 1 7 i P R O S P E C T. A L L R I G H T S R E S E R V E D
Mobile volume of Shopping ads grew at a faster rate
than any other device, with mobile impressions more
than doubling (+102% YoY) and clicks increasing 79%
YoY. Comparatively, desktop and tablet clicks
increased only 18% and 9% YoY respectively.
Overall, CTR decreased for Shopping, resulting in the
aggregate CTR decrease in the overarching trends
noted above. The Shopping CTR decrease was
primarily due to increases in the number of ad units
Google shows on the SERP per query. This additional
inventory delivers more impressions for advertisers
overall, reducing the percentage of clicks.
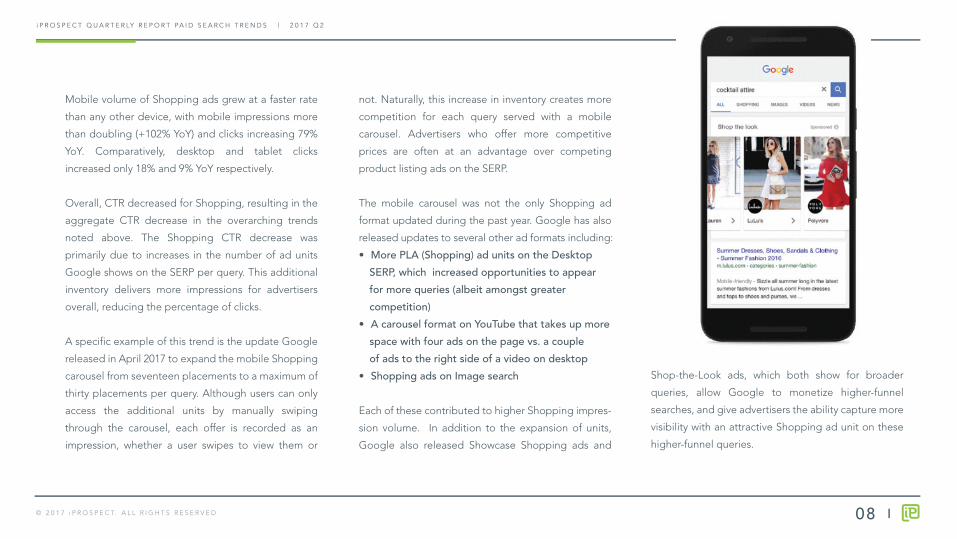
A specific example of this trend is the update Google
released in April 2017 to expand the mobile Shopping
carousel from seventeen placements to a maximum of
thirty placements per query. Although users can only
access the additional units by manually swiping
through the carousel, each offer is recorded as an
impression, whether a user swipes to view them or
not. Naturally, this increase in inventory creates more
competition for each query served with a mobile
carousel. Advertisers who offer more competitive
prices are often at an advantage over competing
product listing ads on the SERP.
The mobile carousel was not the only Shopping ad
format updated during the past year. Google has also
released updates to several other ad formats including:
• More PLA (Shopping) ad units on the Desktop
SERP, which increased opportunities to appear
for more queries (albeit amongst greater
competition)
• A carousel format on YouTube that takes up more
space with four ads on the page vs. a couple
of ads to the right side of a video on desktop
• Shopping ads on Image search
Each of these contributed to higher Shopping impres-
sion volume. In addition to the expansion of units,
Google also released Showcase Shopping ads and
Shop-the-Look ads, which both show for broader
queries, allow Google to monetize higher-funnel
searches, and give advertisers the ability capture more
visibility with an attractive Shopping ad unit on these
higher-funnel queries.
09© 2 0 1 7 i P R O S P E C T. A L L R I G H T S R E S E R V E D
i P R O S P E C T Q U A R T E R LY R E P O R T PA I D S E A R C H T R E N D S | 2 0 1 7 Q 2
S O U R C E : i P R O S P E C T
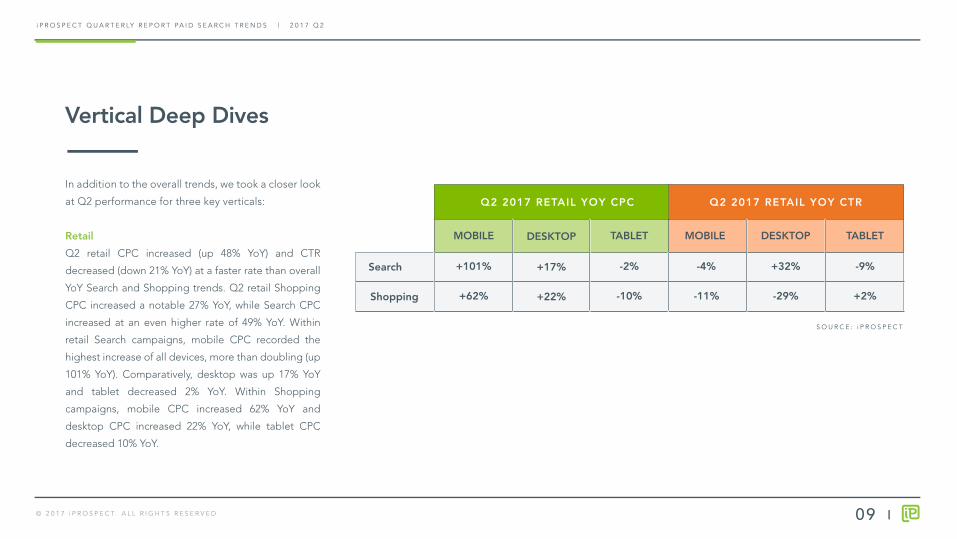
Vertical Deep Dives
In addition to the overall trends, we took a closer look
at Q2 performance for three key verticals:
Retail
Q2 retail CPC increased (up 48% YoY) and CTR
decreased (down 21% YoY) at a faster rate than overall
YoY Search and Shopping trends. Q2 retail Shopping
CPC increased a notable 27% YoY, while Search CPC
increased at an even higher rate of 49% YoY. Within
retail Search campaigns, mobile CPC recorded the
highest increase of all devices, more than doubling (up
101% YoY). Comparatively, desktop was up 17% YoY
and tablet decreased 2% YoY. Within Shopping
campaigns, mobile CPC increased 62% YoY and
desktop CPC increased 22% YoY, while tablet CPC
decreased 10% YoY.
Q2 2017 RETAIL YOY CPC Q2 2017 RETAIL YOY CTR
Search
Shopping
DESKTOP
+17%
+22%
MOBILE
+101%
+62%
TABLET
-2%
-10%
MOBILE
-4%
-11%
DESKTOP
+32%
-29%
TABLET
-9%
+2%
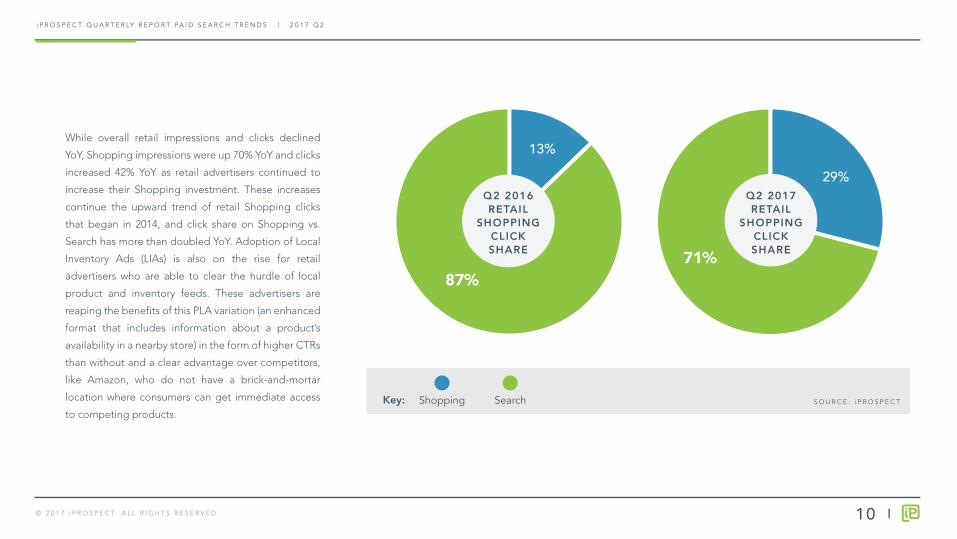
While overall retail impressions and clicks declined
YoY, Shopping impressions were up 70% YoY and clicks
increased 42% YoY as retail advertisers continued to
increase their Shopping investment. These increases
continue the upward trend of retail Shopping clicks
that began in 2014, and click share on Shopping vs.
Search has more than doubled YoY. Adoption of Local
Inventory Ads (LIAs) is also on the rise for retail
advertisers who are able to clear the hurdle of local
product and inventory feeds. These advertisers are
reaping the benefits of this PLA variation (an enhanced
format that includes information about a product’s
availability in a nearby store) in the form of higher CTRs
than without and a clear advantage over competitors,
like Amazon, who do not have a brick-and-mortar
location where consumers can get immediate access
to competing products.
10© 2 0 1 7 i P R O S P E C T. A L L R I G H T S R E S E R V E D
i P R O S P E C T Q U A R T E R LY R E P O R T PA I D S E A R C H T R E N D S | 2 0 1 7 Q 2
87%
13%
29%
71%
Q2 2016RETAIL
SHOPPINGCLICK SHARE
Q2 2017RETAIL
SHOPPINGCLICK SHARE
S O U R C E : i P R O S P E C TSearchShoppingKey:
In addition to the overall trends, we took a closer look
at Q2 performance for three key verticals:
Retail
Q2 retail CPC increased (up 48% YoY) and CTR
decreased (down 21% YoY) at a faster rate than overall
YoY Search and Shopping trends. Q2 retail Shopping
CPC increased a notable 27% YoY, while Search CPC
increased at an even higher rate of 49% YoY. Within
retail Search campaigns, mobile CPC recorded the
highest increase of all devices, more than doubling (up
101% YoY). Comparatively, desktop was up 17% YoY
and tablet decreased 2% YoY. Within Shopping
campaigns, mobile CPC increased 62% YoY and
desktop CPC increased 22% YoY, while tablet CPC
decreased 10% YoY.
While overall retail impressions and clicks declined
YoY, Shopping impressions were up 70% YoY and clicks
increased 42% YoY as retail advertisers continued to
increase their Shopping investment. These increases
continue the upward trend of retail Shopping clicks
that began in 2014, and click share on Shopping vs.
Search has more than doubled YoY. Adoption of Local
Inventory Ads (LIAs) is also on the rise for retail
advertisers who are able to clear the hurdle of local
product and inventory feeds. These advertisers are
reaping the benefits of this PLA variation (an enhanced
format that includes information about a product’s
availability in a nearby store) in the form of higher CTRs
than without and a clear advantage over competitors,
like Amazon, who do not have a brick-and-mortar
location where consumers can get immediate access
to competing products.
10
B2B
B2B CPC continues to be some of the most competi-
tive—and expensive—in the industry. This is no
surprise based on the comparatively high value of
each conversion. Contrary to the overarching Search
trends, quarter-over-quarter CPC across B2B accounts
declined 1%. In general, trends tend to differ quite
substantially for the B2B vertical vs. other verticals.
This is due to a variety of differentiating factors. For
instance, the B2B industry has been slower to adopt
mobile, they tend to have more complex conversion
processes than other verticals, and, in some cases,
these conversion processes are more difficult to
complete on a mobile screen. For these and other
reasons, mobile and tablet CPCs each decreased 13%
in Q2 as compared to Q1. In the first two quarters of
2017, clicks also decreased across all devices in Q2 vs.
Q1, but mobile click share continued to slowly
increase—landing at 42% in Q2 vs. 38% in Q1.
11© 2 0 1 7 i P R O S P E C T. A L L R I G H T S R E S E R V E D
i P R O S P E C T Q U A R T E R LY R E P O R T PA I D S E A R C H T R E N D S | 2 0 1 7 Q 2
B2B advertisers should focus on measuring lead
quality and anticipated lifetime value (LTV) in order to
optimize budget spent while continuing to use more
sophisticated audience segmentation strategies that
help allocate budget toward the highest-value
customer segments.
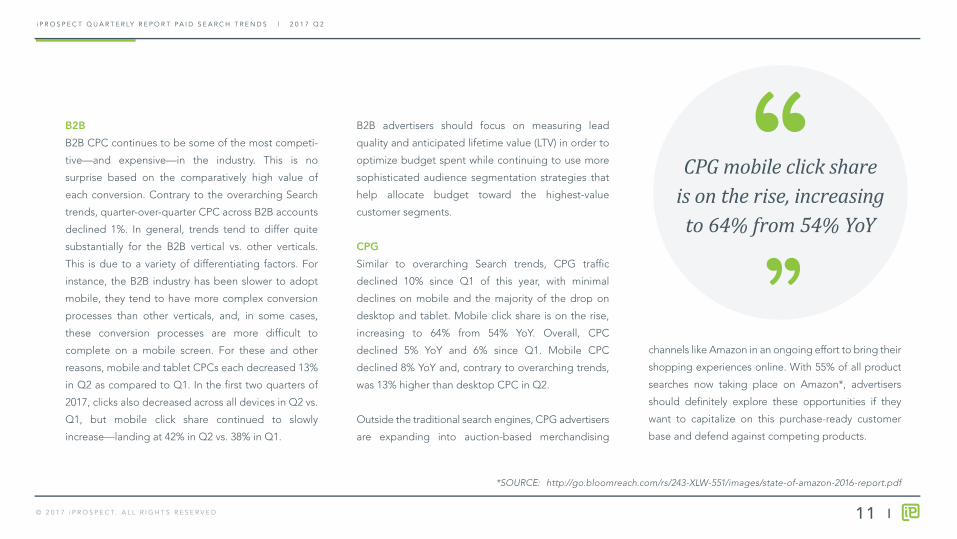
CPG
Similar to overarching Search trends, CPG traffic
declined 10% since Q1 of this year, with minimal
declines on mobile and the majority of the drop on
desktop and tablet. Mobile click share is on the rise,
increasing to 64% from 54% YoY. Overall, CPC
declined 5% YoY and 6% since Q1. Mobile CPC
declined 8% YoY and, contrary to overarching trends,
was 13% higher than desktop CPC in Q2.
Outside the traditional search engines, CPG advertisers
are expanding into auction-based merchandising
channels like Amazon in an ongoing effort to bring their
shopping experiences online. With 55% of all product
searches now taking place on Amazon*, advertisers
should definitely explore these opportunities if they
want to capitalize on this purchase-ready customer
base and defend against competing products.
CPG mobile click share is on the rise, increasing to 64% from 54% YoY
http://go.bloomreach.com/rs/243-XLW-551/images/state-of-amazon-2016-report.pdf*SOURCE:
i P R O S P E C T Q U A R T E R LY R E P O R T PA I D S E A R C H T R E N D S | 2 0 1 7 Q 2
12© 2 0 1 7 i P R O S P E C T. A L L R I G H T S R E S E R V E D
Predicting What’s Next – 2017
Looking ahead, iProspect expects that CPC will contin-
ue to rise, and advertisers will need to spend more to
achieve the same positioning as they adjust to chang-
es created by factors such as the Ad Rank update and
increasing competition on the mobile SERP. In
anticipation of higher CPC levels being the new
normal in 2017, advertisers should take higher expens-
es into consideration for budget planning and
forecasting over the remainder of this year.
Although higher CPC means advertisers will need to
spend more to drive the same amount of traffic, many
advertisers will see an upside in the form of higher
conversion rates and the potential for higher conver-
sion values as a result of greater opportunities to make
use of more sophisticated audience targeting and
highly relevant ads. In addition to RLSA, Customer
Match, and Similar Audiences based on RLSA lists,
Google also announced the upcoming release of
In-Market Audiences for Search and Shopping this
year, as well as Similar Audiences for Customer Match
lists. Advertisers should start planning for these releas-
es now and ensure that they take full advantage of
Google’s IF statements for ad copy, which allow
advertisers to customize ads based on device and
audience lists for increased personalization.
Now officially in the Back-to-School shopping season,
iProspect expects to see a push from retailers in Search
and Shopping in Q3 as school start dates inch closer.
This seasonal uptick will be followed by a brief dip
once school is in session, followed by a more substan-
tial Q4 push heading into the Black Friday/December
holiday timeframe.
Over the rest of this year, smart retailers with
brick-and-mortar locations will invest time and resourc-
es to develop and optimize omnichannel strategies
that integrated online and offline tactics. Advertisers
leveraging in-store visits data in AdWords can now get
this data at a geographic level to better align with
retail store data. As announced at Google Marketing
Next, any retailer who is live on Local Inventory Ads
(LIAs) will also be eligible to have their stores’ local
inventory available to Google Home and Assistant
during Google’s upcoming experimental phase, giving
retailers yet another reason to adopt this format. LIAs
on Home will let users know which nearby retailers
carry items they are searching for (i.e., “where can I buy
Timberland boots nearby?”) and then offers to direct
them to the nearest store. Advertisers can also take
advantage of Store Sales Direct, a new tool that allows
advertisers who collect customer email information at
the point of sale to import this email information into
AdWords. This data is then uploaded, along with
information about what a customer bought and the
value of the sale, and then this combined data is
matched to campaigns and extrapolated to represent
all clicks.
Finally, all advertisers should have an attribution model
and measurement plan that is strategically aligned
with the business and client needs. This is key to
understanding the value of media spend at all touch
points along the consumer journey, insight that is
particularly relevant in a marketplace that is continuing
to shift to mobile and in which there is a steady trend
of increasing CPCs. Drilling down into all these details
is critical for advertisers who want to be able to
accurately identify the cost thresholds and budget
allocations that are most profitable across all devices
and marketing channels.
i P R O S P E C T Q U A R T E R LY R E P O R T PA I D S E A R C H T R E N D S | 2 0 1 7 Q 2
13© 2 0 1 7 i P R O S P E C T. A L L R I G H T S R E S E R V E D
Looking ahead, iProspect expects that CPC will contin-
ue to rise, and advertisers will need to spend more to
achieve the same positioning as they adjust to chang-
es created by factors such as the Ad Rank update and
increasing competition on the mobile SERP. In
anticipation of higher CPC levels being the new
normal in 2017, advertisers should take higher expens-
es into consideration for budget planning and
forecasting over the remainder of this year.
Although higher CPC means advertisers will need to
spend more to drive the same amount of traffic, many
advertisers will see an upside in the form of higher
conversion rates and the potential for higher conver-
sion values as a result of greater opportunities to make
use of more sophisticated audience targeting and
highly relevant ads. In addition to RLSA, Customer
Match, and Similar Audiences based on RLSA lists,
Google also announced the upcoming release of
In-Market Audiences for Search and Shopping this
year, as well as Similar Audiences for Customer Match
lists. Advertisers should start planning for these releas-
es now and ensure that they take full advantage of
Google’s IF statements for ad copy, which allow
advertisers to customize ads based on device and
audience lists for increased personalization.
Now officially in the Back-to-School shopping season,
iProspect expects to see a push from retailers in Search
and Shopping in Q3 as school start dates inch closer.
This seasonal uptick will be followed by a brief dip
once school is in session, followed by a more substan-
tial Q4 push heading into the Black Friday/December
holiday timeframe.
Over the rest of this year, smart retailers with
brick-and-mortar locations will invest time and resourc-
es to develop and optimize omnichannel strategies
that integrated online and offline tactics. Advertisers
leveraging in-store visits data in AdWords can now get
this data at a geographic level to better align with
retail store data. As announced at Google Marketing
Next, any retailer who is live on Local Inventory Ads
(LIAs) will also be eligible to have their stores’ local
inventory available to Google Home and Assistant
during Google’s upcoming experimental phase, giving
retailers yet another reason to adopt this format. LIAs
on Home will let users know which nearby retailers
Based on Google AdWords data
Includes Search and Google PLAs/Shopping
Does not include YouTube or the Google
Display Network
About the Data:
carry items they are searching for (i.e., “where can I buy
Timberland boots nearby?”) and then offers to direct
them to the nearest store. Advertisers can also take
advantage of Store Sales Direct, a new tool that allows
advertisers who collect customer email information at
the point of sale to import this email information into
AdWords. This data is then uploaded, along with
information about what a customer bought and the
value of the sale, and then this combined data is
matched to campaigns and extrapolated to represent
all clicks.
Finally, all advertisers should have an attribution model
and measurement plan that is strategically aligned
with the business and client needs. This is key to
understanding the value of media spend at all touch
points along the consumer journey, insight that is
particularly relevant in a marketplace that is continuing
to shift to mobile and in which there is a steady trend
of increasing CPCs. Drilling down into all these details
is critical for advertisers who want to be able to
accurately identify the cost thresholds and budget
allocations that are most profitable across all devices
and marketing channels.
All advertisers should have an attribution model and measurement plan that is
strategically aligned with the business and client needs.
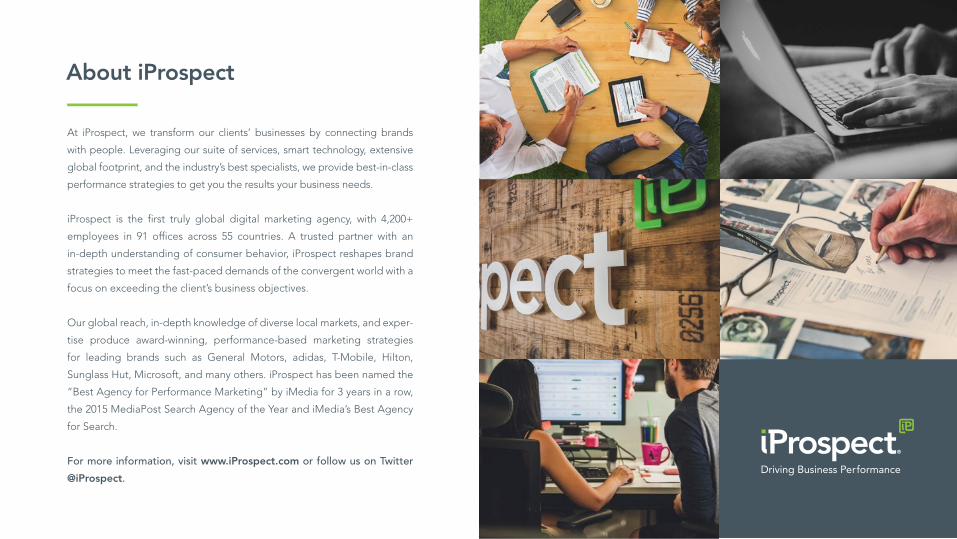
At iProspect, we transform our clients’ businesses by connecting brands
with people. Leveraging our suite of services, smart technology, extensive
global footprint, and the industry’s best specialists, we provide best-in-class
performance strategies to get you the results your business needs.
iProspect is the first truly global digital marketing agency, with 4,200+
employees in 91 offices across 55 countries. A trusted partner with an
in-depth understanding of consumer behavior, iProspect reshapes brand
strategies to meet the fast-paced demands of the convergent world with a
focus on exceeding the client’s business objectives.
Our global reach, in-depth knowledge of diverse local markets, and exper-
tise produce award-winning, performance-based marketing strategies
for leading brands such as General Motors, adidas, T-Mobile, Hilton,
Sunglass Hut, Microsoft, and many others. iProspect has been named the
“Best Agency for Performance Marketing” by iMedia for 3 years in a row,
the 2015 MediaPost Search Agency of the Year and iMedia’s Best Agency
for Search.
For more information, visit www.iProspect.com or follow us on Twitter
@iProspect.
About iProspect
About the Authors
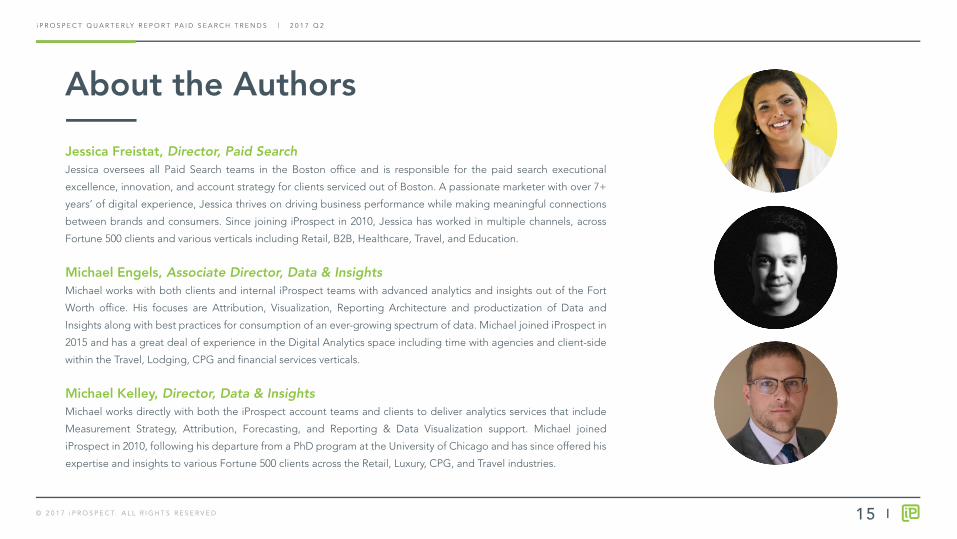
Jessica Freistat, Director, Paid SearchJessica oversees all Paid Search teams in the Boston office and is responsible for the paid search executional
excellence, innovation, and account strategy for clients serviced out of Boston. A passionate marketer with over 7+
years’ of digital experience, Jessica thrives on driving business performance while making meaningful connections
between brands and consumers. Since joining iProspect in 2010, Jessica has worked in multiple channels, across
Fortune 500 clients and various verticals including Retail, B2B, Healthcare, Travel, and Education.
Michael Engels, Associate Director, Data & InsightsMichael works with both clients and internal iProspect teams with advanced analytics and insights out of the Fort
Worth office. His focuses are Attribution, Visualization, Reporting Architecture and productization of Data and
Insights along with best practices for consumption of an ever-growing spectrum of data. Michael joined iProspect in
2015 and has a great deal of experience in the Digital Analytics space including time with agencies and client-side
within the Travel, Lodging, CPG and financial services verticals.
Michael Kelley, Director, Data & InsightsMichael works directly with both the iProspect account teams and clients to deliver analytics services that include
Measurement Strategy, Attribution, Forecasting, and Reporting & Data Visualization support. Michael joined
iProspect in 2010, following his departure from a PhD program at the University of Chicago and has since offered his
expertise and insights to various Fortune 500 clients across the Retail, Luxury, CPG, and Travel industries.
i P R O S P E C T Q U A R T E R LY R E P O R T PA I D S E A R C H T R E N D S | 2 0 1 7 Q 2
15© 2 0 1 7 i P R O S P E C T. A L L R I G H T S R E S E R V E D

www.iprospect.com © 2 0 1 7 i P R O S P E C T. A L L R I G H T S R E S E R V E D