Embed Size (px)
Citation preview

Overview of the 2012 Farm Bill
Joe L. Outlaw Professor & Extension Economist
Co-Director, AFPC
Managing Agricultural Risks Under the 2012 Farm Bill 2012 AM/PIC Meeting
Charleston, South Carolina
July 18, 2012

Presentation Outline
• Background
• Farm Bill Time Table
• Ramifications for Farmers & Ranchers
• Major Concerns
• Extension’s Role in Providing Educational Programs for Producers
• Conclusions
Farm Policy

Background
• Urgency For New Farm Bill
– Current bill expires September 30th of this year
– Better to Decide on How to Cut Ag Rather than Some Other Committee
– Possibility of Flip in Control of the Senate
– Presidential Elections

0
20,000
40,000
60,000
80,000
100,000
120,000
2013 2014 2015 2016 2017 2018 2019 2020 2021 2022
XVTradeandTaxProvisions
XIVMiscellaneous6/
XIIICommodityFutures
XIICropInsuranceandDisasterAssistance
XILivestock
XHor cultureandOrganicAgriculture
IXEnergy
VIIIForestry
VIIResearchandRelatedMa ers
VIRuralDevelopment
VCredit
IVNutri on
IIITrade(CCC)
IIConserva on
ICommodityPrograms(CCC)
Mandatory Spending Baseline for the 2008 Farm Bill Programs and Provisions,
by Title, ($M), FY 2013-22
Source: CBO March 2012 Baseline

Total Payments ($M), 2013-22
Source: CBO March 2012 Baseline
0
5,000
10,000
15,000
20,000
25,000
Corn
Soybeans
Wheat
UplandCo
on
Rice
Peanuts
Sorghum
Barley
Oats
OtherOilseeds
Wool
Mohair
Honey
DryPeas
Lenls
Stove Piping is an issue – want our share of the money after any cuts

Baseline Payments ($M) and Planted Acres, Major Program Crops, 2013-22
0
5,000
10,000
15,000
20,000
25,000
Payments
89.1 Mil Ac
76.4 Mil Ac
54.5 Mil Ac
11.25 Mil Ac
2.97 Mil Ac
1.38 Mil Ac
For My Sanity -- It’s About the Safety Net –
Not Who Gets How Much!!

Farm Bill Time Table

Farm Bill Time Table
• A chance it is taken up in the House soon – Big question of whether it survives there
• A better chance it never goes to the House floor – I have been advised to look at the recently
passed transportation bill
• For more than a year I have thought it would be 2013 and still do

Ramifications for Farmers and Ranchers
• Need to go through a quick review of what is in the two bills
• Just so you know what to look for:
– The bills are similar in some respects but quite a bit different generally
– The Senate bill puts all crops other than cotton in a shallow loss type of safety net program with 2 choices of yields to use OR a producer can opt out
– The House bill allows producers to choose between a shallow loss or price based safety net

Title Description CBO Baseline Change Senate Change House
I Commodity Programs 62,944 -19,428 -23,584
II Conservation 64,067 -6,374 -6,062
III Trade (CCC) 3,411 0 0
IV Nutrition 772,109 -4,000 -16,075
V Credit -2,665 0 0
VI Rural Development 25 115 105
VII Research and Related 214 681 546
VIII Forestry 9 9 4
IX Energy 750 780 0
X Horticulture and Organic Ag
1,080 360 428
XI Livestock 0
XII Crop Insurance 90,867 5,036 9,524
XIII Commodity Futures 0
XIV Miscellaneous 0 -319 50
XV Trade & Tax 0

Provisions Senate Agriculture Risk Coverage (ARC) Provisions
House Revenue Loss Coverage (RLC) Provisions
Revenue guarantee Starts at 89% of previous 5-year moving Olympic average revenue for the crop
Starts at 85% of previous 5-year moving Olympic average revenue for the crop
County Level or Individual Level Coverage
One time irrevocable selection of either county level or individual level
County level
Payment acres 65% of planted acres not to exceed the average total acres planted or prevented from being planted to covered commodities and upland cotton on the farm for the 2009 – 2012 crop years if individual level coverage is selected or 80% for county level coverage
85% of planted acres and 30% of prevented planted acres not to exceed base acres on the farm (upland cotton base acres are included in total farm base acres) (payment factor of 85% is applied to planted acres before checking whole farm base cap)
Payment band or range 10% (89% to 79%) 10% (85% to 75%)
Actual revenue Calculated using the average price during the first 5 months of the marketing year and actual yields
Calculated using the average price during the first 5 months of the marketing year and actual yields
Mandatory or Optional Producer has the option to opt out of ARC and select SCO with a wider coverage level
Producer has the option to select RLC or price loss coverage (PLC)
Transitional Yields Used to Replace Low Yields in Calculating Revenue Guarantee
Can replace low yields with 60% of transitional yields in 2012 or prior years and 70% in 2013 or any subsequent years
Can replace any low yield in revenue calculations with 70% of the transitional yield
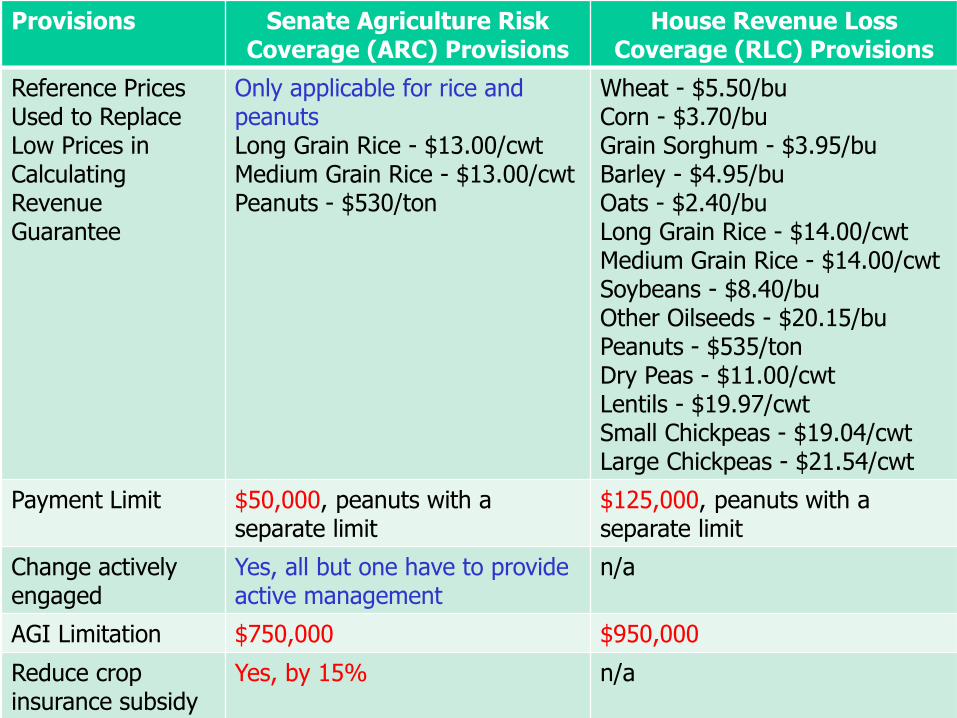
Provisions Senate Agriculture Risk Coverage (ARC) Provisions
House Revenue Loss Coverage (RLC) Provisions
Reference Prices Used to Replace Low Prices in Calculating Revenue Guarantee
Only applicable for rice and peanuts Long Grain Rice - $13.00/cwt Medium Grain Rice - $13.00/cwt Peanuts - $530/ton
Wheat - $5.50/bu Corn - $3.70/bu Grain Sorghum - $3.95/bu Barley - $4.95/bu Oats - $2.40/bu Long Grain Rice - $14.00/cwt Medium Grain Rice - $14.00/cwt Soybeans - $8.40/bu Other Oilseeds - $20.15/bu Peanuts - $535/ton Dry Peas - $11.00/cwt Lentils - $19.97/cwt Small Chickpeas - $19.04/cwt Large Chickpeas - $21.54/cwt
Payment Limit $50,000, peanuts with a separate limit
$125,000, peanuts with a separate limit
Change actively engaged
Yes, all but one have to provide active management
n/a
AGI Limitation $750,000 $950,000
Reduce crop insurance subsidy if AGI > 750,000
Yes, by 15% n/a

Provisions House Price Loss Coverage (PLC) Program
Payment Acres 85% of planted acres and 30% of prevented planted acres not to exceed base acres on the farm (upland cotton base acres are included in total farm base acres) (payment factor of 85% is applied to planted acres before checking whole farm base cap)
Reference Prices Wheat - $5.50/bu Corn - $3.70/bu Grain Sorghum - $3.95/bu Barley - $4.95/bu Oats - $2.40/bu Long Grain Rice - $14.00/cwt Medium Grain Rice - $14.00/cwt Soybeans - $8.40/bu Other Oilseeds - $20.15/bu Peanuts - $535/ton Dry Peas - $11.00/cwt Lentils - $19.97/cwt Small Chickpeas - $19.04/cwt Large Chickpeas - $21.54/cwt
Price Trigger If the average price during the first 5 months of the marketing year falls below the reference price for the commodity
Payment Yields CCP yields from the 2008 Farm Bill or establishes a methodology for producers of oilseeds without a CCP yield. Producer option to update payment yields to 90% of the average of the yield per planted acre for the crop for the 2008 to 2012 crop years, excluding any crop year in which the acreage planted was zero.
Payment Limitation $125,000, peanuts with a separate limit
AGI Limitation $950,000

Provisions Senate SCO and STAX House SCO and STAX
SCO Coverage Producer has the option of purchasing on an individual yield and loss basis or an area yield and loss basis or an individual yield and loss basis, supplemented with coverage based on an area yield and loss basis to cover all or a part of the deductible under the individual yield and loss policy, or a margin basis alone or in combination with—individual yield and loss coverage; or area yield and loss coverage
Producer has the option of purchasing additional coverage based on an individual yield and loss basis or an area yield and loss basis or an individual yield and loss basis, supplemented with coverage based on an area yield and loss basis to cover all or a part of the deductible under the individual yield and loss policy
SCO Band If an ARC participant, coverage from individual producer buyup insurance coverage level up to 79%. If producer opts out of ARC, then from individual producer insurance coverage level to 90%.
If in PLC, from individual producer insurance coverage level up to 90%. Not available if in RLC.
SCO Premium Subsidy
70% 70%
STAX Coverage Band
Producer elects coverage for revenue loss of not less than 10 percent and not more than 30 percent of expected county revenue, specified in increments of 5 percent.
Producer elects coverage for revenue loss of not less than 10 percent and not more than 30 percent of expected county revenue, specified in increments of 5 percent.
STAX Reference Price
None $0.6861/lb
STAX Premium Subsidy
80% 80%

Conservation Provisions
Senate House
Spending Cut $6 billion $6 billon
Consolidates Programs 23 programs combined into four fundamental program functions
23 programs to 13
CRP 25 million acre CAP 25 million acre CAP
Working Lands EQIP, CSP, Easements EQIP, CSP, Easements
Conservation Security Program
Enrollment limited to 10.348 million acres/year
Enrollment limited to 9 million acres/year


AFPC Representative Farms

Comparison of FAPRI Baseline Prices and Prices Used in the Declining Price Scenario

Results Indicating the Representative Farm’s Preference for Opting Out of ARC for a Larger SCO
Payment Band or Remaining in ARC

All 64 Representative Farm’s Preferred Title I Safety Net Option of the Senate Individual and County ARC and the House RLC and PLC
Alternatives.


Evolution of Dairy Policy
• Originally “Foundation for the Future”
• Then “Dairy Security Act of 2011”
• And Now “Modified Dairy Security Act”
• There could be more changes before it is over

Summary of Results for CA1710


Major Concerns
• Regardless of how conference negotiations go there will be less of a safety net for producers
• There will be Choices that Producers will need to make
– Some hate and some embrace

27
0
50
100
150
200
250
19
75
19
77
19
79
19
81
19
83
19
85
19
87
19
89
19
91
19
93
19
95
19
97
19
99
20
01
20
03
20
05
20
07
20
09
Mill
ion
s
Net Insured Acres, 1975 to 2009(Ten Major Crops)
William J. Murphy, Administrator
Risk Management Agency

Program Growth
William J. Murphy, Administrator
Risk Management Agency 28
$0
$10
$20
$30
$40
$50
$60
$70
$80
$90
$100
$110
$120
1996
1997
1998
1999
2000
2001
2002
2003
2004
2005
2006
2007
2008
2009
2010
2011
(Bil
lio
n)
Liability by Plan Type
Other Group Revenue APH
•As of 11-22-11

DECEMBER COTTON
Feb 1-Feb 28 Oct 1-Oct31
(cents/unit) (cents/unit) ($/unit)
2000 61.35 63.35 0.02
2001 58.63 31.39 -0.27
2002 42.18 44.51 0.02
2003 59.62 74.43 0.15
2004 66.75 46.57 -0.20
2005 51.15 54.40 0.03
2006 60.38 49.38 -0.11
2007 58.00 64.01 0.06
2008 79.18 50.57 -0.29
2009 52.25 65.63 0.13
2010 72.39 112.33 0.40
2011 123.01 101.05 -0.22 Years Price Drops
30 Year Average 65.68 64.70 -0.0098 17
20 Year Average 67.04 64.61 -0.0243 12
10 Year Average 66.49 66.29 -0.0020 4


Extension’s Role in Providing Educational Programs for Producers
• Regardless of when bill is finished there will be a big shift from commodity program tools to manage risk to insurance tools
– Insurance tools do not have floors
• Not a problem… just different than producers are used to
• Major education role for Extension

Potential Deal Breakers
• Dairy Provisions
• CHOICE in crop safety net
• Payment limitations on insurance subsidies
• If Tea Party House Members insist on Large SNAP cuts
• Many Many more…

Conclusions
• In the policy world, you are going to hear the term: producers choice – a lot
• The process now will likely be an even bigger mess
• In the end, I expect a 2013 Farm Bill – but they have made a lot more progress than I thought they would so – maybe this year
• For this year, no change in policy but lots of questions for next year…


![THE 2008 FARM BILL FRIEND OR FOE TO C W ...vjel.vermontlaw.edu/files/2013/06/The-2008-Farm-Bill...2011] The 2008 Farm Bill 549 the Farm Bill since 1938, when Congress added payments](https://img.dokumen.tips/doc/110x75/5b2208827f8b9a5a7f8b459b/the-2008-farm-bill-friend-or-foe-to-c-w-vjel-the-2008-farm-bill-549-the-farm.jpg)


![[PPT]Submitting a Farm Bill Section 10201 FY12 Suggestion · Web viewAgenda: Overview of the National Program Guidance Six Goal Areas Overarching Categories Metastorm Farm Bill Suggestion](https://img.dokumen.tips/doc/110x75/5b2208827f8b9a5a7f8b456a/pptsubmitting-a-farm-bill-section-10201-fy12-suggestion-web-viewagenda-overview.jpg)


