Embed Size (px)
Citation preview
(c) 2015 Independent SAP Technical User Group Annual Conference, 2015
SQL Anywhere Performance
and Tuning Jason Hinsperger
Sr. Product Manager
SAP
(c) 2015 Independent SAP Technical User Group Annual Conference, 2015
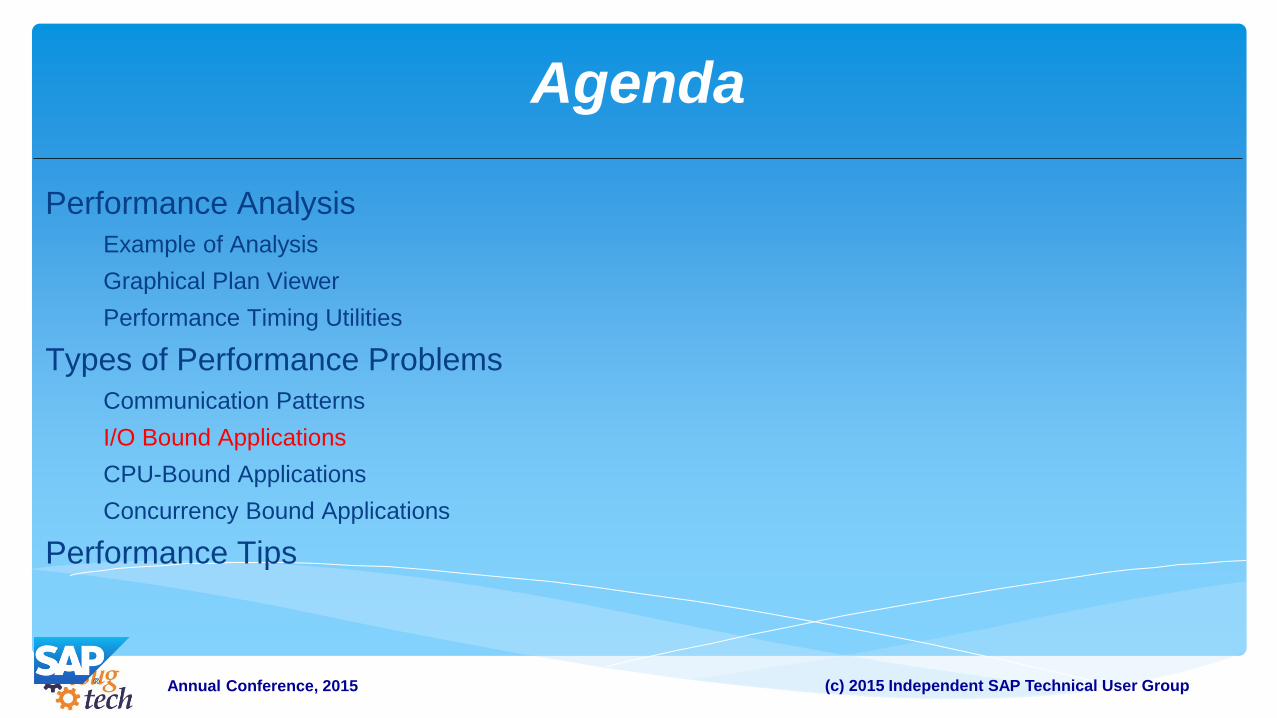
Agenda
Performance Analysis
Example of Analysis
Graphical Plan Viewer
Performance Timing Utilities
Types of Performance Problems
Communication Patterns
I/O Bound Applications
CPU-Bound Applications
Concurrency Bound Applications
Performance Tips
(c) 2015 Independent SAP Technical User Group Annual Conference, 2015
PERFORMANCE ANALYSIS

(c) 2015 Independent SAP Technical User Group Annual Conference, 2015
Primary SQL Anywhere Performance Factors
• Application patterns
• Server cache size
• Current cache contents (cold, warm, hot)
• Server multiprogramming level (-gn/gnh command line switch)
• Number of CPUs available for server thread execution (license dependent)
• Database working set size
• Speed and configuration of the server’s disk subsystem
• Workload characteristics: transaction inter-arrival rate, number of connections, workload mix
• Database page size
• There can be other secondary factors
4
(c) 2015 Independent SAP Technical User Group Annual Conference, 2015
Detecting Performance Problems Systematic approach to the problem: “My application is slow – what do I do!?”
Poor performance happens because some resource is maxed out
o Limiting resource at machine-level:
I/O bandwidth
CPU cycles
o Machine might have more I/O or CPU available in parallel
But server might not be able to use it in parallel concurrency-bound
Several types of bottlenecks:
o Client Application Issues
o IO-Bound
o CPU-Bound
o Concurrency-Bound

(c) 2015 Independent SAP Technical User Group Annual Conference, 2015
SQL Anywhere Performance Analysis Tools
SQL Anywhere Profiling tool
Combines functionality of several separate tools (which can also be used individually)
o Request logging
o Procedure profiling
o Graphical plan capturing
o Index consultant
o Statistics monitoring
Can help determine whether problem is occurring at server or client
Event tracing can be more targeted
Can trace specific events of interest (including graphical plans)
Can use sp_read_etd() from within the server
(c) 2015 Independent SAP Technical User Group Annual Conference, 2015
Agenda
Performance Analysis
Example of Analysis
Graphical Plan Viewer
Performance Timing Utilities
Types of Performance Problems
Communication Patterns
I/O Bound Applications
CPU-Bound Applications
Concurrency Bound Applications
Performance Tips
(c) 2015 Independent SAP Technical User Group Annual Conference, 2015
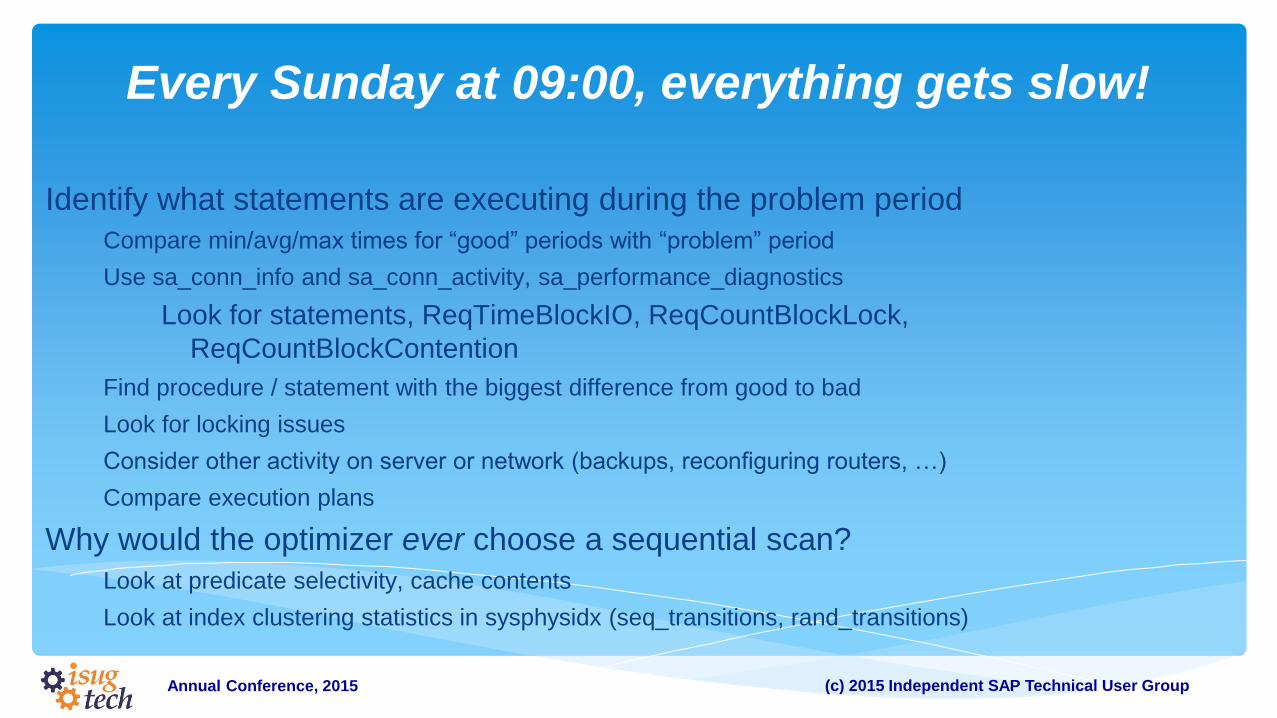
Every Sunday at 09:00, everything gets slow!
Identify what statements are executing during the problem period
Compare min/avg/max times for “good” periods with “problem” period
Use sa_conn_info and sa_conn_activity, sa_performance_diagnostics
Look for statements, ReqTimeBlockIO, ReqCountBlockLock,
ReqCountBlockContention
Find procedure / statement with the biggest difference from good to bad
Look for locking issues
Consider other activity on server or network (backups, reconfiguring routers, …)
Compare execution plans
Why would the optimizer ever choose a sequential scan?
Look at predicate selectivity, cache contents
Look at index clustering statistics in sysphysidx (seq_transitions, rand_transitions)

(c) 2015 Independent SAP Technical User Group Annual Conference, 2015
Agenda
Performance Analysis
Example of Analysis
Graphical Plan Viewer
Performance Timing Utilities
Types of Performance Problems
Communication Patterns
I/O Bound Applications
CPU-Bound Applications
Concurrency Bound Applications
Performance Tips
(c) 2015 Independent SAP Technical User Group Annual Conference, 2015
Graphical Plan Viewer
(c) 2015 Independent SAP Technical User Group Annual Conference, 2015
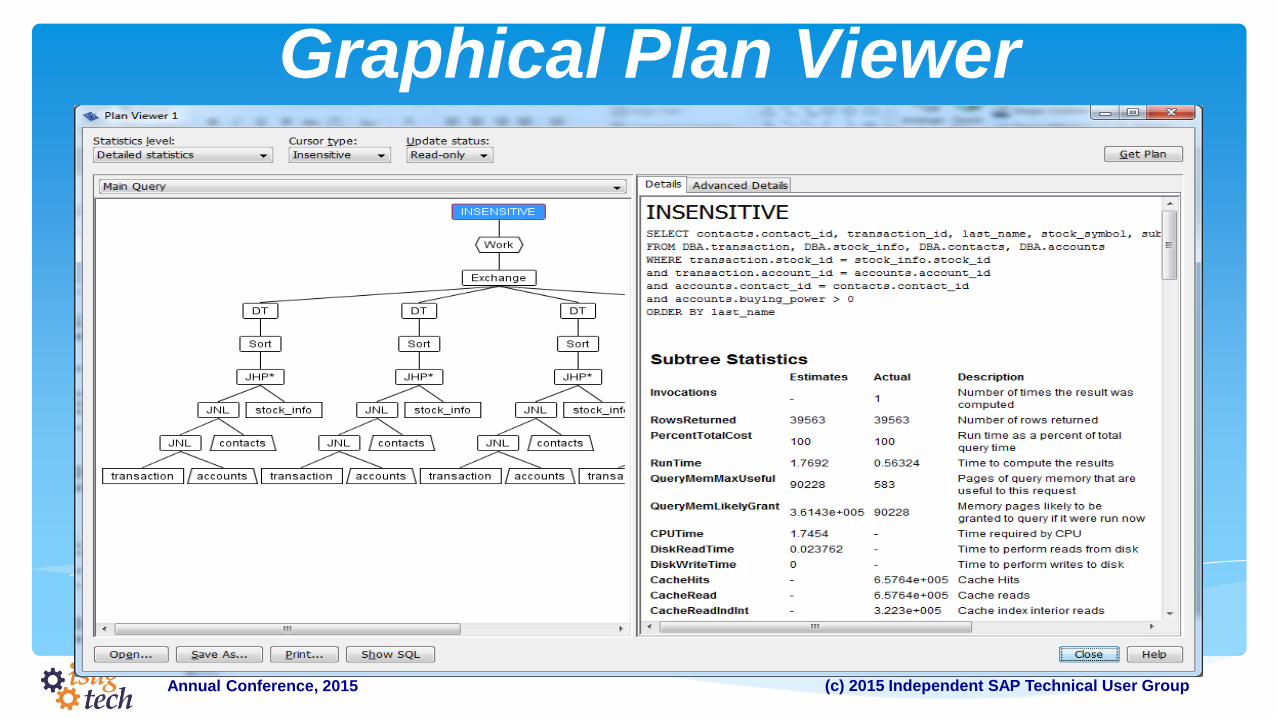
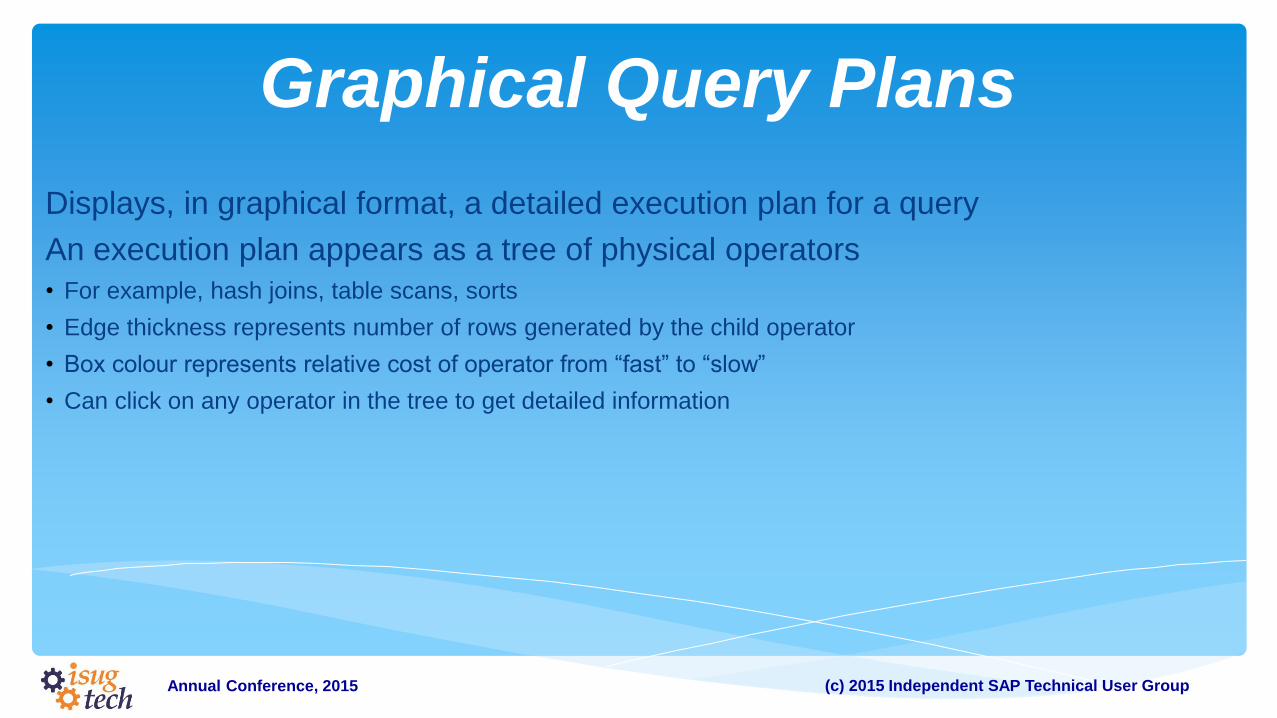
Graphical Query Plans
Displays, in graphical format, a detailed execution plan for a query
An execution plan appears as a tree of physical operators
• For example, hash joins, table scans, sorts
• Edge thickness represents number of rows generated by the child operator
• Box colour represents relative cost of operator from “fast” to “slow”
• Can click on any operator in the tree to get detailed information
(c) 2015 Independent SAP Technical User Group Annual Conference, 2015
Graphical Query Plans
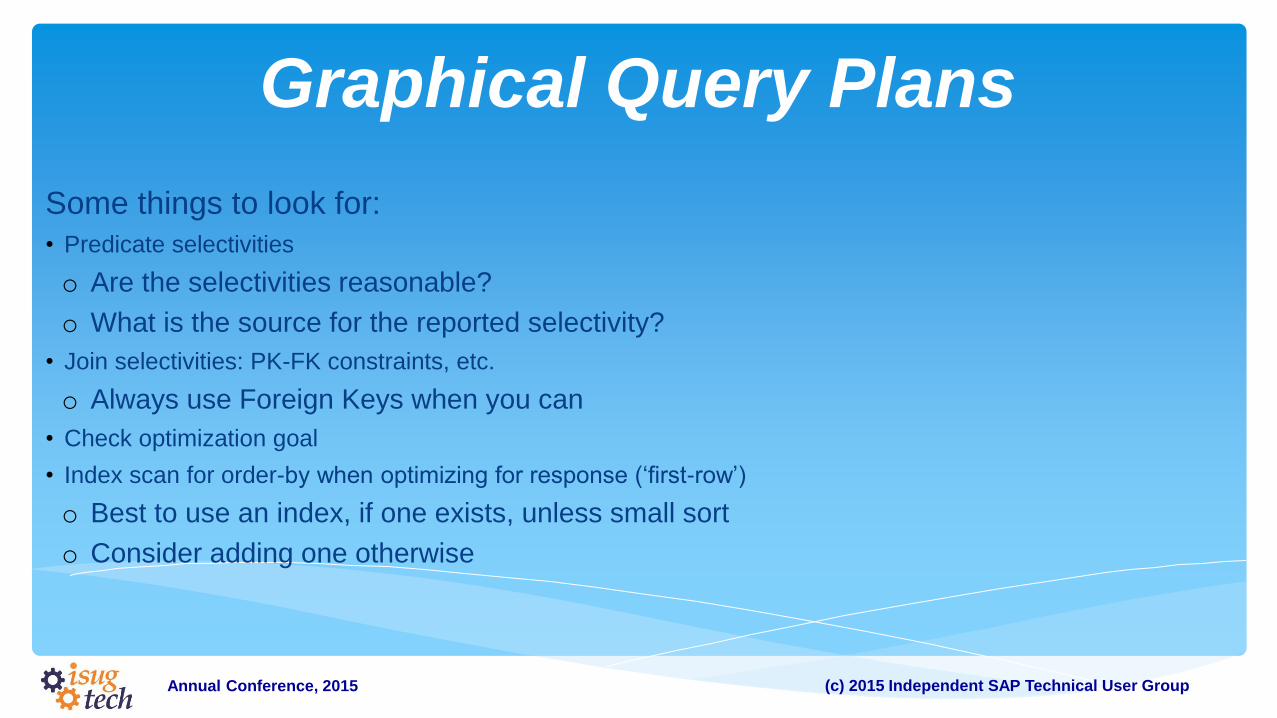
Some things to look for:
• Predicate selectivities
o Are the selectivities reasonable?
o What is the source for the reported selectivity?
• Join selectivities: PK-FK constraints, etc.
o Always use Foreign Keys when you can
• Check optimization goal
• Index scan for order-by when optimizing for response (‘first-row’)
o Best to use an index, if one exists, unless small sort
o Consider adding one otherwise
(c) 2015 Independent SAP Technical User Group Annual Conference, 2015
Graphical Query Plans
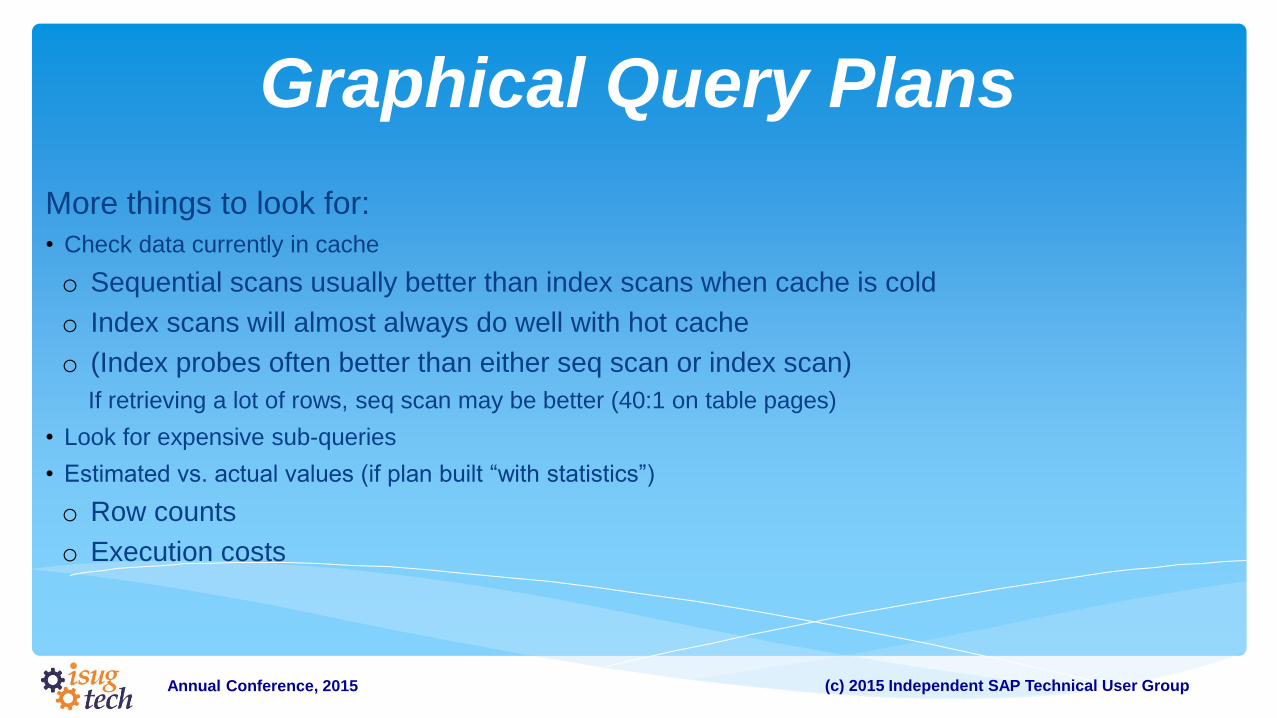
More things to look for:
• Check data currently in cache
o Sequential scans usually better than index scans when cache is cold
o Index scans will almost always do well with hot cache
o (Index probes often better than either seq scan or index scan)
If retrieving a lot of rows, seq scan may be better (40:1 on table pages)
• Look for expensive sub-queries
• Estimated vs. actual values (if plan built “with statistics”)
o Row counts
o Execution costs

(c) 2015 Independent SAP Technical User Group Annual Conference, 2015
Comparing Graphical Plans
Choose two saved
plans
Manually match some
nodes
Highlights differences
Consider cached pages
Look for row count /
selectivities
(c) 2015 Independent SAP Technical User Group Annual Conference, 2015
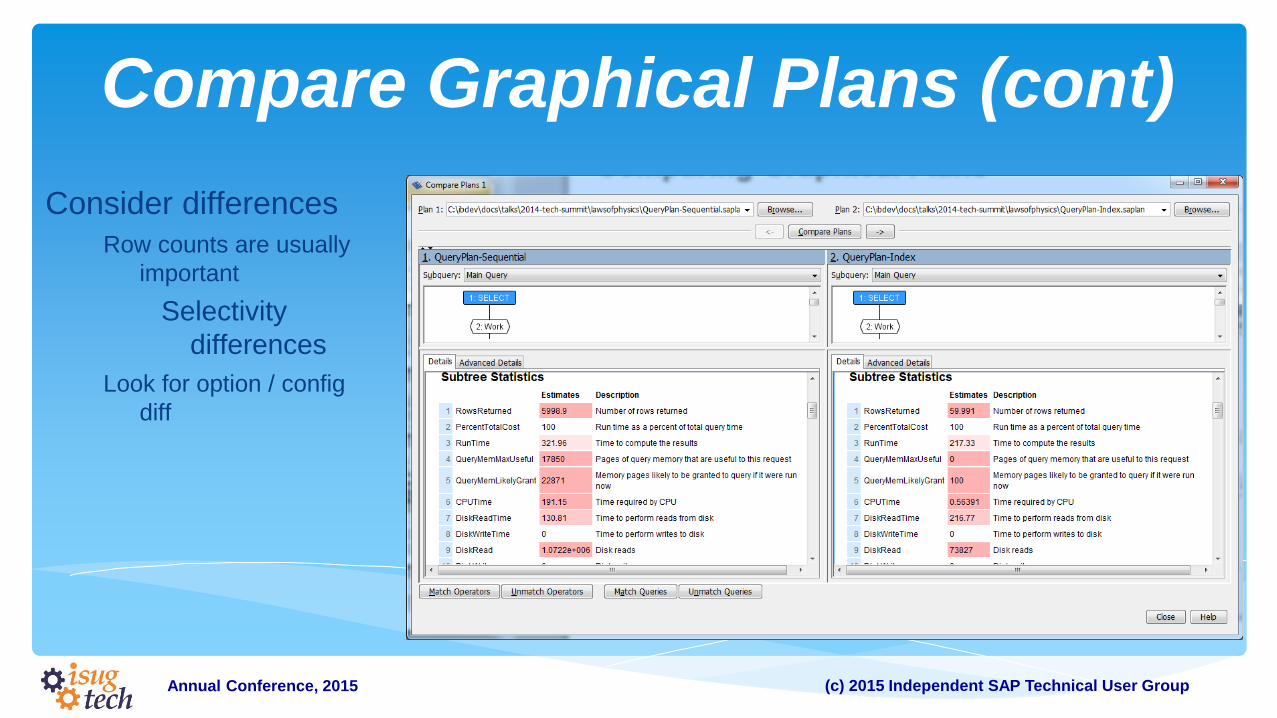
Compare Graphical Plans (cont)
Consider differences
Row counts are usually
important
Selectivity
differences
Look for option / config
diff

(c) 2015 Independent SAP Technical User Group Annual Conference, 2015
Agenda
Performance Analysis
Example of Analysis
Graphical Plan Viewer
Performance Timing Utilities
Types of Performance Problems
Communication Patterns
I/O Bound Applications
CPU-Bound Applications
Concurrency Bound Applications
Performance Tips

(c) 2015 Independent SAP Technical User Group Annual Conference, 2015
Performance Timing Utilities
What?
• Some utilities available for testing performance
• Provide an indication of “laws of physics” given the server and db configurations
When?
• Use these tools, not graphical plan with statistics, for accurate timings
How?
• Available in %SQLANYSAMP16%
• Complete documentation in Readme.txt in the same folder as the utility
(c) 2015 Independent SAP Technical User Group Annual Conference, 2015
The dbping System Utility
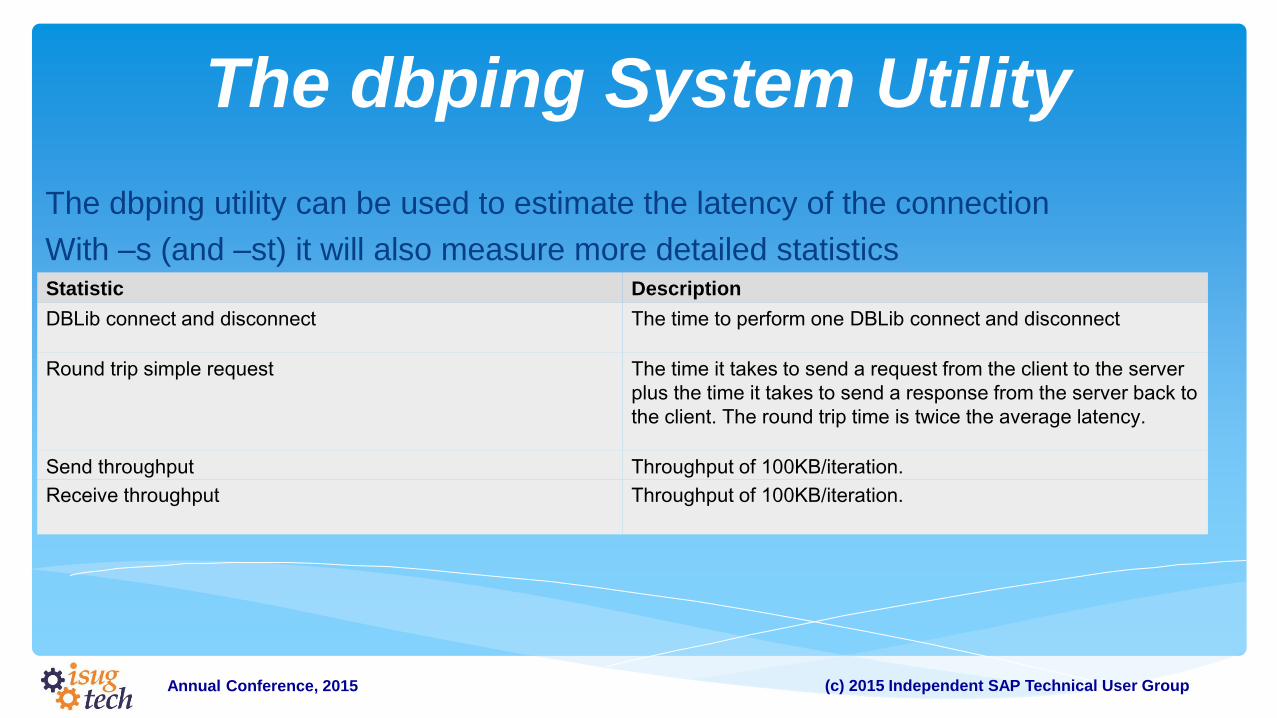
The dbping utility can be used to estimate the latency of the connection
With –s (and –st) it will also measure more detailed statistics Statistic Description
DBLib connect and disconnect The time to perform one DBLib connect and disconnect
Round trip simple request The time it takes to send a request from the client to the server
plus the time it takes to send a response from the server back to
the client. The round trip time is twice the average latency.
Send throughput Throughput of 100KB/iteration.
Receive throughput Throughput of 100KB/iteration.

(c) 2015 Independent SAP Technical User Group Annual Conference, 2015
Testing Query Performance
Fetchtst (or odbcfet) • \Samples\SQLAnywhere\PerformanceFetch
• Measures fetch rates for an arbitrary query
• Put arbitrary queries in a file (test.sql, by default) separated by “go”
o Often SELECT statements are used but update and insert works too
Useful switches • -ga – measures several useful statistics
• -j nnn – repeat the file several times (or –js for each statement)
• -p – print the plan (can show plan changes for one query)
• -i – think time
Try to match your configuration when testing • Isolation, cursor type, prefetch, connection
(c) 2015 Independent SAP Technical User Group Annual Conference, 2015
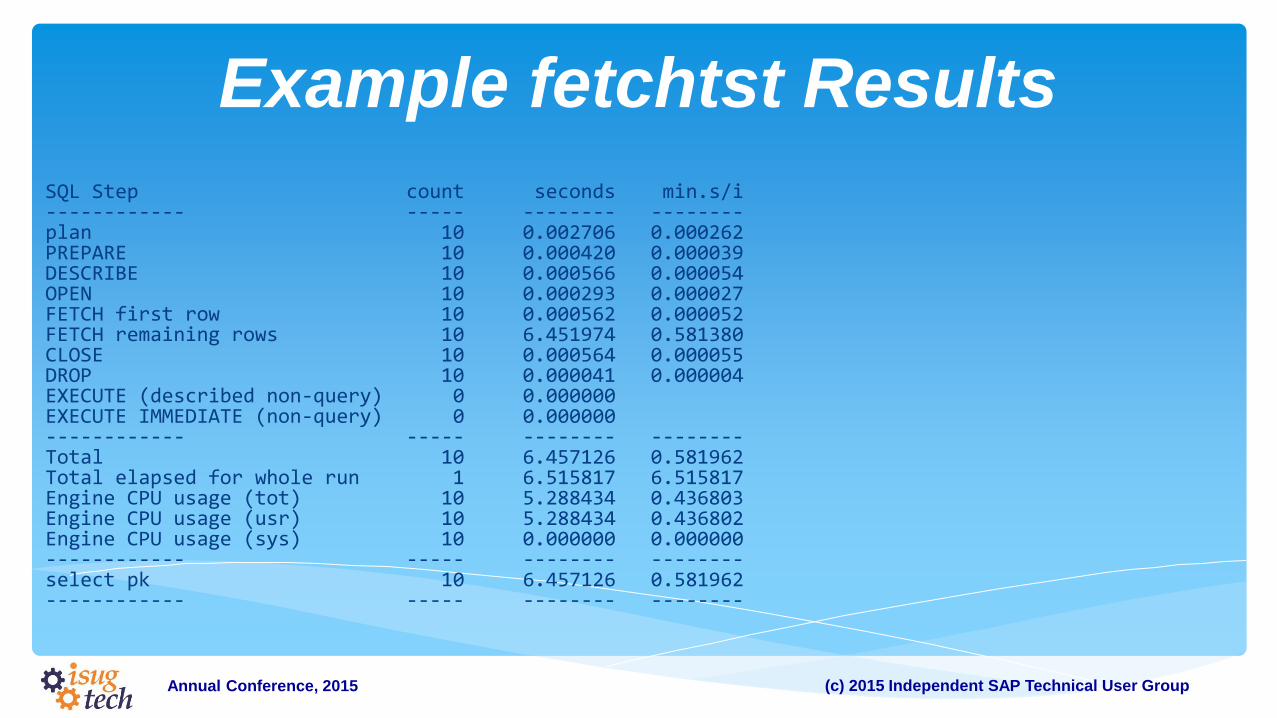
Example fetchtst Results
SQL Step count seconds min.s/i ------------ ----- -------- -------- plan 10 0.002706 0.000262 PREPARE 10 0.000420 0.000039 DESCRIBE 10 0.000566 0.000054 OPEN 10 0.000293 0.000027 FETCH first row 10 0.000562 0.000052 FETCH remaining rows 10 6.451974 0.581380 CLOSE 10 0.000564 0.000055 DROP 10 0.000041 0.000004 EXECUTE (described non-query) 0 0.000000 EXECUTE IMMEDIATE (non-query) 0 0.000000 ------------ ----- -------- -------- Total 10 6.457126 0.581962 Total elapsed for whole run 1 6.515817 6.515817 Engine CPU usage (tot) 10 5.288434 0.436803 Engine CPU usage (usr) 10 5.288434 0.436802 Engine CPU usage (sys) 10 0.000000 0.000000 ------------ ----- -------- -------- select pk 10 6.457126 0.581962 ------------ ----- -------- --------
(c) 2015 Independent SAP Technical User Group Annual Conference, 2015
Testing Insert Performance
Instest
• \Samples\SQLAnywhere\PerformanceInsert
• Measures insert performance for a table
• Reads query from a file
• Uses PUT to insert rows
Try to match your configuration
• Commit frequency
• Insert width (rows to insert per request)
• Pre-grow database file and ensure it is contiguous
(c) 2015 Independent SAP Technical User Group Annual Conference, 2015
Performance Timing Utilities
Trantest
• \Samples\SQLAnywhere\PerformanceTransaction
• Measures the load that can be handled by a given server configuration given a database design and a set of
transactions.
• Simulates a number of client machines running transactions against the server
• Define what transactions to execute
• Can run on multiple client machines: master/slave
(c) 2015 Independent SAP Technical User Group Annual Conference, 2015
TYPES OF PERFORMANCE
PROBLEMS
(c) 2015 Independent SAP Technical User Group Annual Conference, 2015
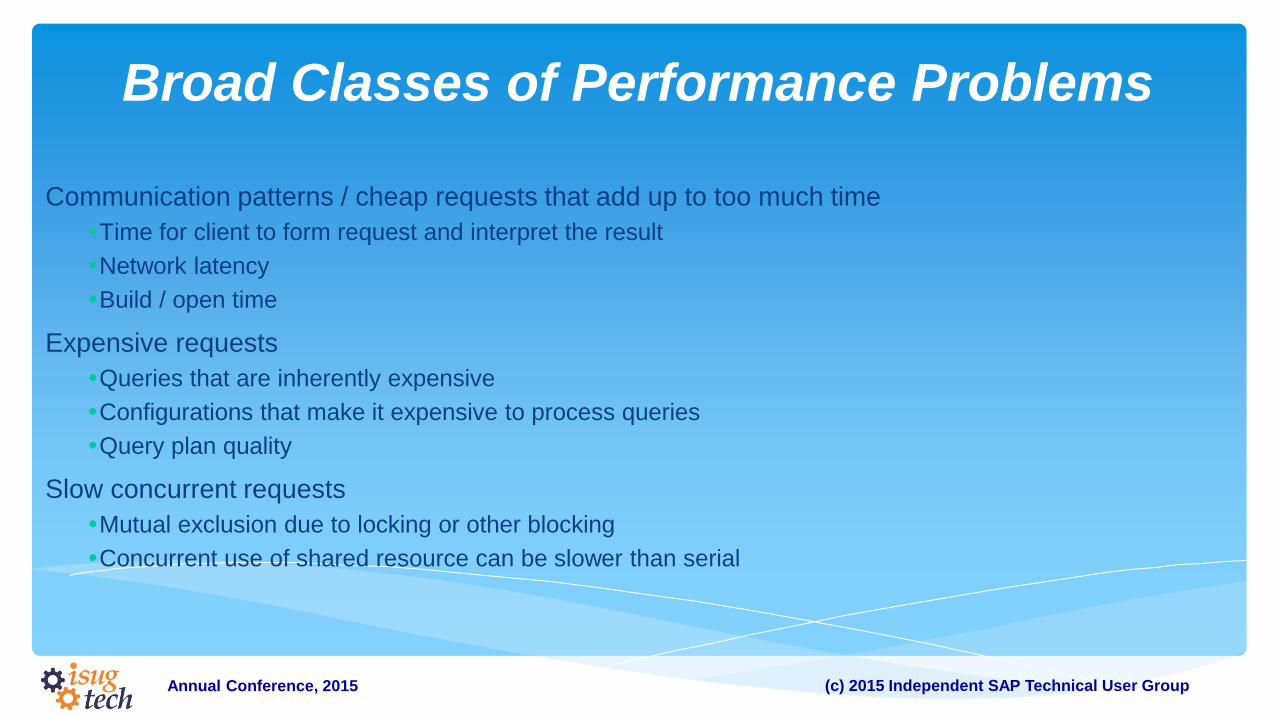
Broad Classes of Performance Problems
Communication patterns / cheap requests that add up to too much time
Time for client to form request and interpret the result
Network latency
Build / open time
Expensive requests
Queries that are inherently expensive
Configurations that make it expensive to process queries
Query plan quality
Slow concurrent requests
Mutual exclusion due to locking or other blocking
Concurrent use of shared resource can be slower than serial

(c) 2015 Independent SAP Technical User Group Annual Conference, 2015
Rough Categorization of a Workload
Estimate (total time / # requests)
• If average request time is < 100ms, probably an issue with cheap requests
Use –zt server option and dbo.sa_performance_diagnostics()
• If ReqTimeActive or ReqTimeBlockIO high – expensive requests
• If ReqTimeBlockLock or ReqTimeBlockContention high – Slow concurrent requests
If performance of one query varies substantially with identical parameters, it may be
query plan differences
• Make sure to rule out differences in cache contents, concurrent activity, …
• If the period is about 11 executions, could be related to plan caching
(c) 2015 Independent SAP Technical User Group Annual Conference, 2015
Agenda
Performance Analysis
Example of Analysis
Graphical Plan Viewer
Performance Timing Utilities
Types of Performance Problems
Communication Patterns
I/O Bound Applications
CPU-Bound Applications
Concurrency Bound Applications
Performance Tips
(c) 2015 Independent SAP Technical User Group Annual Conference, 2015
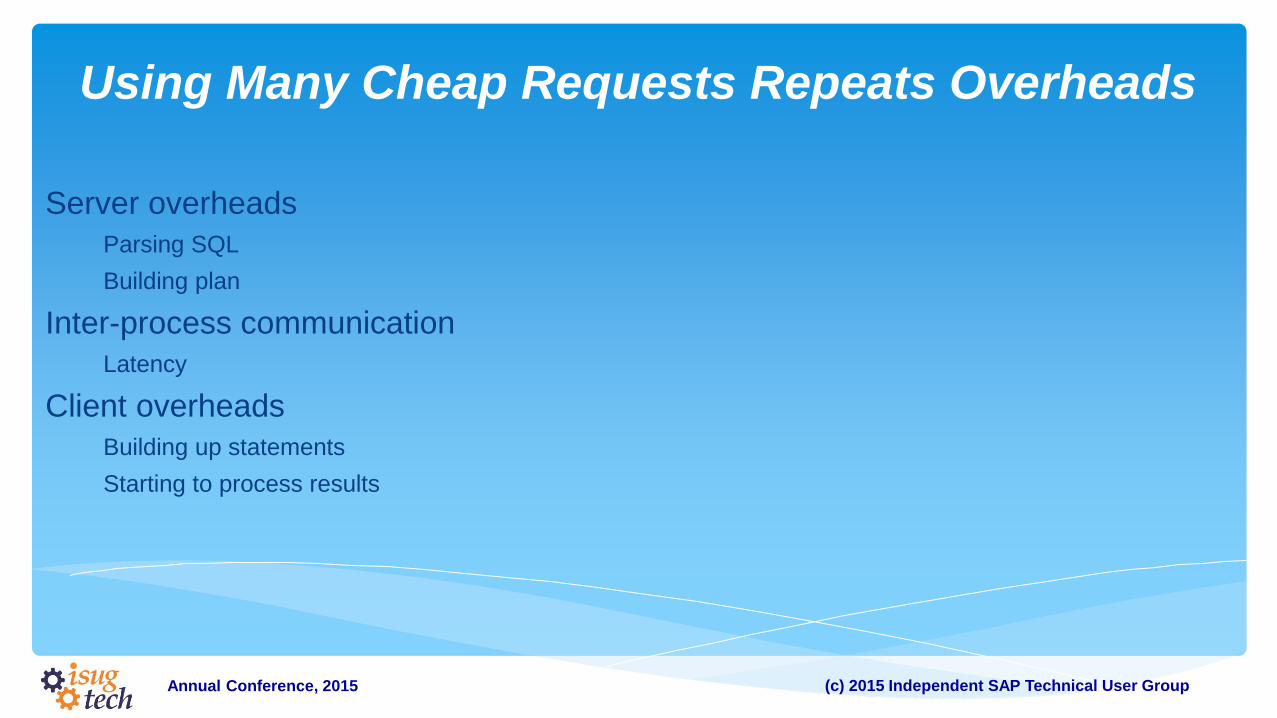
Using Many Cheap Requests Repeats Overheads
Server overheads
Parsing SQL
Building plan
Inter-process communication
Latency
Client overheads
Building up statements
Starting to process results
(c) 2015 Independent SAP Technical User Group Annual Conference, 2015
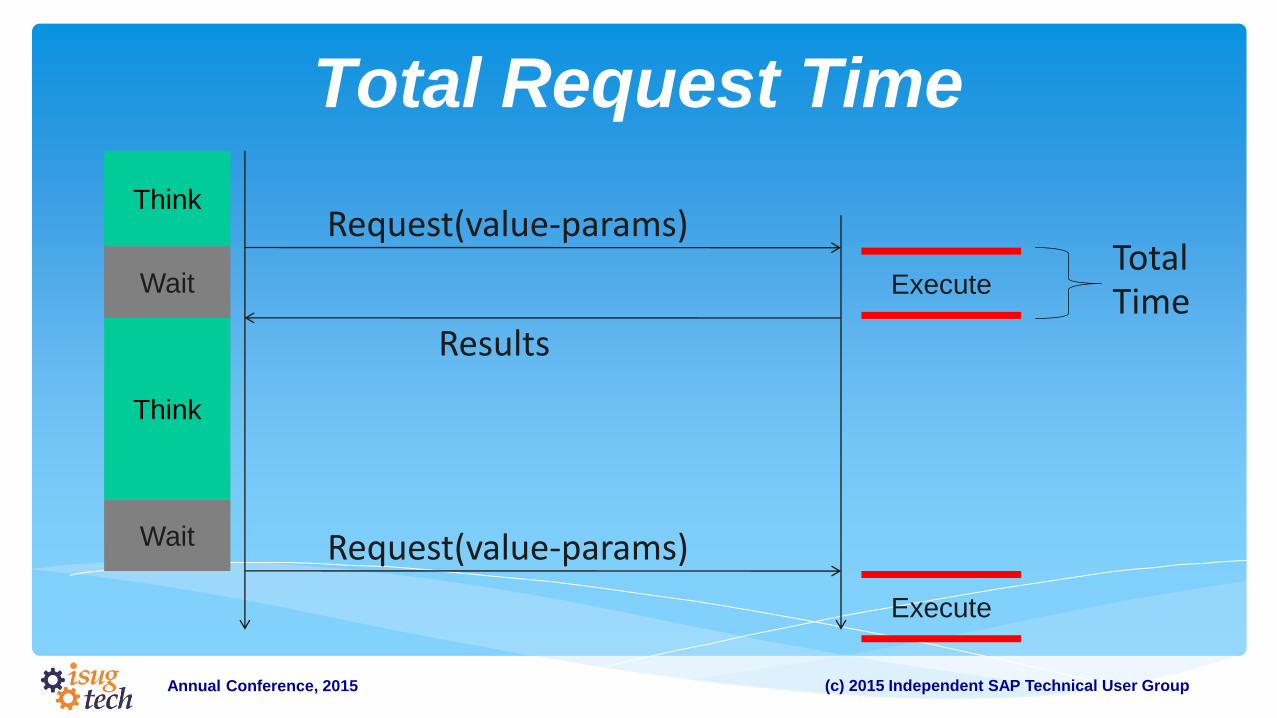
Total Request Time
Request(value-params)
Results
Think
Think
Execute Wait
Wait Request(value-params)
Execute
Total Time
(c) 2015 Independent SAP Technical User Group Annual Conference, 2015
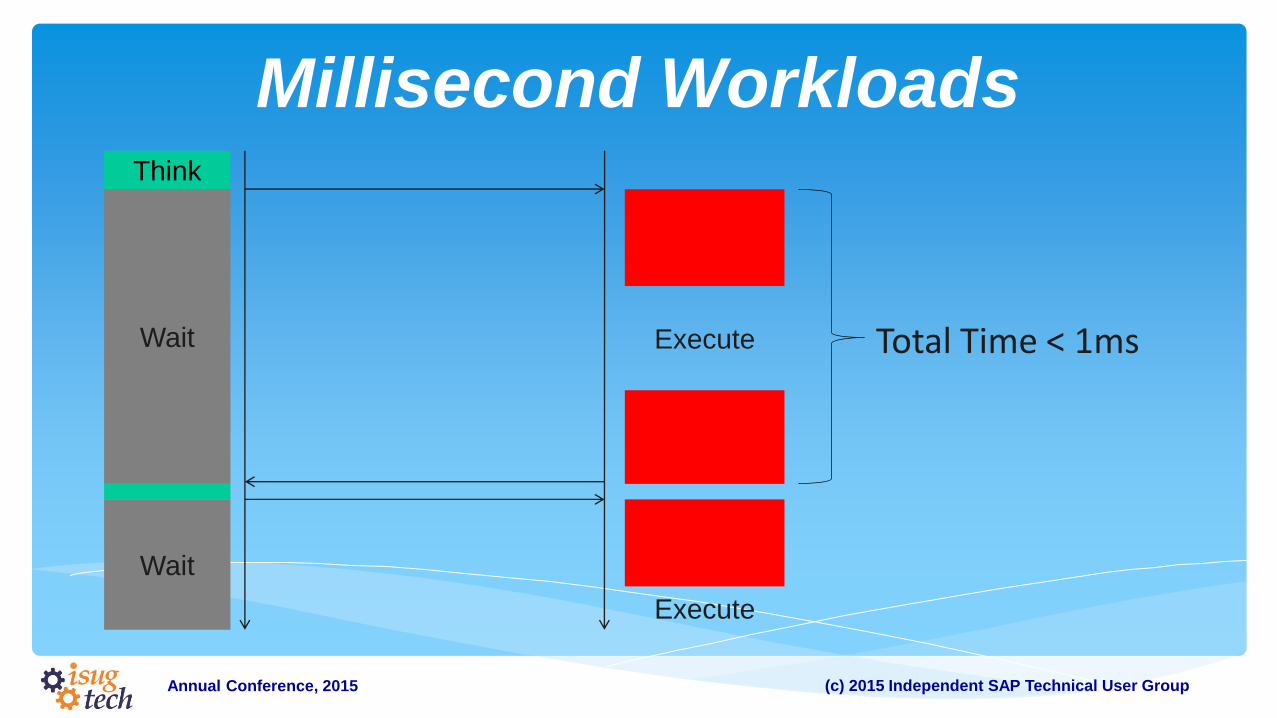
Millisecond Workloads Think
Execute Wait
Wait
Total Time < 1ms
Execute
(c) 2015 Independent SAP Technical User Group Annual Conference, 2015
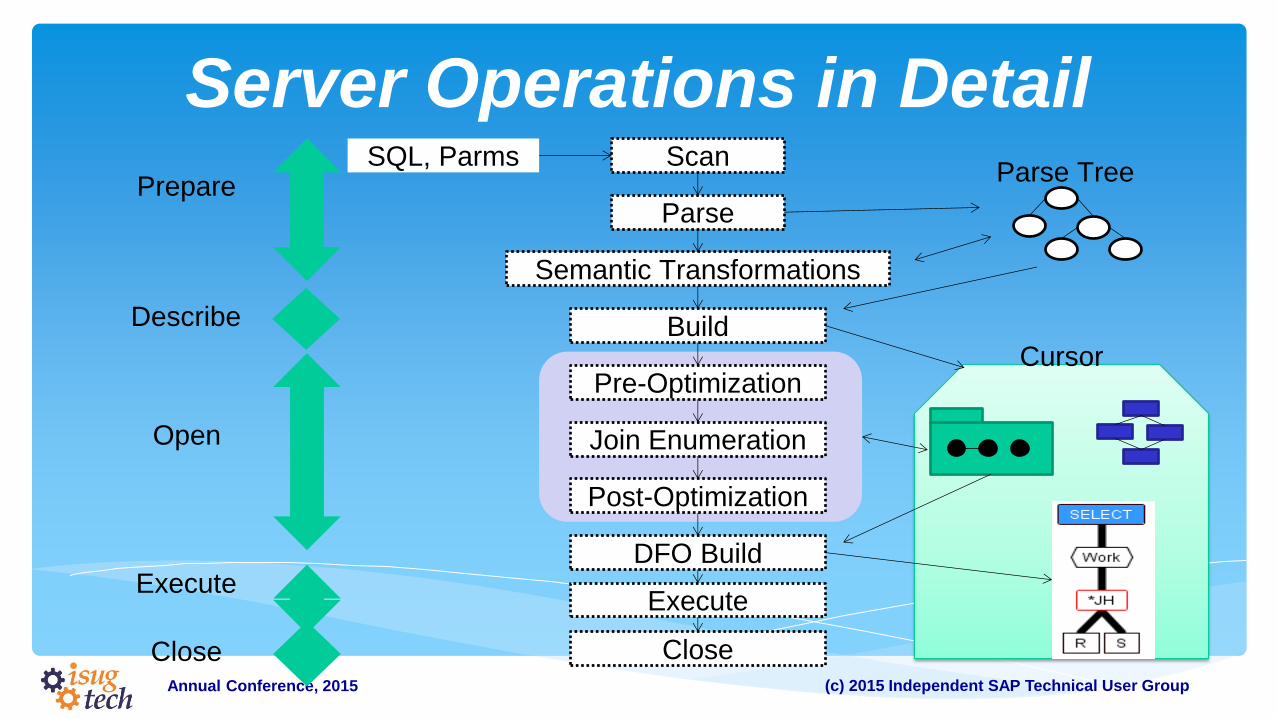
Server Operations in Detail
Build
Execute
Close
Pre-Optimization
Scan SQL, Parms
Parse
Semantic Transformations
Prepare Parse Tree
Cursor
Join Enumeration
DFO Build
Open
Execute
Close
Describe
Post-Optimization
(c) 2015 Independent SAP Technical User Group Annual Conference, 2015
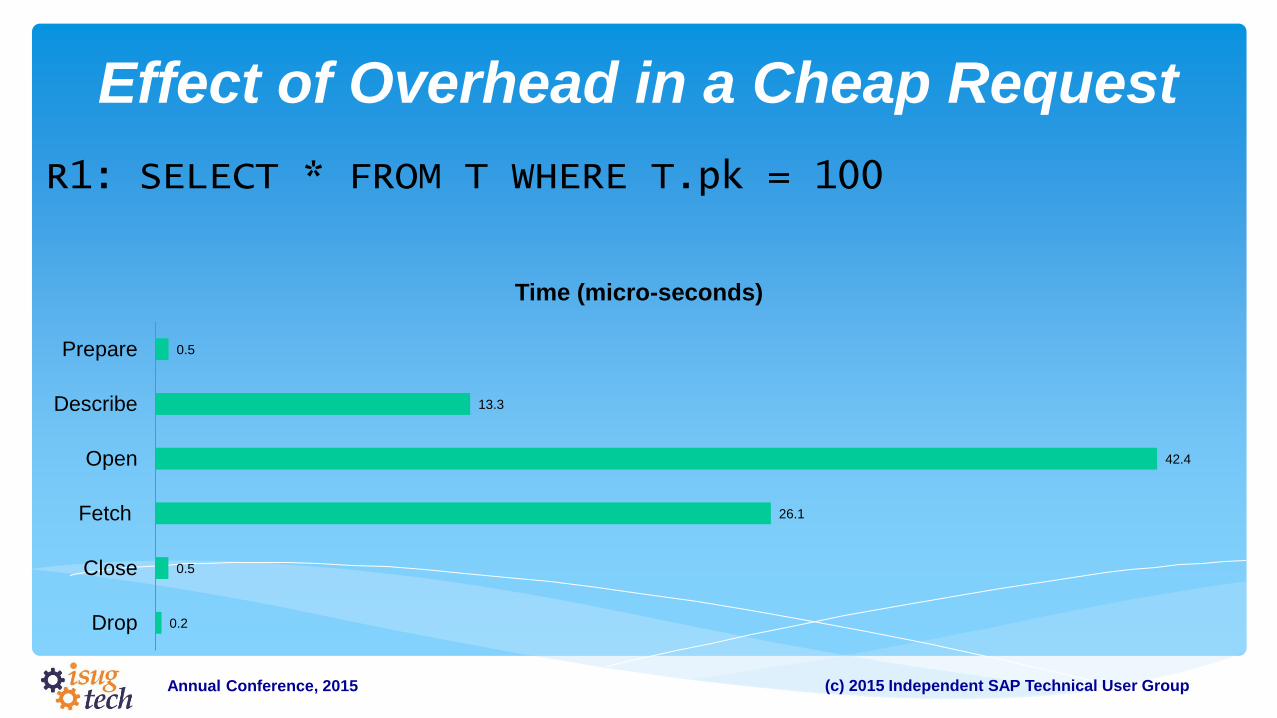
Effect of Overhead in a Cheap Request
0.2
0.5
26.1
42.4
13.3
0.5
Drop
Close
Fetch
Open
Describe
Prepare
Time (micro-seconds)
R1: SELECT * FROM T WHERE T.pk = 100
(c) 2015 Independent SAP Technical User Group Annual Conference, 2015
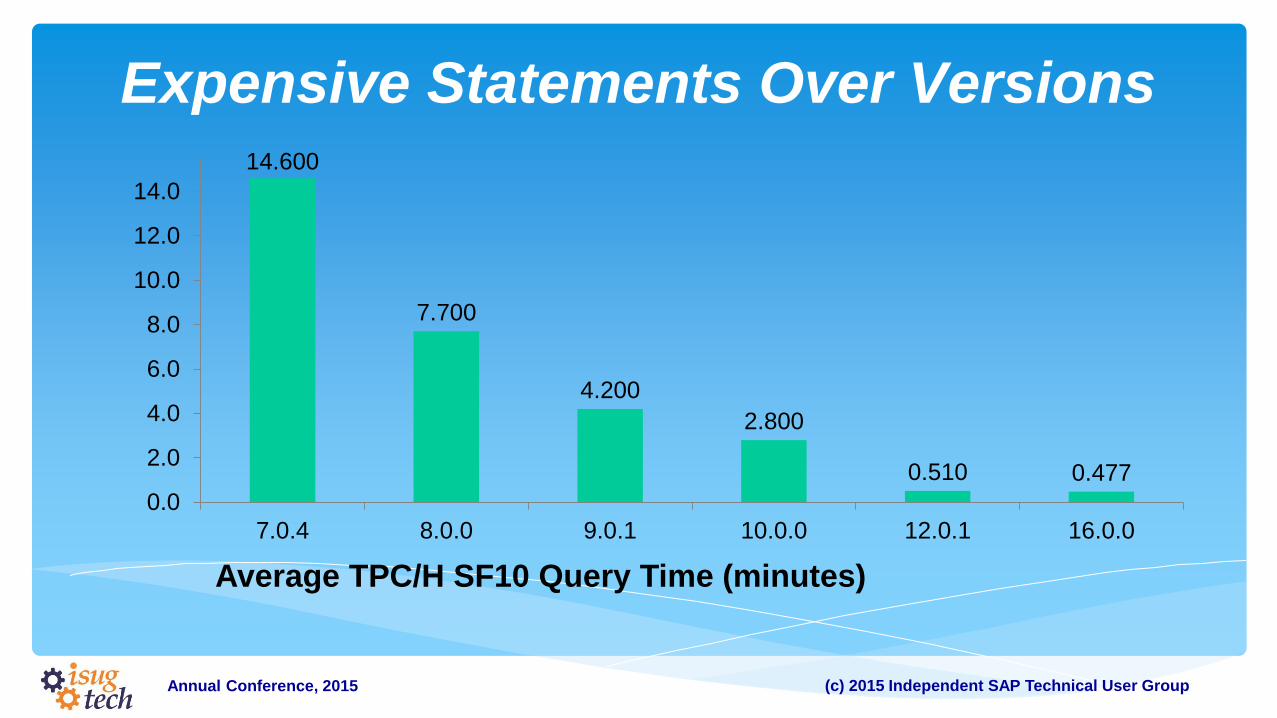
Expensive Statements Over Versions 14.600
7.700
4.200
2.800
0.510 0.477
0.0
2.0
4.0
6.0
8.0
10.0
12.0
14.0
7.0.4 8.0.0 9.0.1 10.0.0 12.0.1 16.0.0
Average TPC/H SF10 Query Time (minutes)
(c) 2015 Independent SAP Technical User Group Annual Conference, 2015
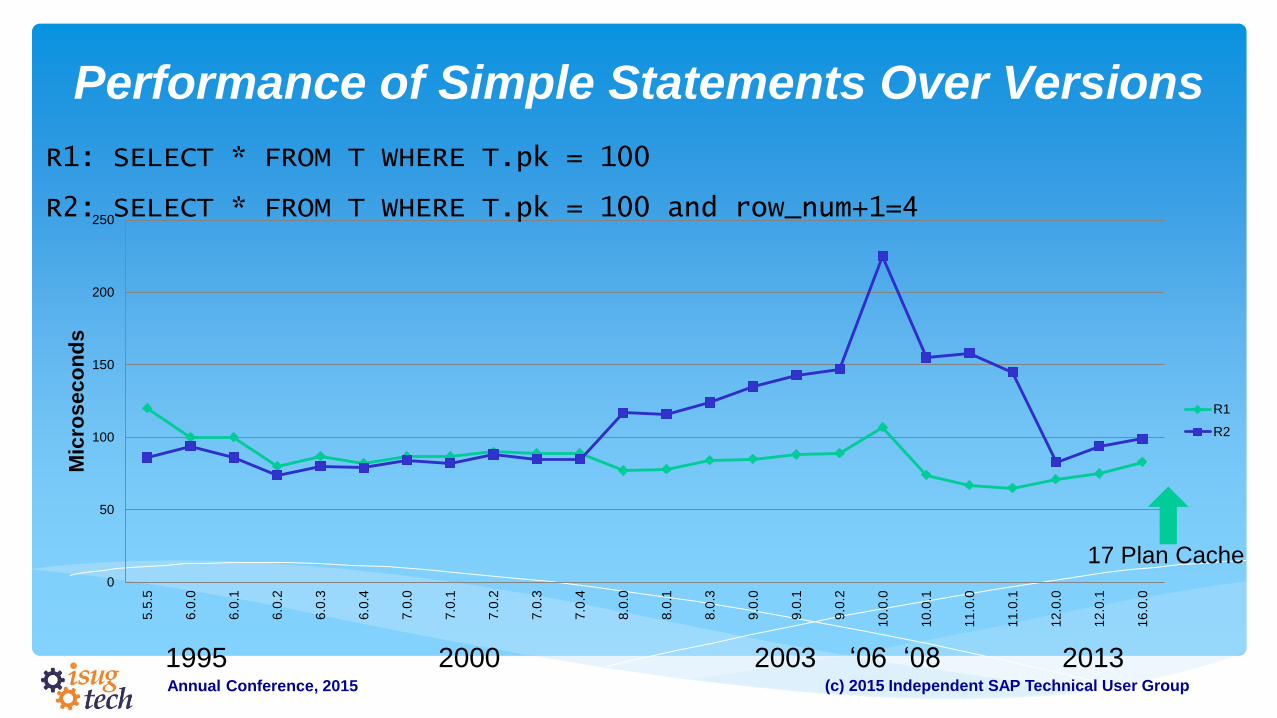
Performance of Simple Statements Over Versions
0
50
100
150
200
250
5.5
.5
6.0
.0
6.0
.1
6.0
.2
6.0
.3
6.0
.4
7.0
.0
7.0
.1
7.0
.2
7.0
.3
7.0
.4
8.0
.0
8.0
.1
8.0
.3
9.0
.0
9.0
.1
9.0
.2
10
.0.0
10
.0.1
11
.0.0
11
.0.1
12
.0.0
12
.0.1
16
.0.0
Mic
roseco
nd
s
R1
R2
R1: SELECT * FROM T WHERE T.pk = 100
R2: SELECT * FROM T WHERE T.pk = 100 and row_num+1=4
1995 2000 2003 ‘06 2013 ‘08
17 Plan Cache
(c) 2015 Independent SAP Technical User Group Annual Conference, 2015
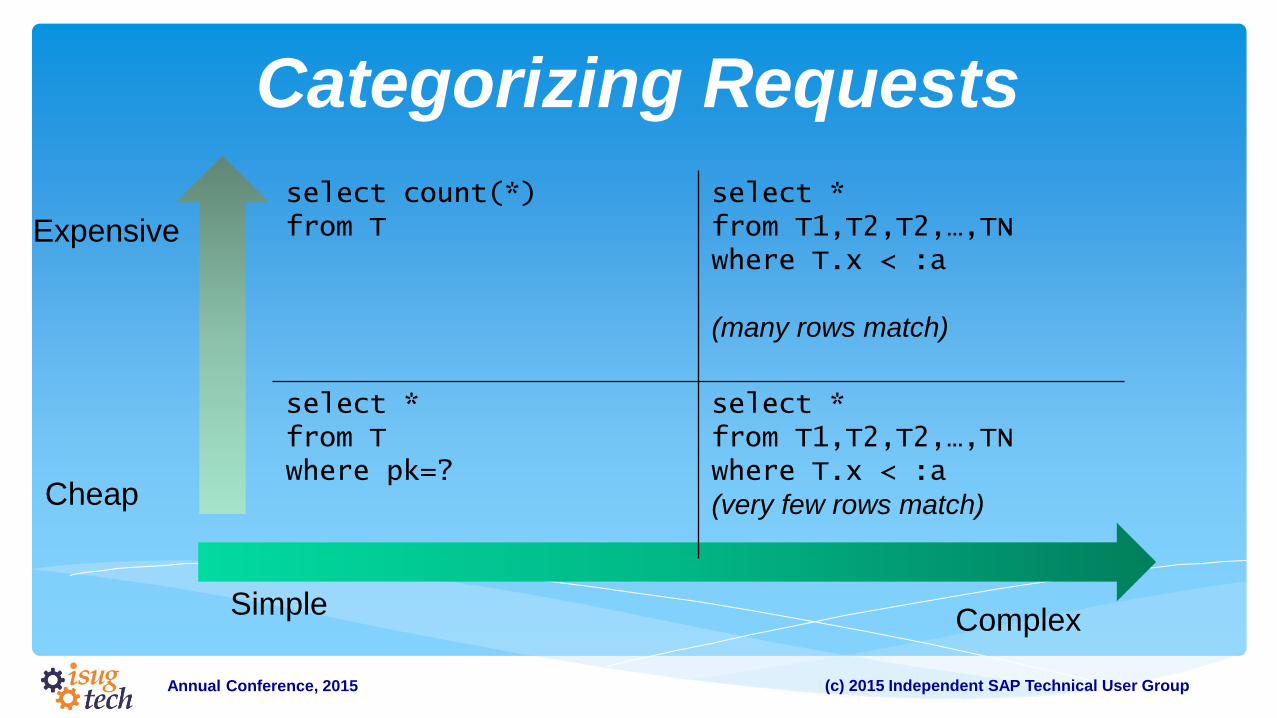
Categorizing Requests
Simple Complex
Cheap
Expensive
select count(*) from T
select * from T1,T2,T2,…,TN where T.x < :a (many rows match)
select * from T where pk=?
select * from T1,T2,T2,…,TN where T.x < :a (very few rows match)
(c) 2015 Independent SAP Technical User Group Annual Conference, 2015
Agenda
Performance Analysis
Example of Analysis
Graphical Plan Viewer
Performance Timing Utilities
Types of Performance Problems
Communication Patterns
I/O Bound Applications
CPU-Bound Applications
Concurrency Bound Applications
Performance Tips
(c) 2015 Independent SAP Technical User Group Annual Conference, 2015
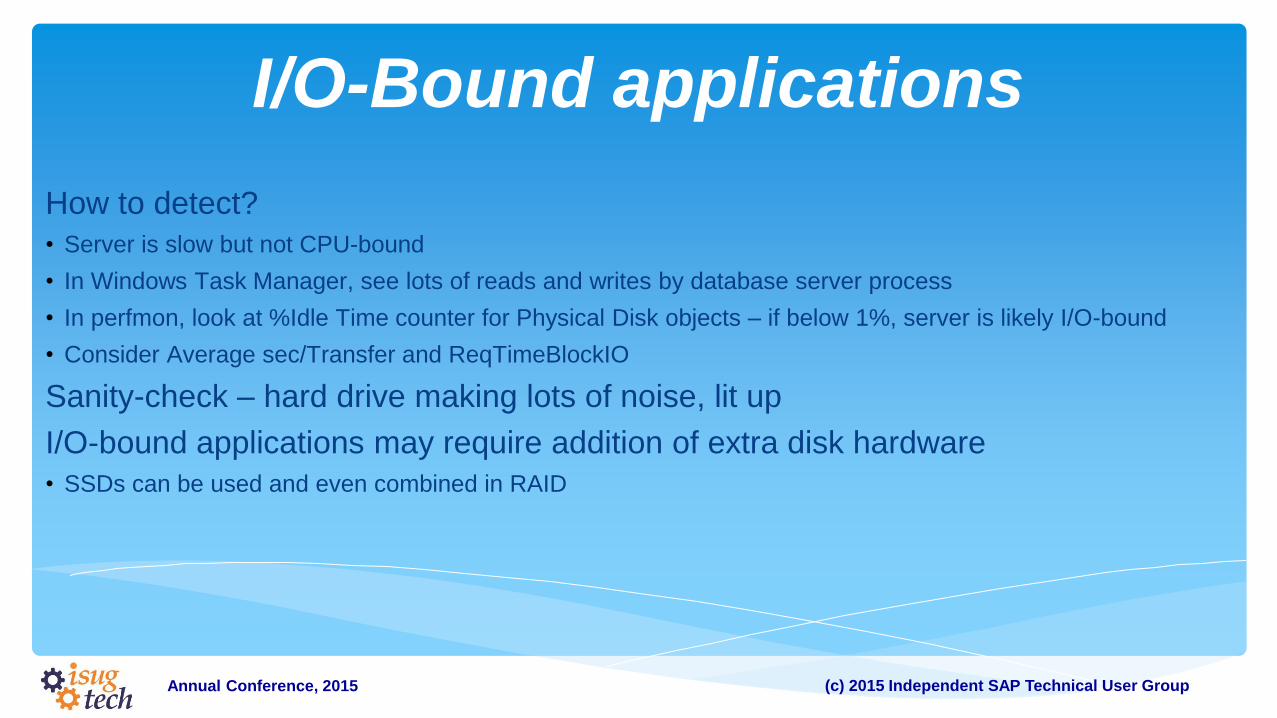
I/O-Bound applications
How to detect?
• Server is slow but not CPU-bound
• In Windows Task Manager, see lots of reads and writes by database server process
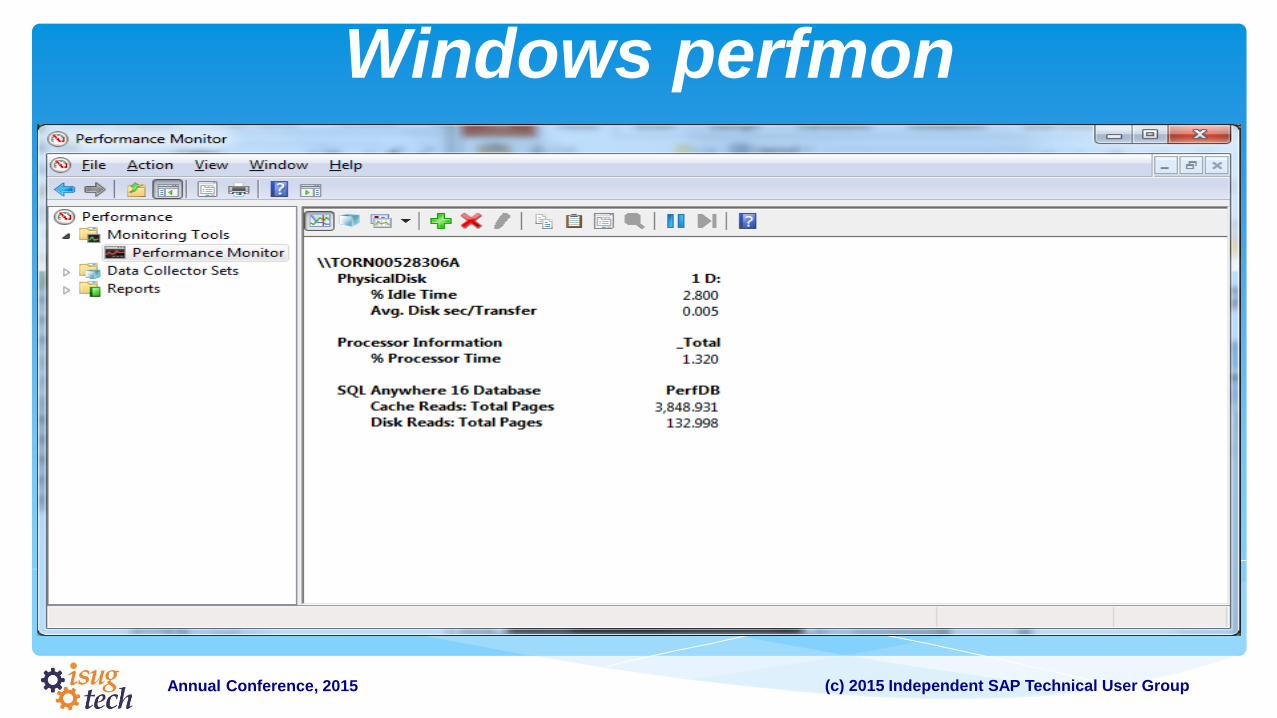
• In perfmon, look at %Idle Time counter for Physical Disk objects – if below 1%, server is likely I/O-bound
• Consider Average sec/Transfer and ReqTimeBlockIO
Sanity-check – hard drive making lots of noise, lit up
I/O-bound applications may require addition of extra disk hardware
• SSDs can be used and even combined in RAID
(c) 2015 Independent SAP Technical User Group Annual Conference, 2015
Windows perfmon
(c) 2015 Independent SAP Technical User Group Annual Conference, 2015
Cache Size Too Small
If server can’t keep frequently-used database pages in buffer pool, thrashing occurs
Can detect using SQL Anywhere counters in perfmon or tracing:
• CacheReadTable vs. DiskReadTable
• CacheReadIndex vs. DiskReadIndex
These counters are absolute values, so look at growth over a fixed period of time
• Should see CacheReadTable grow more than 10 times faster than DiskReadTable, CacheReadIndex more
than 100 times faster
• If not, indication that cache size may be too small
(c) 2015 Independent SAP Technical User Group Annual Conference, 2015
Missing Indexes
Properly tuned indexes can greatly reduce I/O requirements
• Read only the rows needed to satisfy a query, rather than all rows
Best way to investigate is with Index Consultant
• Available from SC Profiling Mode or DBISQL
• Can also experiment manually with Index Consultant using CREATE VIRTUAL INDEX statement
• Inspect application queries
Clustering of indexes is also important
• Compare the clustering statistics in sys.sysphysidx to the clustered_index_id of systab
(c) 2015 Independent SAP Technical User Group Annual Conference, 2015
Query Processing Memory
Server may not have enough memory to process queries using regular methods,
causing it to use expensive low-memory strategies
• Special case of cache that is too small
• Likely cause – very high -gn value (above 100) and small cache size
o Make sure you really need such a high value if you use it
If this is the problem you may see in profiling mode that queries identified as
expensive don’t use hash operators
• Or, if they do use them, the operator details indicate reversion to low memory strategies, or multiple passes
• Compare QueryMemMaxUseful to QueryMemLikelyGrant
Check max_statement_count/max_cursor_count options for handle leaks
(c) 2015 Independent SAP Technical User Group Annual Conference, 2015
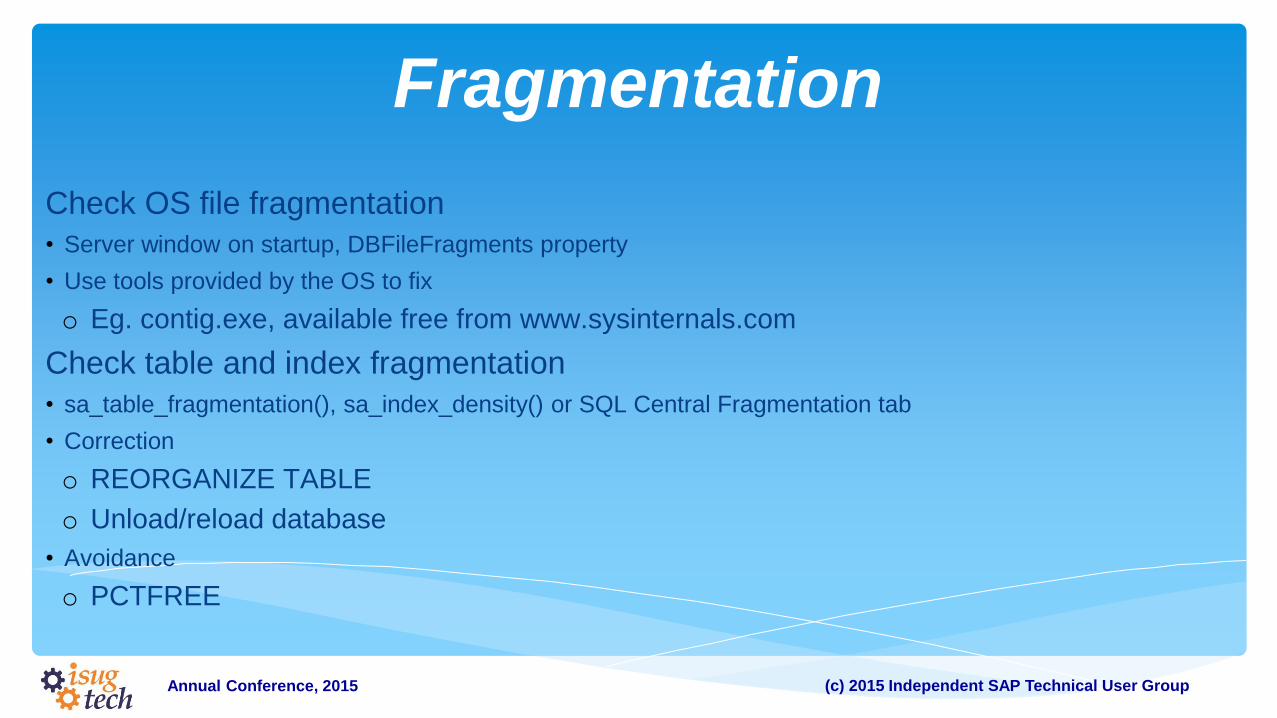
Fragmentation
Check OS file fragmentation
• Server window on startup, DBFileFragments property
• Use tools provided by the OS to fix
o Eg. contig.exe, available free from www.sysinternals.com
Check table and index fragmentation
• sa_table_fragmentation(), sa_index_density() or SQL Central Fragmentation tab
• Correction
o REORGANIZE TABLE
o Unload/reload database
• Avoidance
o PCTFREE
(c) 2015 Independent SAP Technical User Group Annual Conference, 2015
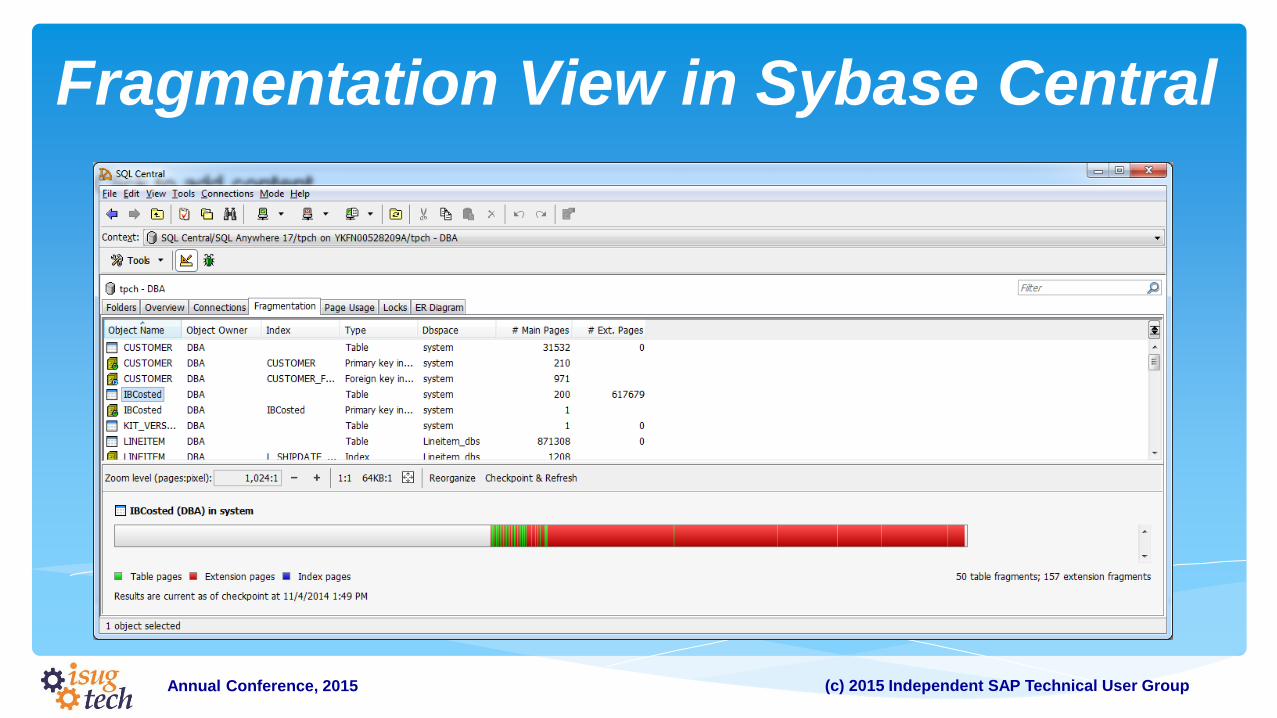
Fragmentation View in Sybase Central
(c) 2015 Independent SAP Technical User Group Annual Conference, 2015
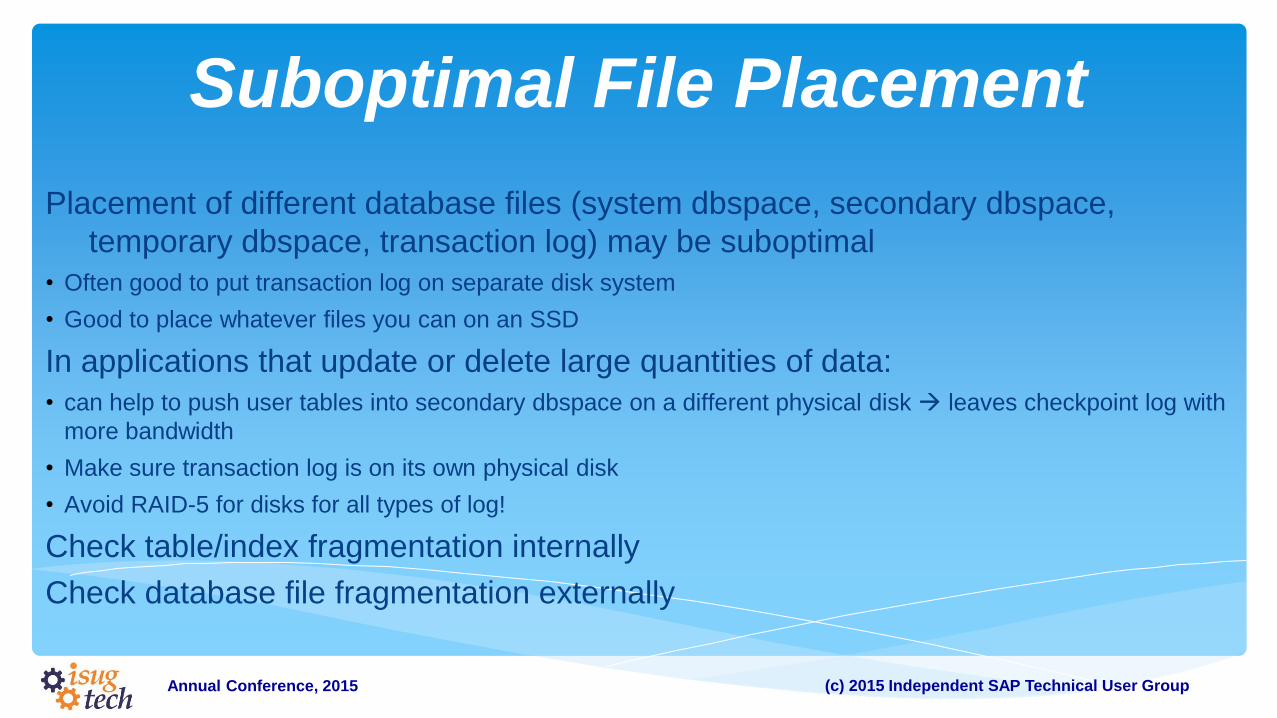
Suboptimal File Placement
Placement of different database files (system dbspace, secondary dbspace,
temporary dbspace, transaction log) may be suboptimal
• Often good to put transaction log on separate disk system
• Good to place whatever files you can on an SSD
In applications that update or delete large quantities of data:
• can help to push user tables into secondary dbspace on a different physical disk leaves checkpoint log with
more bandwidth
• Make sure transaction log is on its own physical disk
• Avoid RAID-5 for disks for all types of log!
Check table/index fragmentation internally
Check database file fragmentation externally
(c) 2015 Independent SAP Technical User Group Annual Conference, 2015
Agenda
Performance Analysis
Example of Analysis
Graphical Plan Viewer
Performance Timing Utilities
Types of Performance Problems
Communication Patterns
I/O Bound Applications
CPU-Bound Applications
Concurrency Bound Applications
Performance Tips
(c) 2015 Independent SAP Technical User Group Annual Conference, 2015
CPU-Bound Applications
Computation and memory access dominating
Good news – easy to detect!
Bad news – many possible causes…
How to detect?
• CPU above 98% use for all CPUs assigned to server process
• Task Manager shows server process consuming all available CPUs assigned to it
• Make sure no other applications are competing for large amounts of CPU
• Watch out for a system that has 1/N % of CPU in use (no parallelism)

(c) 2015 Independent SAP Technical User Group Annual Conference, 2015
Suboptimal Query Plans
Optimizer is choosing one or more access plans that are substantially poorer than
the optimal plan
Most common causes:
• Outdated optimizer statistics
• Incorrect setting of OPTIMIZATION_GOAL option
• Missing indexes (with large enough buffer pool)
To analyze:
• Capture plans with statistics, either manually with DBISQL, or from a tracing session
• Look for slow queries
• Look for query operators where estimated number of rows or cost vary drastically from actual values
(c) 2015 Independent SAP Technical User Group Annual Conference, 2015
Suboptimal Queries
Optimizer does the best it can, but sometimes is faced with queries that make it
hard to do its job
Basic cause: server is being asked to compute more data than you really need
Some common types:
• Asking for extra columns in a result set that you don’t use
• Frequent calling of user-defined functions (in a predicate, for example) or that have queries in them that tie the
hands of the optimizer
• Failing to specify READ ONLY access for queries that are not used for update
• nested correlated subqueries -- consider the use of WINDOW functions
(c) 2015 Independent SAP Technical User Group Annual Conference, 2015
Optimization Goal
First Row vs All Rows
• Application displays first few rows of a query
• Reporting type application that will always fetch all rows of a query
• Certain application interface patterns:
o TOP <N> STARTAT <S>
o API layer fetches all rows of query even if application doesn’t use them
Solution
• Optimization_goal option
• OPTION clause on SQL Query
• TABLE Hints in the FROM clause
(c) 2015 Independent SAP Technical User Group Annual Conference, 2015
Agenda
Performance Analysis
Example of Analysis
Graphical Plan Viewer
Performance Timing Utilities
Types of Performance Problems
Communication Patterns
I/O Bound Applications
CPU-Bound Applications
Concurrency Bound Applications
Performance Tips
(c) 2015 Independent SAP Technical User Group Annual Conference, 2015
Concurrency-Bound Applications
If application does not seem to be either CPU or I/O bound on the server, it may be
concurrency bound
• Special case of CPU or I/O-boundedness – application can’t take advantage of extra resources
• ActiveReq performance counter: if high (10 to 20 or higher), an indication of being concurrency bound
• If it is low, and CPU and I/O are also low, problem is that application isn’t giving server enough work to keep
busy
Concurrency problem may be internal to server, or may be in server-side
application code
• Determine using DBCONSOLE or sa_connection_info() if connections are blocked on others, application-
based concurrency problem; otherwise could be internal server-based
(c) 2015 Independent SAP Technical User Group Annual Conference, 2015
Application Concurrency
User connections hold locks on rows, preventing other connections from getting their work done
Most common causes: • Hot row – detected by application profiling (blocking analysis)
• Long term holding of read locks – detected by looking for cursors that stay open for a long time, long transactions at isolation levels > 0
• Long term holding of write locks keep update transactions as short as possible
Check isolation level of all transactions • 0 (default) - no locking; a latch ensures that the entire row is consistent when retrieved from the disk page
• 1,2 - lock rows in the query’s result, but with level 1 the lock is held only while the cursor is on that row
• 3 - lock every row read and every insertion point crossed during query execution
• Snapshot isolation – writers don’t block readers, achieved by maintaining copies of modified rows
(c) 2015 Independent SAP Technical User Group Annual Conference, 2015
Avoid Designs Where Many Transactions
Update A Row
This can come up with “one row tables”
• For example, key generation; consider using sequences
When a foreign row is inserted, lock primary row
• In version 12 and above, only the primary key is locked, other columns open
(c) 2015 Independent SAP Technical User Group Annual Conference, 2015
Internal Server Concurrency
Server maintains internal locks to protect server structures
Contention for these resources may happen:
• Transaction log solution: move to new disk, pregrow
• Checkpoint log solution: secondary dbspace
• Lock table – only possible when servicing hundreds of connections
(c) 2015 Independent SAP Technical User Group Annual Conference, 2015
Agenda
Performance Analysis
Example of Analysis
Graphical Plan Viewer
Performance Timing Utilities
Types of Performance Problems
Communication Patterns
I/O Bound Applications
CPU-Bound Applications
Concurrency Bound Applications
Performance Tips
(c) 2015 Independent SAP Technical User Group Annual Conference, 2015
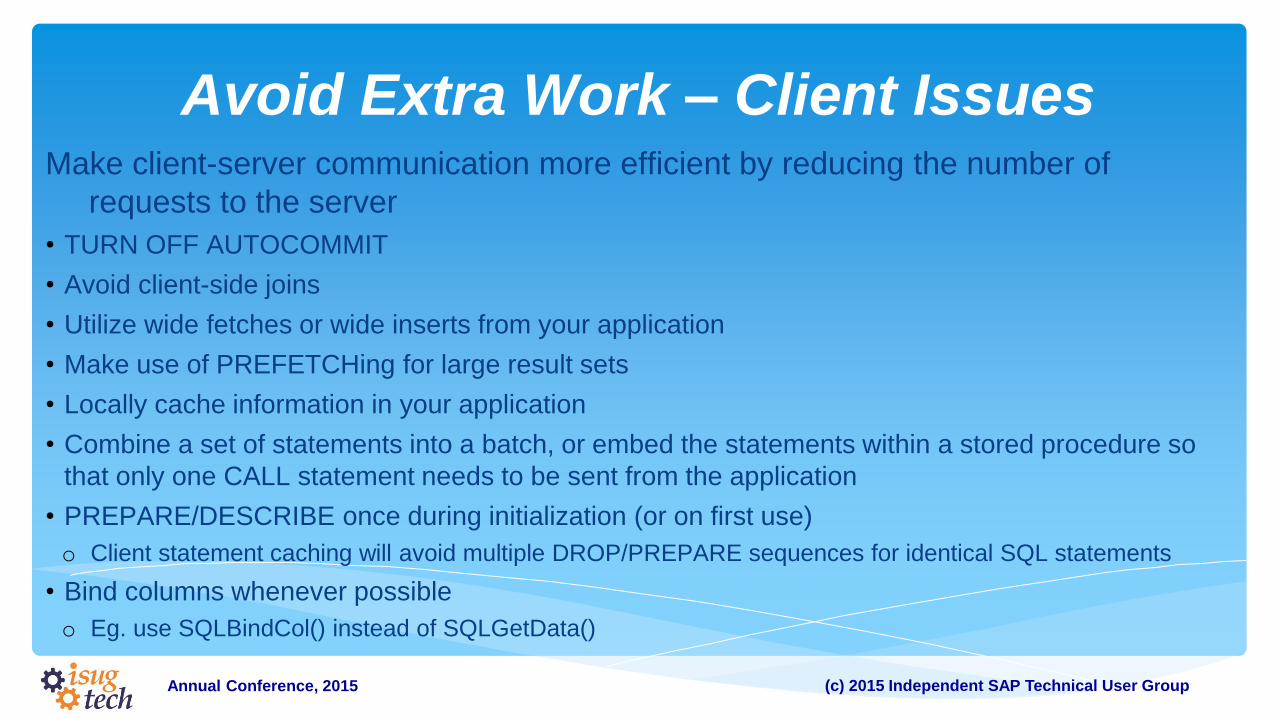
Avoid Extra Work – Client Issues Make client-server communication more efficient by reducing the number of
requests to the server
• TURN OFF AUTOCOMMIT
• Avoid client-side joins
• Utilize wide fetches or wide inserts from your application
• Make use of PREFETCHing for large result sets
• Locally cache information in your application
• Combine a set of statements into a batch, or embed the statements within a stored procedure so
that only one CALL statement needs to be sent from the application
• PREPARE/DESCRIBE once during initialization (or on first use)
o Client statement caching will avoid multiple DROP/PREPARE sequences for identical SQL statements
• Bind columns whenever possible
o Eg. use SQLBindCol() instead of SQLGetData()
(c) 2015 Independent SAP Technical User Group Annual Conference, 2015
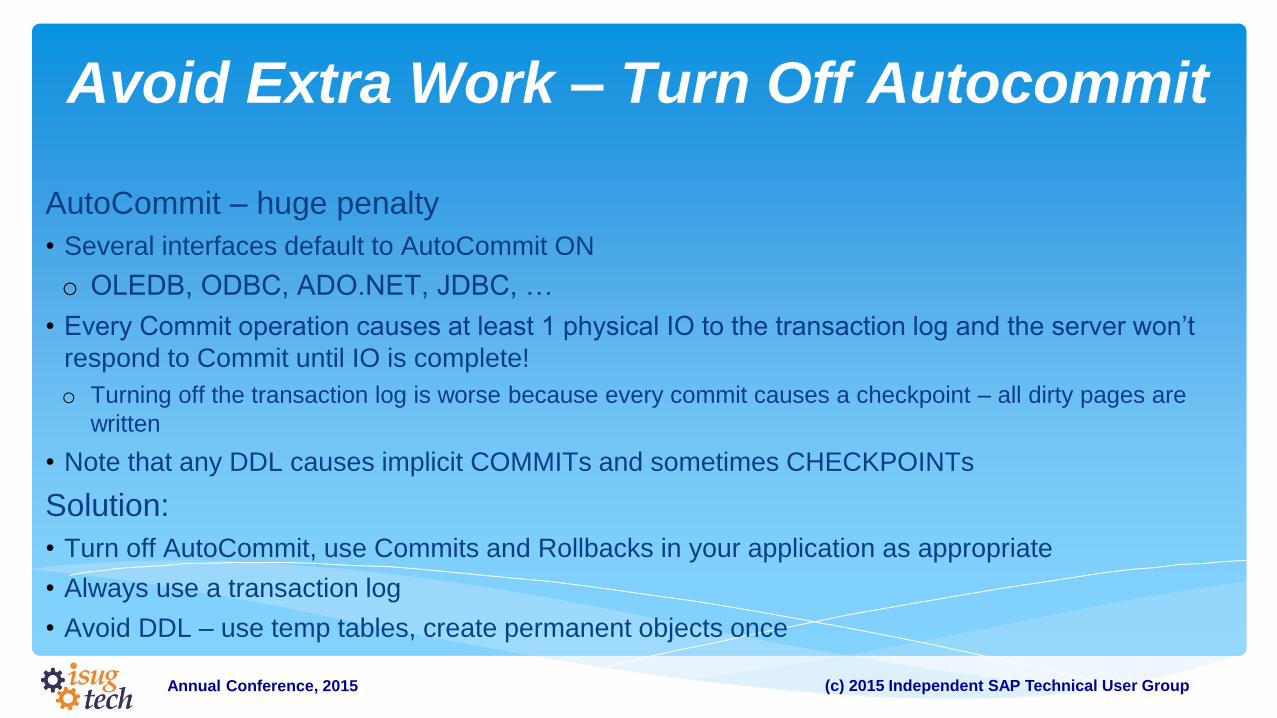
Avoid Extra Work – Turn Off Autocommit
AutoCommit – huge penalty
• Several interfaces default to AutoCommit ON
o OLEDB, ODBC, ADO.NET, JDBC, …
• Every Commit operation causes at least 1 physical IO to the transaction log and the server won’t
respond to Commit until IO is complete!
o Turning off the transaction log is worse because every commit causes a checkpoint – all dirty pages are
written
• Note that any DDL causes implicit COMMITs and sometimes CHECKPOINTs
Solution:
• Turn off AutoCommit, use Commits and Rollbacks in your application as appropriate
• Always use a transaction log
• Avoid DDL – use temp tables, create permanent objects once
(c) 2015 Independent SAP Technical User Group Annual Conference, 2015
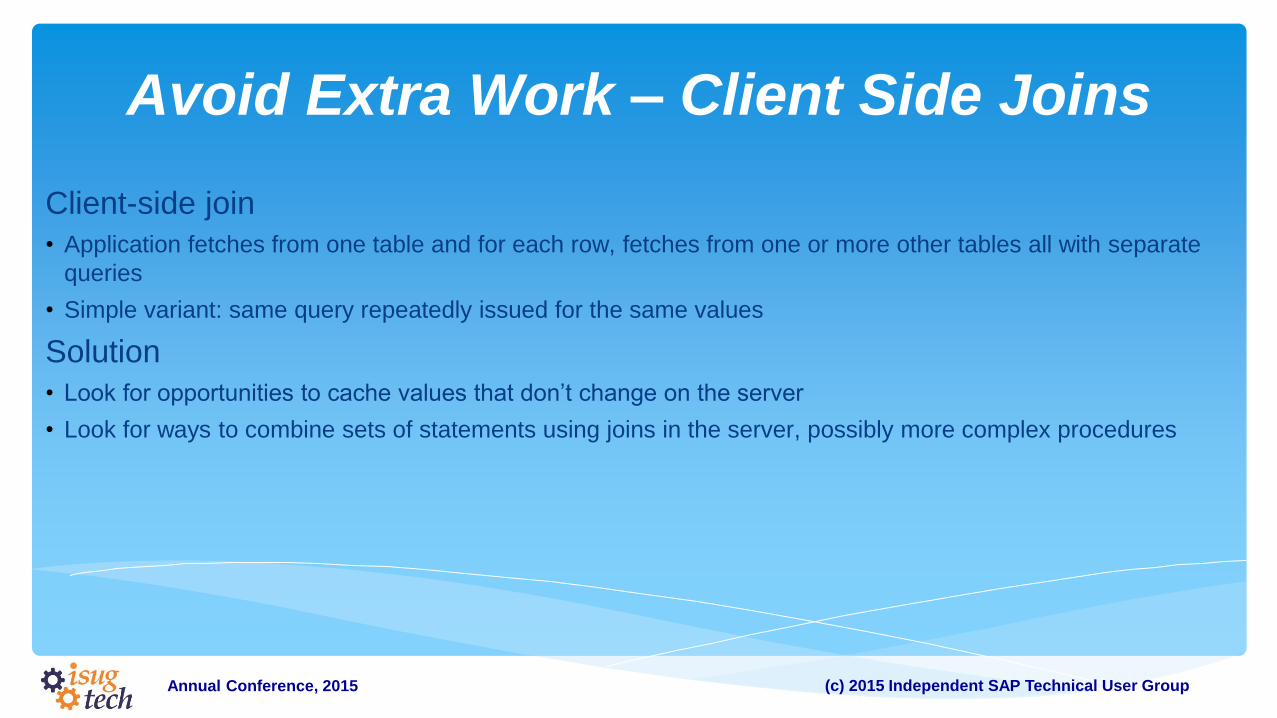
Avoid Extra Work – Client Side Joins
Client-side join
• Application fetches from one table and for each row, fetches from one or more other tables all with separate
queries
• Simple variant: same query repeatedly issued for the same values
Solution
• Look for opportunities to cache values that don’t change on the server
• Look for ways to combine sets of statements using joins in the server, possibly more complex procedures
(c) 2015 Independent SAP Technical User Group Annual Conference, 2015
Avoid Extra Work - Prefetch
Prefetch reduces communication by transferring sets of rows to the client in
advance of a FETCH request
Prefetch is ON by default
• To disable use the DisableMultiRowFetch connection parameter or set the Prefetch option to OFF
• Prefetch is turned off on cursors declared with sensitive value semantics
Adaptive prefetching
• Increases or decreases depending on application behaviour
• Maximum number of rows that will be prefetched is 1000
• Incluenced by number of rows the application can FETCH in one elapsed second

(c) 2015 Independent SAP Technical User Group Annual Conference, 2015
Avoid Extra Work – Wide Fetches/Inserts
For relatively large result sets, use wide fetches
• Each API call obtains several rows; explicitly set by the application
o Prefetching may or may not also occur
• Number of rows wide fetched is configurable
With wide (multi-row) inserts (and updates, deletes in V17):
• Supported by ESQL, ODBC, JDBC
• Consider LOAD TABLE where appropriate
• COMMIT at regular intervals to reduce lock contention, limit size of rollback log
Updates: use set based UPDATE … FROM … WHERE operations
(c) 2015 Independent SAP Technical User Group Annual Conference, 2015
Network Latency and Performance
• Latency: time it takes for a packet to be received at a different machine once sent
• Throughput: number of bits (bytes) that can be transferred in a given period of time
• LAN: typically 1ms (perhaps less) latency, at least 1MB/sec throughput
• WAN: 5-500 ms latency, 4-200KB/sec throughput
o These are ballpark estimates
• DBPing: can be used to determine round trip time to the server
• reducing requests to server reduces impact of network latency

(c) 2015 Independent SAP Technical User Group Annual Conference, 2015
Reducing Network Latency
Increase the database server’s packet size
• Default in Version 11 has increased from 1460 to 7300; even larger sizes can be beneficial for large result
sets
• Can improve the performance of large FETCHes and multi-row fetches, or BLOB operations (both retrieval
and insertion)
Use the CommBufferSize connection parameter
• Alter the packet size only for connections that would benefit from a larger packet size.
Consider altering the ReceiveBufferSize and SendBufferSize TCP/IP parameters
• Preallocate the amount of memory used by the TCP/IP protocol stack to receive and send packets over the
wire
• Defaults for these values are machine-dependent (OS, driver, card manufacturer)
(c) 2015 Independent SAP Technical User Group Annual Conference, 2015
Improving Network Throughput
Communication compression may improve throughput between client and server
over a modem or WAN:
• Packets are compressed before encryption
• Compressed data can be less than 10% of original size, but depends completely on data and the application
• Increase packet size for greater compression, fewer packets
• Compression requires additional ~46K per connection
• You must analyze your application's performance and verify results
o Compression requires additional CPU; on LANs, compression costs typically outweigh
savings in bandwidth
(c) 2015 Independent SAP Technical User Group Annual Conference, 2015
SUMMARY OF PERFORMANCE
TIPS
(c) 2015 Independent SAP Technical User Group Annual Conference, 2015
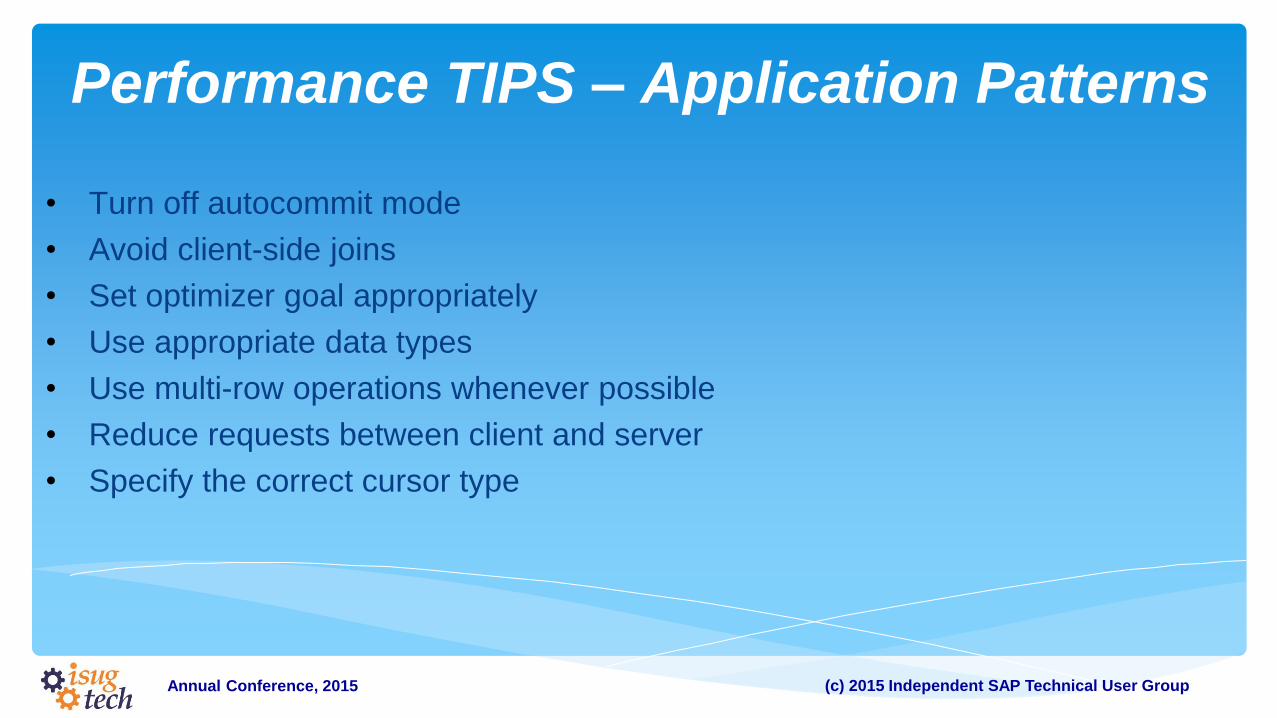
Performance TIPS – Application Patterns
• Turn off autocommit mode
• Avoid client-side joins
• Set optimizer goal appropriately
• Use appropriate data types
• Use multi-row operations whenever possible
• Reduce requests between client and server
• Specify the correct cursor type
(c) 2015 Independent SAP Technical User Group Annual Conference, 2015
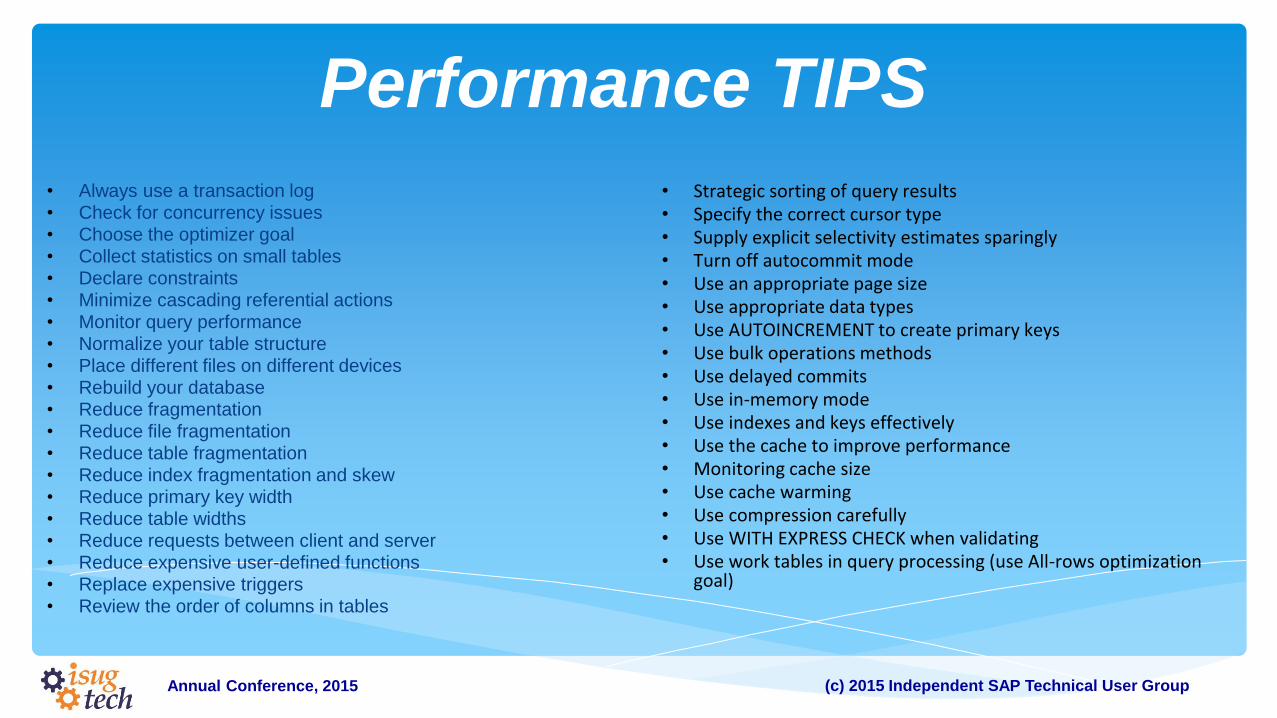
Performance TIPS
• Always use a transaction log • Check for concurrency issues • Choose the optimizer goal • Collect statistics on small tables • Declare constraints • Minimize cascading referential actions • Monitor query performance • Normalize your table structure • Place different files on different devices • Rebuild your database • Reduce fragmentation • Reduce file fragmentation • Reduce table fragmentation • Reduce index fragmentation and skew • Reduce primary key width • Reduce table widths • Reduce requests between client and server • Reduce expensive user-defined functions • Replace expensive triggers • Review the order of columns in tables
• Strategic sorting of query results • Specify the correct cursor type • Supply explicit selectivity estimates sparingly • Turn off autocommit mode • Use an appropriate page size • Use appropriate data types • Use AUTOINCREMENT to create primary keys • Use bulk operations methods • Use delayed commits • Use in-memory mode • Use indexes and keys effectively • Use the cache to improve performance • Monitoring cache size • Use cache warming • Use compression carefully • Use WITH EXPRESS CHECK when validating • Use work tables in query processing (use All-rows optimization
goal)
(c) 2015 Independent SAP Technical User Group Annual Conference, 2015
Agenda
Performance Analysis
Example of Analysis
Graphical Plan Viewer
Performance Timing Utilities
Types of Performance Problems
Communication Patterns
I/O Bound Applications
CPU-Bound Applications
Concurrency Bound Applications
Performance Tips
Conclusion and Resources
(c) 2015 Independent SAP Technical User Group Annual Conference, 2015
Conclusion
SQLA Continues to evolve to exploit new hardware / usage scenarios
Trends in increasing memory, core counts, and new storage technologies are very relevant
Dealing better with larger data volumes is important
But: speed of simple operations is also critical to some application patterns
Performance analysis and tuning is an interesting and idiosyncratic domain
It can be a lot of fun to trace down what is really going on
It is best if it can be done before there is a problem with unhappy customers
(c) 2015 Independent SAP Technical User Group Annual Conference, 2015
Resources
White papers:
• Capacity Planning with SQL Anywhere
o http://scn.sap.com/docs/DOC-35069
• Diagnosing Application Performance Issues with SQL Anywhere
o http://scn.sap.com/docs/DOC-35601
SQL Anywhere Documentation
o http://dcx.sap.com
SQL Anywhere Q&A forum
o http://sqlanywhere-forum.sap.com
68
(c) 2015 Independent SAP Technical User Group Annual Conference, 2015
Thank you
Jason Hinsperger
Sr Product Manager
SAP Labs Canada, 445 Wes Graham Way, Waterloo, ON N2L 6R, Canada
519-883-6492
(c) 2015 Independent SAP Technical User Group Annual Conference, 2015
© 2014 SAP AG or an SAP affiliate company. All rights reserved.
No part of this publication may be reproduced or transmitted in any form or for any purpose without the express permission of SAP AG or an SAP affiliate company.
SAP and other SAP products and services mentioned herein as well as their respective logos are trademarks or registered trademarks of SAP AG (or an SAP affiliate
company) in Germany and other countries. Please see http://global12.sap.com/corporate-en/legal/copyright/index.epx for additional trademark information and notices.
Some software products marketed by SAP AG and its distributors contain proprietary software components of other software vendors.
National product specifications may vary.
These materials are provided by SAP AG or an SAP affiliate company for informational purposes only, without representation or warranty of any kind, and SAP AG or its
affiliated companies shall not be liable for errors or omissions with respect to the materials. The only warranties for SAP AG or SAP affiliate company products and services
are those that are set forth in the express warranty statements accompanying such products and services, if any. Nothing herein should be construed as constituting an
additional warranty.
In particular, SAP AG or its affiliated companies have no obligation to pursue any course of business outlined in this document or any related presentation, or to develop or
release any functionality mentioned therein. This document, or any related presentation, and SAP AG’s or its affiliated companies’ strategy and possible future
developments, products, and/or platform directions and functionality are all subject to change and may be changed by SAP AG or its affiliated companies at any time for
any reason without notice. The information in this document is not a commitment, promise, or legal obligation to deliver any material, code, or functionality. All forward-
looking statements are subject to various risks and uncertainties that could cause actual results to differ materially from expectations. Readers are cautioned not to place
undue reliance on these forward-looking statements, which speak only as of their dates, and they should not be relied upon in making purchasing decisions.