Embed Size (px)
Citation preview
Glenn C ButtsGlenn ButtsFebruary, 2010
Hope is NOT a Valid Management Strategy
Mega Projects Estimates -A History of Denial
The source of knowledge is experience.Experience is of two kinds-our own, and that of others.
Knowledge gained from our own experience is most expensive.Mystery and ignorance are always coexistent.
Learn the truth and the mystery will disappear.
Special Thanks to Kent Linton for help in preparing this presentation. Used with Permission

Page 2
Associated Press March 4, 2009
Cost overruns plague U.S. space agencyGAO report used NASA as poster child for bad practices in estimating costs“WASHINGTON - NASA can land a spacecraft on a peanut-shaped asteroid 150 million miles away, but it doesn't come close to hitting the budget target for building its spacecraft, according to congressional auditors. NASA's top officials know it and even joke about it.”
Unfortunately for us, this is NOT News . . .NASA has a long history of bad cost and schedule estimates
. . . and Congress doesn't appear to be in a joking mood any longer.

Page 3
Not Limited to NASACost Overrun Everywhere . . . WHY???
A “Worldwide phenomenon that affects both the private and public sectors.”Green Book - English Government
“Confidential project documents from 1995 reveal Bechtel willingly hid coststo present a more favorable view of
Big Dig's financial picture at the behest of top state officials seeking a more
publicly acceptable bottom line.”Source - Boston Globe

Page 4
US NAVY – October 22, 2009
♦ Independence, a new 418-foot warship• Top speed in excess of 45 knots, or about 52 mph.
♦ Eventually, Navy wants to build 55 of them.♦ Early estimates for Littoral Combat Ships were about $220 million each
• Costs escalated because of new requirements and desire to expedite construction. ♦ Cost of ships now capped at $460 million each, starting in new fiscal year.

Page 5
Boeing 787 Dreamliner – 2009 Status
♦ Boeing’s radical plan to build revolutionary new 787 Dreamliner• Heavy outsourcing - worldwide• Unprecedented use of composite materials• Unmatched fuel economy
♦ Radical New plan didn’t work….• Communication problems • Quality suffered• Structural issues• Schedules slipped
− Initial delivery date May 2008 − Test flight delayed over 2 years
• Still faces 12 months of testing• 60 Order cancelations• Billions in costs increases, including
− Payments & concessions to airlines− Purchasing suppliers− Additional management oversight costs
"The initial plan outran our ability to execute it," Boeing Chief Executive Jim McNerney
Dreamlifter built to bring large parts to Seattle from around the world for final assembly

Page 6
Boeing 747-8 - 2009 Status
♦ Boeing’s conventional plan to build new 747-8 freighter variant• Project started in 2005
− 2 years after 787• Variant of existing 747
− New wings− New Engines− New cockpit technologies
• Uses traditional materials instead of composites• Orthodox manufacturing process
♦ Conventional Plan didn’t work either….• Besieged by design and engineering problems from onset• Boeing announced $1 Billion dollar charge as a result of problems in Oct 09• Initial delivery delayed at least a year
− Test Flight Mid January 2010
♦ No intention to pick on Boeing• Airbus’s new A380 experiencing similar problems
“We believe that building the 747-8 should have been a straightforward development process on a derivative program.”
Aerospace Analyst Douglas Harned

Page 7
Congress is Not Any Better
♦Congressional Visitors Center Boondoggle• 580,000 sq. ft. facility estimated cost $71 million in the early 1990s
• Construction began June 2000 with a promised − Completion date of 2004 for a − Budget of $265 million
• Finally completed five years behind schedule in December 2008 − The final cost - a whopping $621 million
$671 M ÷ $71 M - 1 =845% cost growth
Just One Exampleof Many

Page 8
Underestimates are Nothing New - Quotes from 1964All but One from Apollo Executives Meeting
♦ "I can think of a lot of programs in the Boeing Company where, if the estimate had been realistic, you wouldn't have had the program, and that is the truth."
W. M. Allen - President, Boeing
♦ "You have basically built into the entire system a series of events which very much leads to under-estimating what the program is going to cost."
J. S. Parker - Vice President, GE
♦ "As advocates of new programs, government agencies have often encouraged contractors to estimate costs optimistically.• Recognizing that headquarters might be shocked out of supporting a program
where true costs were revealed at the outset.• They have sought to disclose cost increases gradually, after programs have
gained momentum and cancellation has become difficult."Dr. Frederic Scherer - Harvard
♦ "We can give you estimates all the way to the end of the Saturn-IVB, but do you really want to know it?"
Donald W Douglas - President Douglas Aircraft
Underestimates documented back to 1869 – probably prior.

Page 9
Congress Complicates Matters
Another Example:“Dick Cheney canceled Marine Corps' troubled V-22 Osprey aircraft not once, but 4 times, only to see Congress reverse the decision.”
Bill Nelson and Co. take town Obama’s NASA frontrunner
Word is that Steve Isakowitz, the frontrunner for the NASA Administrators’s job, has been taken down by a group of his opponents on Capitol Hill.
According to Washington insiders and Hill staff, a group of lawmakers led by Florida’s Democratic senior Senator Bill Nelson are taking credit for pushing Isakowitz out of the picture.
“Nelson and other NASA boosters did not like Isakowitz’s reputation
as a tough fiscal manager.”
Page 10
We Claim to Seek Accurate Estimates
♦ Yet, we;• Persist in submitting optimistic initial estimates• Omit probable scope from our estimates that often become "real."• Exclude credible risks from our analysis
− SM&A actively mitigates risks with a likelihood of occurrence of only one in several thousand, and are supported by managment.
♦ Management mantra• “if status quo is assumed, we will get the status quo”
− Meaning status quo is too expensive− There are valid reasons for why things cost what they cost− Excuse for under-estimating projects
♦ Possible conclusions:• Accurate estimates are impossible, especially at early stages
− The variables are too complex, unquantifiable, and incalculable - NOT• We really don’t want accurate estimates;
− The Primary concern is keeping program viable & funded as long as possible− Early estimates are deliberately misrepresented and meant to gain approval

Page 11
Early Estimates are Often Deliberate MisrepresentationPolite way of Saying Lying…….
♦ Conclusions from the largest study of its kind:• Examined 258 large transportation projects• Underestimation has not decreased during past 70 yrs.• It was found with overwhelming statistical significance that
cost underestimation cannot be explained by error.− “Is best explained by strategic misrepresentation, namely lying,
with a view to getting projects started.”• Cost overruns of 50% to 100% in real terms are common.
− Overruns above 100% are not uncommon.• Accuracy is gained at each successive stage of progress.• Promoters routinely ignore, hide, or otherwise leave out
important project costs and risks in order to make total costs appear low.
• Cost underestimation occurred in almost 9 out of 10 projects. − The likelihood of actual costs being larger than estimated is 86% − The likelihood of actual costs being lower than estimated is 14%
This study looked at comparatively simple projects.Statistics for more complex projects would likely be worse!

Page 12
How Do We Underestimate?- Let Me Count The Ways -
1. OMIT PROBABLE SCOPE from estimate2. OMIT POSSIBLE RISKS from analysis
• Internal & External
3. UNREALISTIC, OPTIMISTIC assumptions4. Use historically LOW ESCALATION projections
• RAND Study – Reason for 11.2% of Cost Growth
5. Issue cost estimates in BASE YEAR dollars• Estimates should be in then year dollars (escalated to year in which it is spent)
6. Many estimates NOT PREPARED BY A BONA FIDE ESTIMATOR• Everyone's a estimator• Being certified no guarantee of having necessary experience
7. REWARD failure, PUNISH honesty8. NOT ENOUGH TIME to prepare CREDIBLE estimates
• Time often spent doing “what if” exercises, or splitting dollars into arbitrary buckets
“I reject a system that rewards failure and protects a person from its consequences”
- Barack Obama -
RAND Study – Reasonfor 74% of Cost Growth
{

Page 13
Escalation Assumptions Should be RealisticNASA New Start Escalation Index
“The current efforts to help revive the economy are likely to produce inflation that could be worse than what the country suffered in the late 1970s.”
Warren Buffett, March 2009
0%
2%
4%
6%
8%
10%
12%
1959 1964 1969 1974 1979 1984 1989 1994 1999 2004 2009 2014
Year
Ann
ual I
ncre
ase
Annual Average 5%
Realistic Assumption?RAND - 1981 escalation
accounts for 11.2% of
project cost growth
88% probability assumed
escalation will be exceeded

Forgotten SPACE SHUTTLE Facts
♦ Initially approved by 1 Vote• Congress WAS concerned about estimates
♦ FY 1972 Estimate • DDT&E $5.5 Billion + 20% Contingency = $6.6 Billion
− Contingency Reportedly Removed by Congress• Facilities $0.3 Billion• 1st Manned Flight projected by June 1976 (4 yrs.)
♦ Reality - 1982• Total Cost $17.789 Billion
− DDT&E $13.138 Billion− Production $ 3.900 Billion− Facilities $ 0.703 Billion
• 1st Manned flight occurred in April 1981 (9 yrs.)
♦ Increase WAS Foreseen . . .• “Considering all of the technological and operational unknowns involved in the shuttle
development and the fact that no vehicles of similar function have ever been designed before or have ever operated over the range of flight regimes required for the shuttle, prudent extrapolation of prior experience would indicate that estimated development costs may be 30 to 50 percent on the low side. Thus, the estimates of $6.5 billion in RDT&E for the Mk I/Mk II shuttle program may range between $8.5 to $10 billion, reflecting increased program costs of $2.5 to $3.5 billion. Similar uncertainties must be considered to apply to other non-recurring costs such as production and facilities (amounting to about $4 billion). Thus a possible cost uncertainty of about $5 billion for total program costs might be envisioned giving a high estimate of total non-recurring cost of about $15 billion.” - October 1971 Report -
“The chance of a Shuttle launch on November 20 1980 is probably 10 to 20%”
Dr. Frosch NASA - AdministratorCongressional Testimony 1980
Page 14

Page 15
Realistic Assumptions ARE Critical
Space Shuttle Operations Concept - 1974This is what was estimated.
Orbiter Processing Facility - TodayThis is what was built.
Page 16
Never Fear!Joint Confidence Levels (JCL) Will Save the Day!!
♦In January 2009, NASA adopted a new acquisition strategy policy which requires space flight and IT projects and programs to develop joint cost & schedule probabilistic estimates.
♦NASA’s commitment to using joint cost and schedule confidence levels has moved NASA along a path towards improving our delivery of projects on time and within budget.
Paraphrased from Christopher Scolese Acting NASA Administrator's (3-5-09) Congressional Testimony
http://democrats.science.house.gov/Media/file/Commdocs/hearings/2009/Space/5mar/Scolese_Testimony.pdf

Page 17
Probabilistic Cost & Scheduling Concept - Nothing NewDidn’t Work on 1st Attempt
PERT:♦ Ignored possibility of unlikely events
♦ Sold as greatest thing since sliced bread
♦ Credited for the unmitigated success of Polaris program
♦ Actually a “gimmick” to wow Congress• Only applied to a few program activities
♦ Was subsequently expanded to include cost
♦ Was then used to manage the Trident Program• Trident became the “Single worst managed
project in US Military History”
♦ Because it did not work, it fell out of favor in the mid to late 70’s
Source – The Polaris System Development, 1972

Page 18
The Real Reason for Polaris' Success
♦ The Polaris Program:• Attracted top talent• Created a new office with special privileges• Authorized special uniforms• Provided first class travel• Initiated hassle free expense accounts• Gave liberal promotions and awards for success
♦ The Staff was told to “Think big or get out”♦ Required minimal paperwork and reports
• Didn't burden talent with bureaucratic paperwork♦ Got personal pledges from contractors &
personnel that schedules would be met♦ Issued swift & sure ramifications for failure
• Branch heads were dismissed within 24 hours• Contractor personnel were prohibited from
returning to previous assignments♦ Was very receptive to innovative ideas♦ Candid honesty was actively sought
• Lying cardinal crime and treated accordingly!Source – The Polaris System Development, 1972

Page 19
Management CAN'T Figure Out WhyS-Curves Flatten Over Time – Can You?
Graphic by David Bearden – Aerospace Corp.STEREO Mission
Initial estimate from cost model vs model output from as built configuration
0%10%20%30%40%50%60%70%80%90%
100%
$200 $250 $300 $350 $400 $450 $500 $550 $600 $650 $700 $750 $800Total Mission Cost (FY07$M)
Perc
ent L
ikel
ihoo
d of
Com
plet
ing
at C
ost
SDT DesignFinal Design
$299M Estimate with 20% Reserve
Final Cost$551M
0%10%20%30%40%50%60%70%80%90%
100%
$200 $250 $300 $350 $400 $450 $500 $550 $600 $650 $700 $750 $800Total Mission Cost (FY07$M)
Perc
ent L
ikel
ihoo
d of
Com
plet
ing
at C
ost
SDT DesignFinal Design
$299M Estimate with 20% Reserve
Final Cost$551M
0%10%20%30%40%50%60%70%80%90%
100%
$200 $250 $300 $350 $400 $450 $500 $550 $600 $650 $700 $750 $800Total Mission Cost (FY07$M)
Perc
ent L
ikel
ihoo
d of
Com
plet
ing
at C
ost
SDT DesignFinal Design
$299M Estimate with 20% Reserve
Final Cost$551M
Does this help Credibility?
Answer: Red S-Curve was initial project estimate from cost model based on numerous optimistic assumptions.Blue S-Curve is model estimate based on as built configuration.

Page 20
Possible Solutions
♦Hold project managers accountable for the original estimate• Project Managers will THEN begin demanding credible estimates • Recognize that historically many original assumptions are OPTIMISTIC or
simply NOT valid • Resist the legacy practice of labeling COST growth as "SCOPE" growth• Rather than scope "growth" historically, scope "reduction" is often what
has actually occurred. Real requirements are often trimmed - NOT expanded− Space Station was originally touted with 8 functions - but cut down to 1− Shuttle's original requirement was for a payload of 65,000 lbs. – Maximum current
payload capability is 49,000 lbs.− Mercury Program deleted two monkey passenger test flights− Etc., etc…
OR ♦ Include all possible risks in cost projections (internal and external)
• Projects tendency to spend everything available must be constrained− Congress budget contraints aggrivate issue – they demand that all money is spent.
• Make it fashionable to be austere and frugal and encourage "under run" • It's always possible to spend more time and money

Page 21
How English Government Deals With Bad Estimates
♦ European Solution – apply an “optimism bias adjustment” factor
“There is a demonstrated, systematic, tendency for project appraisers to be overly optimistic. Many project parameters are affected by optimism. Appraisers tend to overstate benefits and
understate timings and costs - both capital and operational.”
Source - HM Treasury – The Green Book Appraisal and Evaluation in Central Government Treasury and Supplementary Green Book Guidance – Optimism Bias
• Factor derived from empirical data• How to Determine: (Official
Guidance)− Use the “best available data”− Develop ranges from business
case data • “Initial estimates may require
higher adjustments”− Initial estimates should start in
“upper range”− Reduce adjustment factor with
project progress

“Out of the ten NASA projects in the GAO QuickLook Report that exceeded the Congressionally-mandated cost and schedule thresholds, approximately half did so as a result of external factors; some with limited solution options open to NASA.”
Christopher Scolese – Acting NASA Administrator
Perspective from the Top
♦ Often external factors precipitate cost growth♦ We must account for external factors in our early estimates
Page 22

Page 23
♦ NASA & DOD frequently re-baseline their projects♦ Then claim credit for underrun if the re-baselined estimate is not exceeded♦ This is Voodoo Estimating !!!
♦ Spitzer – 411 people given group achievement award for effective management of cost and schedule among other things (Schedule 31% Slip)
♦ 58% of DOD projects are re-baselined
GAO Re-baselining Example
Sources: GAO-04-642 Lack of Disciplined Cost-Estimating Processes HindersEffective Program Management & GAO-08-467SP Assessments of Selected Weapons
Programs
V22 Osprey aircraft was re-baselined 10 times.F-22 aircraft re-baslined 14 times.
Renamed Spitzer 1.51 Times Initial
Estimate

Page 24
Only 12.5% chance of completing project on or under budget. Average: 93% & Median: 51%
If overruns are consistent they can be predicted Probably low due to re-baselining & cancellation events.
We should beware of "Simpson's Paradox".
NASA’s History on 96 Projects1st Available Cost Estimate to Last Available Cost Estimate
Data believed to include projects at various
phases of development.
Ideally, we should only use projects with data
from phase A to phase E.Or
Better still, develop cost growth history for various types of projects between each phase to complete

Page 25
Simpson's Paradox
♦ General Rule: Larger data sets = More reliable conclusions. . . but Simpson's Paradox contradicts the general rule.
♦ When Simpson's Paradox is afoot, conclusions drawn fromlarge data sets are erroneous.
♦ Simplistic Example:• Take two "World Records" in Track & Field:
− The 100 Meter Dash was Run in 9.77 Seconds
− The Marathon was run in 2 hours 4 min. 55 sec. (7,495 Seconds)
− The Average time for these two races is 3,752 Seconds
• Therefore - the expected times for the next "races" are:− For the 100 Meter Dash: 3,752 Seconds?
− For the Marathon: 3,752 Seconds?
− Obviously incorrect !
− Interestingly "Half Marathon" will be close to 3,752 Seconds estimate. (The actual "Half Marathon" record is 3,500 Seconds)
♦ Conclusion: – Evaluate data ONLY from "like projects.”

Page 26
How Do We Fix This Mess?
♦ "Optimism Bias" Correction - Applied Probabilistically• The same method can be used for cost and schedule (different factors)• This "variable factor" is automatically reduced as project progresses.
♦ We call it: JCL-PC (Joint Confidence Level - Probabilistic Calculator)
1.01.52.02.53.03.54.04.55.05.5
0% 10% 20% 30% 40% 50% 60% 70% 80% 90% 100%Project Percent Complete
JCL-
PC M
ultip
lyie
r
50% Probability60% Probability70% Probability80% Probability90% Probability98% Probability
Above example is based on the 96 NASA Projects History chart shown previously.Actual use should be based on like projects to avoid "Simpson's Paradox."

Page 27
Example: $1M Point Estimate(With JCL-PC Applied)
Pro
babi
lity
Cost
The JCL-PC adds a “fat tail” to the right side of the
distribution accommodating cost increases
due to “Unknown -Unknown” events.
Reading the ChartRED LINE (0% Project Complete): 12.5% probability that by the time you've completed project, you'll have met your objective of doing the work for 1 million dollars. $1,598,000 is required for a 50% probability of completing project without needing additional funding.
BLUE LINE (25% Project Complete): 35.5% probability that by the time you've completed your project, you'll have come in at your estimate objective of 1 million dollars.

Page 28
Example $1M Status Quo Probabilistic Estimate(With JCL-PC Applied)
The JCL-PC adds a “fat tail” to the right side of the distribution . . . accommodating for cost increases due to “Unknown-Unknown” events.
Prob
abili
ty
Cost

Page 29
How JCL-PC Works
♦ JCL-PC = Project Cost Estimate x Discrete Risk Distribution♦ Discrete Risk Inputs
• 1 - Project percent complete = Project percent remaining• NASA historical cost growth distribution• Constant of 1
♦ JCL-PC decreases probability of cost growth as project progresses and more risks are recognized.
Assumes no Unknown
Risks OccurUnknown Risk Distributions % Project
Comp% Project
Remaining JCL-PC Multplier
1 =RiskBetaGeneral(0.98679,26.007,-0.16733,29.928)+1 0% 100% =RiskDiscrete(A9:B9,C9:D9)
JCL-PC Multiplier
1 1.93 0% 100% 1.931 1.93 100% 0% 1.00
Assumes no Unknown
Risks Occur
Unknown Risk
Distributions% Project
Comp% Project
Remaining
Constant of 1
Historical Best Fit Growth
Distribution
Subjective % CompleteSuggest Uniform
Distribution
Discrete Distribution

Page 30
Example of $1M Probabilistic Estimate Comparing Status Quo Method with JCL-PC Method
Prob
abili
ty
Cost
Reading the ChartBLUE LINE (Status Quo): This represents our typical constricted view of a project in which we only account for "known unknown's" which may likely occur. As project matures, more and more risks either occur or become formally acknowledged by management resulting in cost growth and schedule slip. Hence, the need for a better mouse trap - the JCL-PC.RED LINE (JCL-PC): This is reality. 99% of the risk factors (both internal and external that affect project outcomes) are accounted for in this performance assessment method.

Page 31
Conclusions
♦ Most large projects • Projects everywhere suffer the same fate.
− Early estimates are optimistic – much more than commonly believed.• Any early estimate for a development project that fails to consider
possibility of triple digit cost growth is NOT being realistic.• No other experience is more valuable than the experience of failure, it
must be shared honestly and completely − Coverups & revisionist history must be stopped in attempt to bury the truth
♦ Two requirements to prevent cost overruns.1. Create BETTER initial estimates by real estimators
− Include all potential risks (internal and external)• ~ 50% of project cost growth due to external factors
− Add probabilistic allowance for true unknowns2. Hold Project Managers accountable to original estimate
− They will stop “spinning numbers” and will demand• Qualified estimators & credible numbers• Failure analysis to determine issues
♦ Supporting research is covered in depth within the white paper• “Mega Project Estimates - A History of Denial." Please read it!• Email for a copy [email protected]
Stop mandating processes and reports - start
rewarding success and punishing
failure. IMPROVEMENTS
WILL OCCUR!

Page 32
“There Will Be No More Drugs”
♦ There will be no more cost & schedule overrunsCan be compared to saying
♦ There will be no more drugs in this country• If it sounds impossible - consider this!
The dictator of small country: Appears on national TV and says: “There will be no more drugs in this country.” Everyone laughs at his naiveté and says such a result is impossible.The next night 2 dozen people were lined up and shot The dictator appears on TV and says these people were caught with drugs.This happened every night for the next 2 weeks The number of people shot every night diminished until there were none! In-country rehabilitation centers filled up.
PointBefore things change - the approach and consequences must change!

Backup
Page 33

Example of Concept Growth: Substantial Differences Exist between STEREO Initial Concept and Final Implemented Configuration
STEREO STEREOProgrammatics SDT Final
Schedule (months) 40 70Launch Vehicle Taurus Delta II
TechnicalMass (kg)
Satellite (wet) 211 630Spacecraft (dry) 134 421Payload 69 149
Power (W)Satellite (Orbit Average) 152 503Payload (Orbit Average) 58 116
OtherTransponder Power (W) 20 60Downlink Data Rate (kbps) 150 720Data Storage (Gb) 1 8
SDT Configuration
Final Configuration
* Science Definition Team (SDT)
*

Example Project With JCL PC Applied
♦ Mars Science Lab - MSL • Initial Estimate was $650 Million • PDR Estimate was $1.4 Billion (2009 Launch)• 2009 Estimate $1.9 Billion (2011 Launch)
Based on Initial Estimate and 0% Complete
GAO – “Our work has identified a variety of reasons for cost growth, most notably
that programs are incentivized to produce and use optimistic
cost and schedule estimates in order to successfully compete
for funding.”
Page 29

Page 36
Reserves Must Be Made AvailableThroughout the Life of the Project
♦ Stating the Obvious• Reserves must be uniformly allocated throughout the life of the project.• Dumping all reserves in last year will result in an unviable project.
♦ Suggested Method• 70% Confidence level estimate – point estimate = Reserves• FY planned budget ÷ point estimate = point "reserve allocation" %• Point reserve allocation % x reserve total = point reserve allocation $$
FY1 FY2 FY3 Total100 800 100 1,000 Point Estimate119 952 119 1,190 Correct Allocation100 800 290 1,190 Incorrect Allocation
Occasionally things that are NOT expected to be a problem . . . become a problem. Example: Shuttle SRB’s were expected to use rayon as an ablative material - but rayon was phased out with the demise of bias ply tires. The unexpected problem
became locating an acceptable alternative, which was a valid use of project reserves.

Summary of Cost & Schedule Growth
♦Results of 2008 NASA & Aerospace Study• Most cost growth does not occur until after CDR• Average cost growth for missions studied is 76% over baseline with reserves
(and 113% over baseline without reserves)• Average schedule growth for missions studied is 36% over baseline with
reserves, or 16 months on average
Cost Growth Occurs Primarily After CDR and Exceeds Typical Guidance
20%
76%
13%
-25%
0%
25%
50%
75%
100%
125%
150%
175%
200%
ATP PDR CDR Launch
Mis
sion
Dev
elop
men
t Cos
t Gro
wth
ove
r Bas
elin
e w
ith R
eser
ves
(%)
Mission #1Mission #2Mission #3Mission #4Mission #5Mission #6Mission #7Mission #8Mission #9Mission #10Average
Schedule Growth Cost Growth
15.6
4.92.3
-5
0
5
10
15
20
25
30
ATP PDR CDR Launch
Mis
sion
Dev
elop
men
t Sch
edul
e G
row
th o
ver
Pla
n (M
onth
s)
Mission #1Mission #2Mission #3Mission #4Mission #5Mission #6Mission #7Mission #8Mission #9Mission #10Average

0%
50%
100%
150%
200%
250%
300%
350%
400%
Mercury Program Space Shuttle - WithReserves
Space Shuttle Apollo Space Station
Cost
Schedule
Linear (Cost)
Linear (Schedule)
Page 38
Human Space FlightNASA Development Programs History
♦Cost Growth• Average: 219% or 3.19 times the original estimate• Median: 207%
♦Schedule Growth• Average: 103% or 2.03 Times the original estimate• Median: 108%
If we keep doing the same things the same way, we will keep getting the same results.
Gro
wth
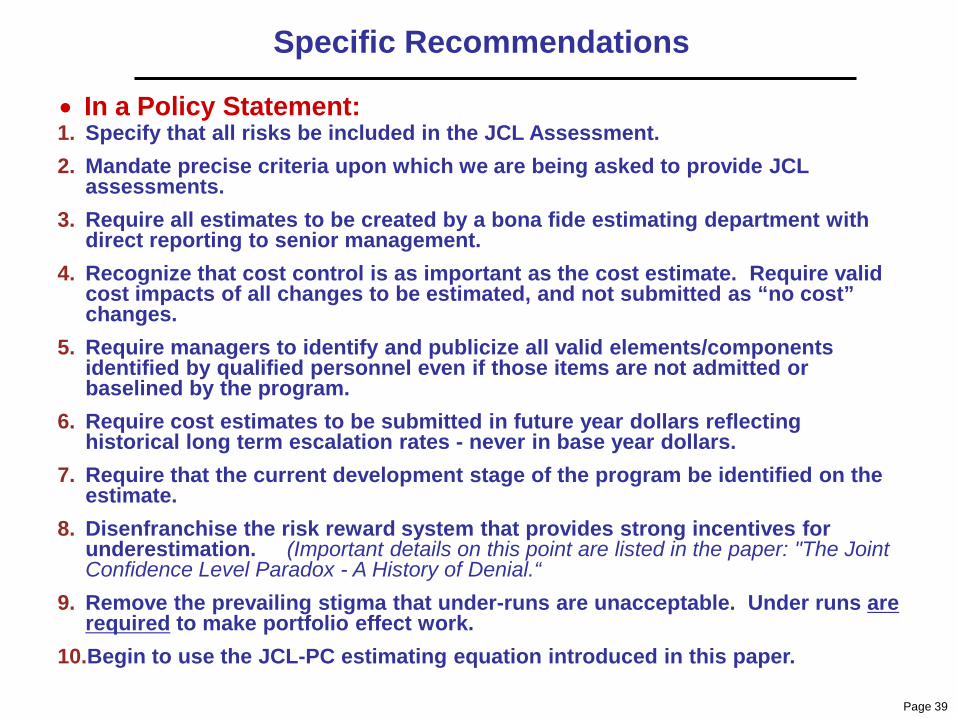
• In a Policy Statement:
Specific Recommendations
Page 39
1. Specify that all risks be included in the JCL Assessment.2. Mandate precise criteria upon which we are being asked to provide JCL
assessments. 3. Require all estimates to be created by a bona fide estimating department with
direct reporting to senior management. 4. Recognize that cost control is as important as the cost estimate. Require valid
cost impacts of all changes to be estimated, and not submitted as “no cost” changes.
5. Require managers to identify and publicize all valid elements/components identified by qualified personnel even if those items are not admitted or baselined by the program.
6. Require cost estimates to be submitted in future year dollars reflecting historical long term escalation rates - never in base year dollars.
7. Require that the current development stage of the program be identified on the estimate.
8. Disenfranchise the risk reward system that provides strong incentives for underestimation. (Important details on this point are listed in the paper: "The Joint Confidence Level Paradox - A History of Denial.“
9. Remove the prevailing stigma that under-runs are unacceptable. Under runs are required to make portfolio effect work.
10.Begin to use the JCL-PC estimating equation introduced in this paper.

Page 40
♦ The Spitzer Space Telescope's was launched in 2003• The Baseline Estimate was $472 Million• It was re-baselined 4 times• The final cost was $712 Million (1.51 times more than the original estimate)
− Another reference puts the final cost at $825 Million.
♦ On June 22, 2005 - 411 people received a Group Achievement Award• The team award was given to a group comprised of both government
employees and non-government personnel for outstanding accomplishment through the coordination of many individual efforts contributing substantially to the NASA mission. Explicit consideration was given for:
• 1) Quality of results and level of impact on NASA programs or operations • 2) effective management of cost and schedule• 3) customer satisfaction • 4) team growth and capacity for future contribution • 5) development of innovative approaches, use of and contributions to lessons
learned data banks, and/or success in responding to unforeseen crises.
Are We Guilty of Rewarding Failure?
Sources - GAO-04-642 Lack of Disciplined Cost-Estimating Processes HindersEffective Program Management - http://www.spitzer.caltech.edu/Media/happenings/20050707/
What ???

Reasons For Growth
From SSCAG Paper titled: “Using Historical NASA Cost and Schedule Growth to Set future
Program and Project Reserve Guidelines”
Page 41

Page 42
Hundreds of Studies Reviewed
This presentation is not about pointing fingers. It ismeant to emphasize the urgency and propose a solution.
Without using recent material, this paper
could have been written entirely of quotes from past studies in prior
decades.

Page 43
Root Causes
♦ “NASA has commissioned several studies to determine primarycontributing factors to cost and schedule growth.
♦ These studies, as well as others in the field, identified severalcommon themes: • There is significant optimism in initial designs.• There are changes in scope associated with design evolution over time. • There is inherent technical difficulty developing world class technologies.• There are external influences on the project such as funding instability.”
Gary P. Pullman, Vice President Aerospace Corporation 2009
♦ There are thousands of valid studies on this phenomenon• The same recurring themes always surface.
Despite countless attempts to rectify what has proven to be a formidable challenge, cost overruns
& schedule slips continue.

Page 44
Random Walk
♦ Projects can be compared to a random walk♦ There are many possible destinations
• Every decision made along the way affects the outcome• The final destination is not known until the walk is completed
♦ The estimate is usually prepared for the “Low Cost” routeHigh Cost Med Cost Low Cost

Page 45
Additional Excerpts of Christopher Scolese Testimony
♦ Probabilistic estimating provides NASA with an approach that fully integrates technical, cost, and schedule plans and risks to develop both an understanding of the sensitivity of parameters to each other and the most likely estimate. • Using this approach allows NASA to understand and document how the mitigation
of technical risks would enable an increase in project confidence level. • Conversely, introduction of a budget reduction would increase technical and
schedule risks and thus lower confidence level for the project. ♦ Use of probabilistic estimates also generates baseline values that include funding
to address impacts associated with contingencies and uncertainties, such as industrial base, partner performance and technology optimism.
♦ Introduction of probabilistic joint cost and schedule estimating puts NASA on the leading edge of applying these techniques in both the federal and space sectors.
♦ This estimating approach requires employment of new tools and techniques, full implementation will take some time; • Given the deployment and typical project development cycle of 3-5 years, it is
unlikely NASA will be able to evaluate impact of changes for a few more years. ♦ Further, as we implement this joint confidence level policy, we are looking back at
existing projects in development to ascertain risks and make adjustments where prudent to improve our cost and schedule posture.

Page 46
Initial Estimate of 1st Launch - June 1976This is the 2nd schedule from 1972 – 1st Flight April 1981

♦ People Don’t Understand Risk• Recent study ½ people don’t understand
what 20% chance of rain means• Odds of making mistake lower if chance
of rain and no chance of rain given♦ Underestimates Nothing New
• US 1st aircraft development project 1898• 400% over schedule• 40% over budget• Failed & Canceled!
♦ How We Underestimate• We actively mitigate safety risks with
probability of occurrence of 2000 to 1 (0.0005%)
• Or 99.95% probability will NOT happen• But routinely ignore costs risks
♦ Escalation• Civil Servant Raises past 61 Years• 10% or more 4 times• 6% or more 12 times• New Start projections ~90% 2.6% rate will
be exceed (50 years of History)
♦ Space Shuttle• Two week turnaround requirement• 6 months historical time (Apollo, mercury)
♦ Human Space Flight• If the last 5 times I crossed the street I
got hit by a car • What should I expect when I cross the
street again?
• Apollo Program Initial estimate 4-25-1958 1.5 Billion – Air Force Ballistic Missile Division
• NASA Created 6-29-58• Apollo 1 Fire Jan 27-1967 – 21 month
delay• Apollo program final costs $20-$25 Billion