Embed Size (px)
Citation preview
Roundtable II
Cooperation in Technology Transfer
Tuesday, 29 November 2005Tuesday, 29 November 2005Vienna, AustriaVienna, Austria
Structure of the PresentationStructure of the Presentation
Technology Transfer - Insight
Technology Competitiveness in Developing countries - Factors
Technology Upgradation - Hindsight
Technology Development – Challenges
India – Case studies
Technology Transfer – Way Ahead
Technology Transfer - Technology Transfer - InsightInsight
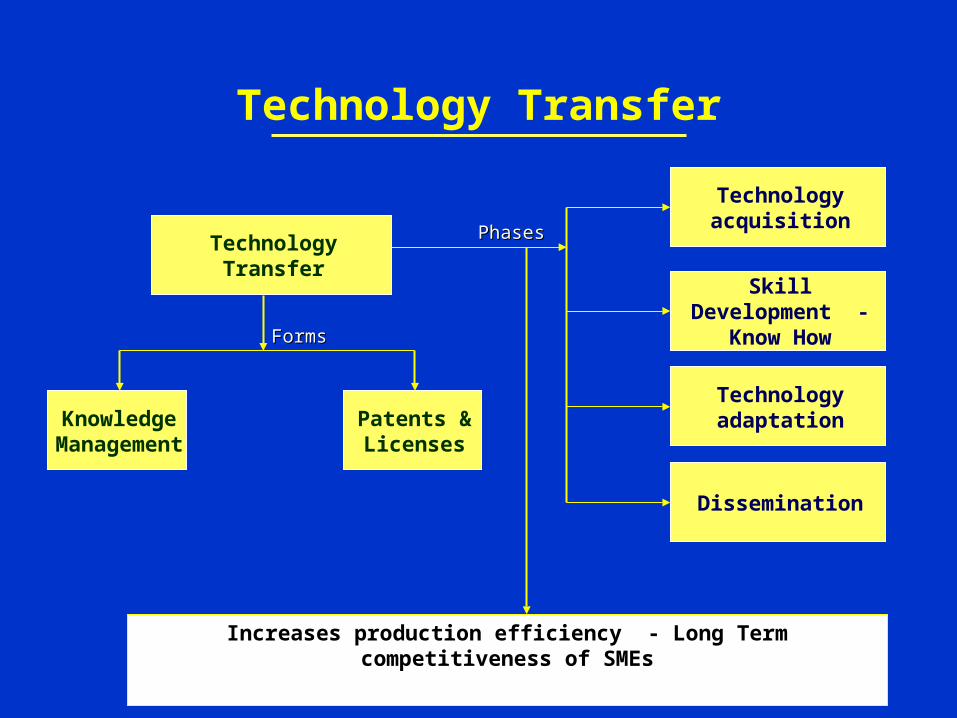
Technology Transfer
Knowledge Management
Patents & Licenses
Technology Transfer
Technology acquisition
Skill Development - Know How
Technology adaptation
Dissemination
FormsForms
PhasesPhases
Increases production efficiency - Long Term competitiveness of SMEs
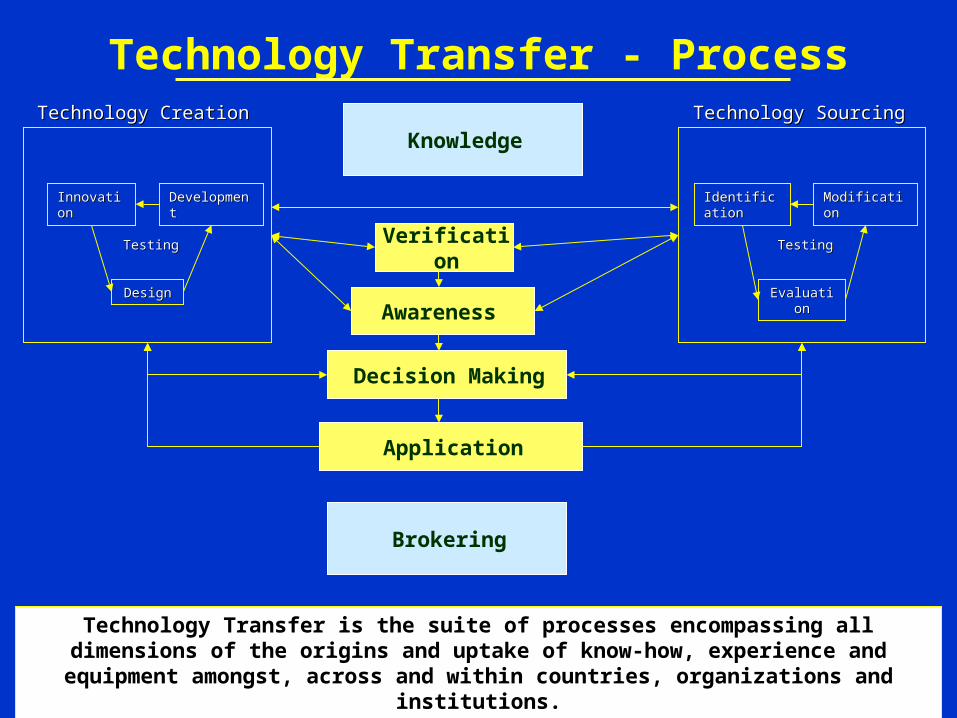
Technology Transfer - Process
Verification
Knowledge
Awareness
Decision Making
Application
Brokering
DevelopmentDevelopmentInnovationInnovation
DesignDesign
TestingTesting
Technology CreationTechnology Creation
ModificationModificationIdentificationIdentification
EvaluationEvaluation
TestingTesting
Technology SourcingTechnology Sourcing
Technology Transfer is the suite of processes encompassing all dimensions of the origins and uptake of know-how, experience and equipment amongst, across and within
countries, organizations and institutions.
Technology Transfer – Main Issues
Slow uptake of technologies that support sustainable development, despite many initiatives for increased and effective transfer of technologies.
Need to emphasize on specific and practical methodologies and tools for promoting the adoption and use of latest technologies.
Absence of ubiquitous approach. Need to prioritize initiatives for developing countries depending on their needs and status.
Technology Competitiveness in Technology Competitiveness in Developing countries - FactorsDeveloping countries - Factors

Technology Competitiveness in Developing countries - Factors
Technology imports• Small number of developed countries provide most of technological
innovations. Most of the developing countries are neither innovating nor adopting. <Technology innovating economies..>
• Lacks capability to create globally competitive technologies• Lack of access to information on new technologies and innovations
Technology infrastructure• R&D institutes and testing facilities in developing countries fall short
of quality when compared to industrialized countries• Lack of collaborative research• Isolation of universities and R&D from Industry

Technology Competitiveness in Developing countries - Factors
Pace of technological change• SMEs lack the capability to constantly upgrade technologies in view
of rapidly changing technologies in developed countries• Easier in Process industries
Technology acquisition• Unit level technology absorption is low• Lack of incentive, direction and capability to update existing
technologies• Lack of ready access to capital• Relatively high transaction cost
Technology Competitiveness in Developing countries - Factors
Unit Level Interventions• Smaller firms find difficult to finance and coordinate the requisite
level of technological activity• Low participation in network of organizations and institutions
involved in diffusing information on technologies. (specially SMEs)
Availability of Skilled Manpower• Shortage of trained personnel• Lack of continuous capability development of manpower in technical
dimensions• New technologies are not adopted due to lack of skilled people thus
widening the technology gap.
Technology Upgradation - Technology Upgradation - HindsightHindsight
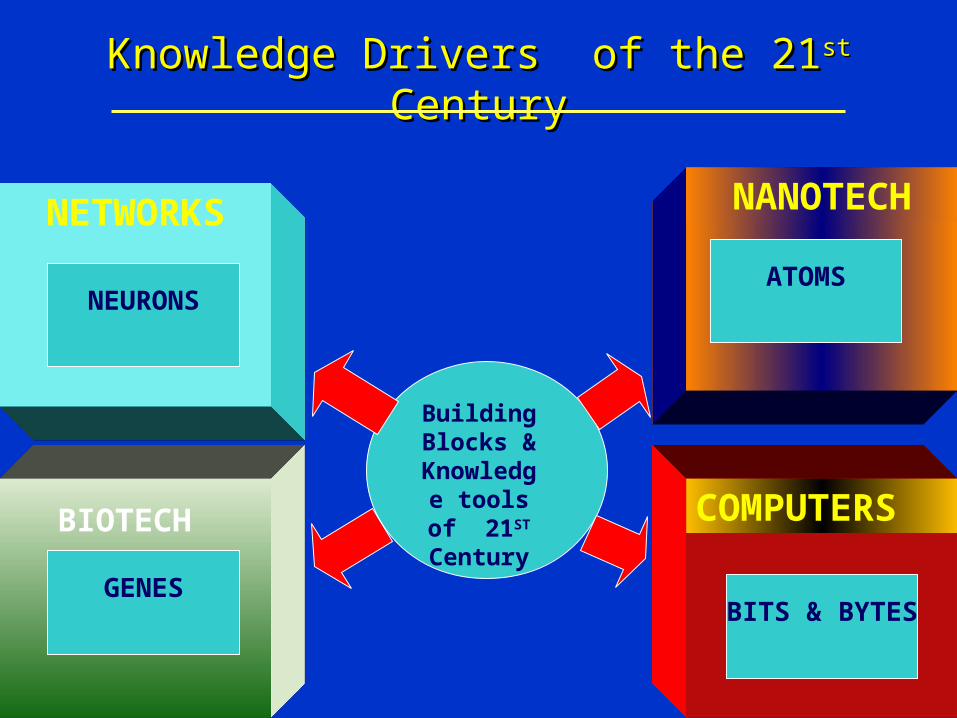
Knowledge Drivers of the 21Knowledge Drivers of the 21stst Century Century
Building Blocks &
Knowledge tools of
21ST Century
NETWORKS NANOTECH
COMPUTERS
NEURONSATOMS
BITS & BYTES
BIOTECH
GENES
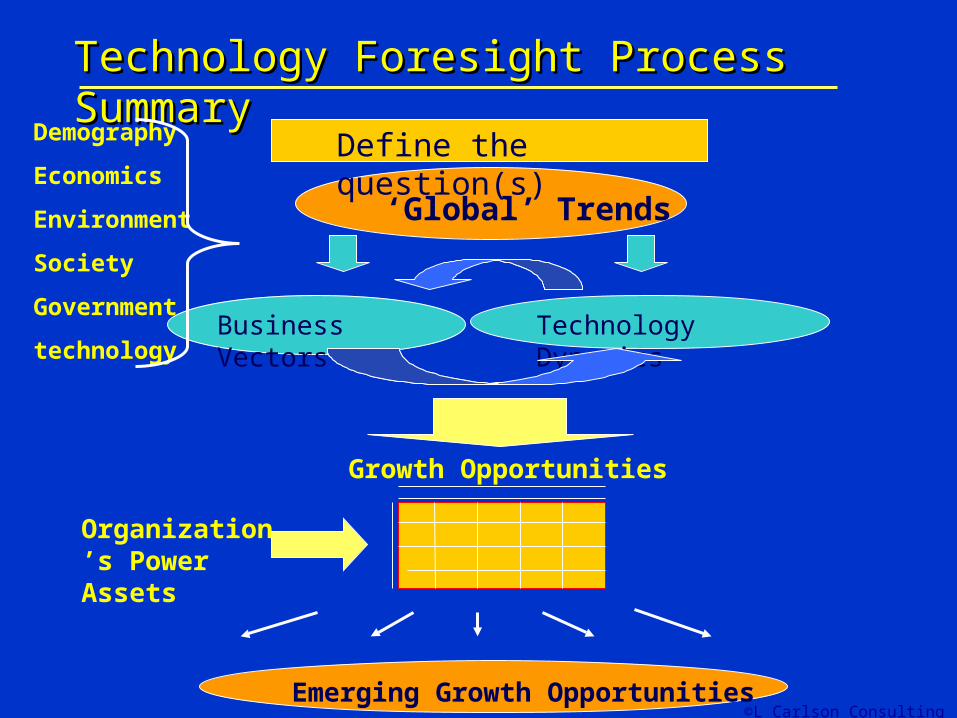
Technology Foresight Process SummaryTechnology Foresight Process Summary
‘Global’ Trends
Business Vectors Technology Dynamics
Growth Opportunities
Organization’s Power Assets
Emerging Growth Opportunities©L Carlson Consulting
Define the question(s)Demography
Economics
Environment
Society
Government
technology
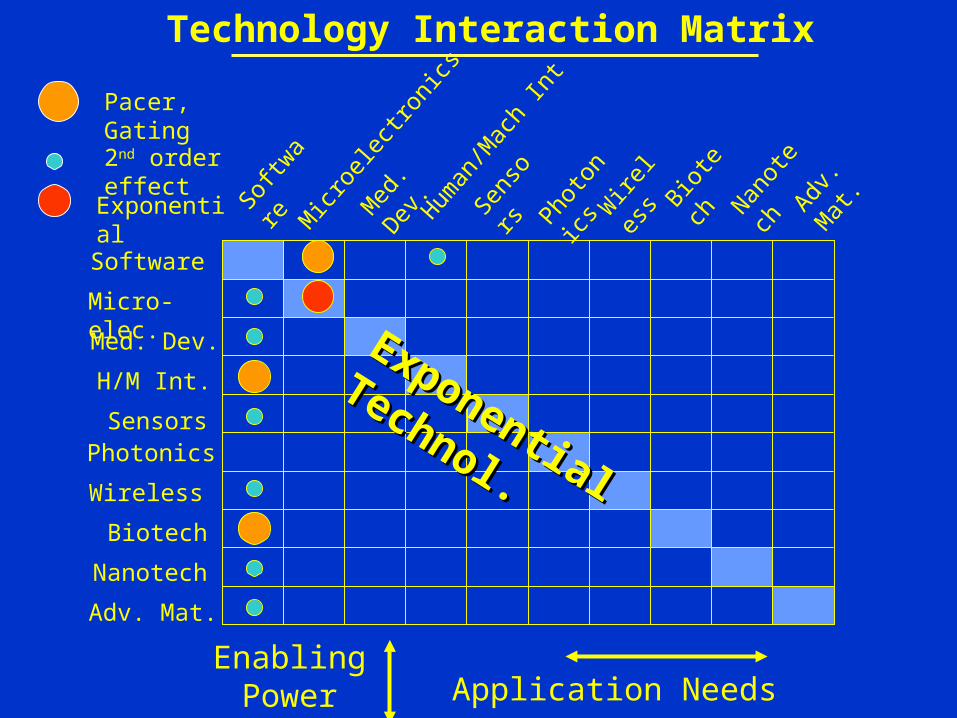
Technology Interaction Matrix
Software
H/M Int.
Med. Dev.
SensorsPhotonics
Wireless
Biotech
Nanotech
Adv. Mat.
Micr
oelec
tronic
s
Softw
are
Human
/Mac
h Int
Med
. Dev
.
Sens
orsPh
otonic
sW
ireles
sBiot
ech
Nanote
chAdv
. Mat.
EnablingPower Application Needs
Micro-elec.
Pacer, Gating
2nd order effect
Exponential Technol.
Exponential Technol.
Exponential
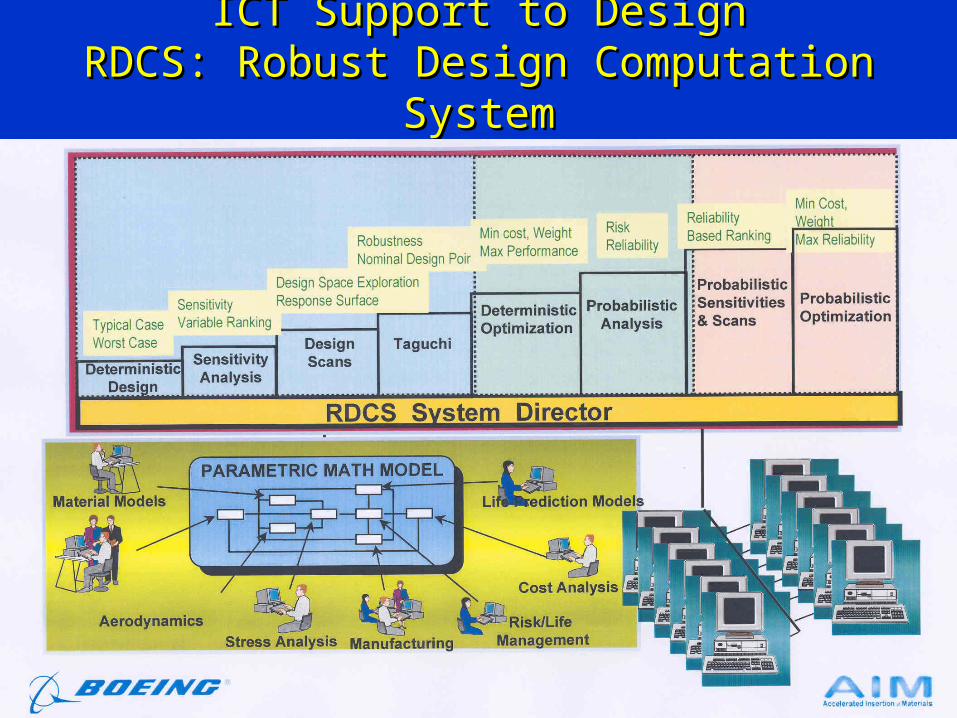
ICT Support to DesignICT Support to DesignRDCS: Robust Design Computation SystemRDCS: Robust Design Computation System
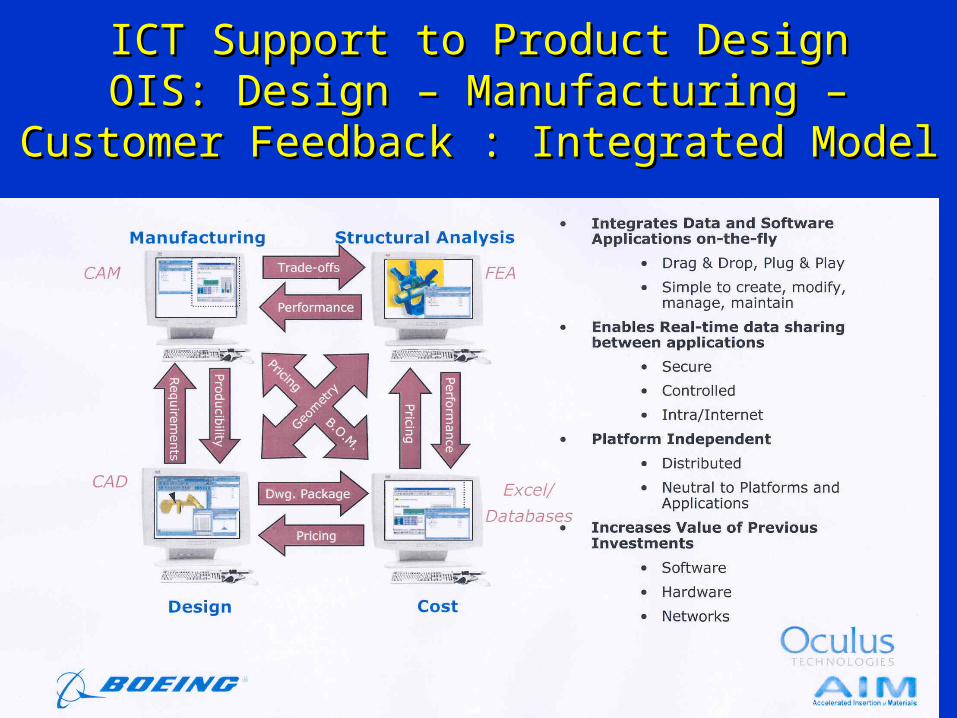
ICT Support to Product DesignICT Support to Product DesignOIS: Design – Manufacturing – Customer OIS: Design – Manufacturing – Customer
Feedback : Integrated ModelFeedback : Integrated Model
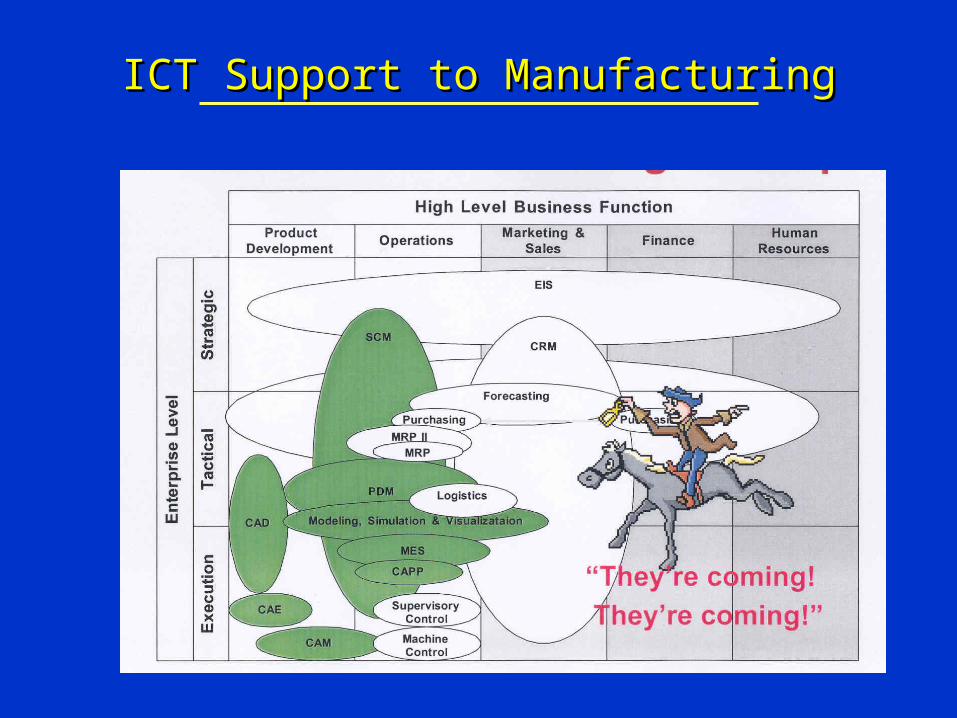
ICT Support to ManufacturingICT Support to Manufacturing
Customer Relationship ManagementCustomer Relationship Management (CRM) (CRM) Systems that allow you to manage relationshipSystems that allow you to manage relationship Strategy that puts the customer first, it's getting intimate with the Strategy that puts the customer first, it's getting intimate with the
customer - solidifying loyaltycustomer - solidifying loyalty Understanding and tracking customer habitsUnderstanding and tracking customer habits Links data together from all parts of the businessLinks data together from all parts of the business Warehouse of all the info of your customerWarehouse of all the info of your customer Maximizer, ACT!, Salesforce.com, Pivotal Maximizer, ACT!, Salesforce.com, Pivotal
Customer Relationship ManagementCustomer Relationship Management (CRM) (CRM)
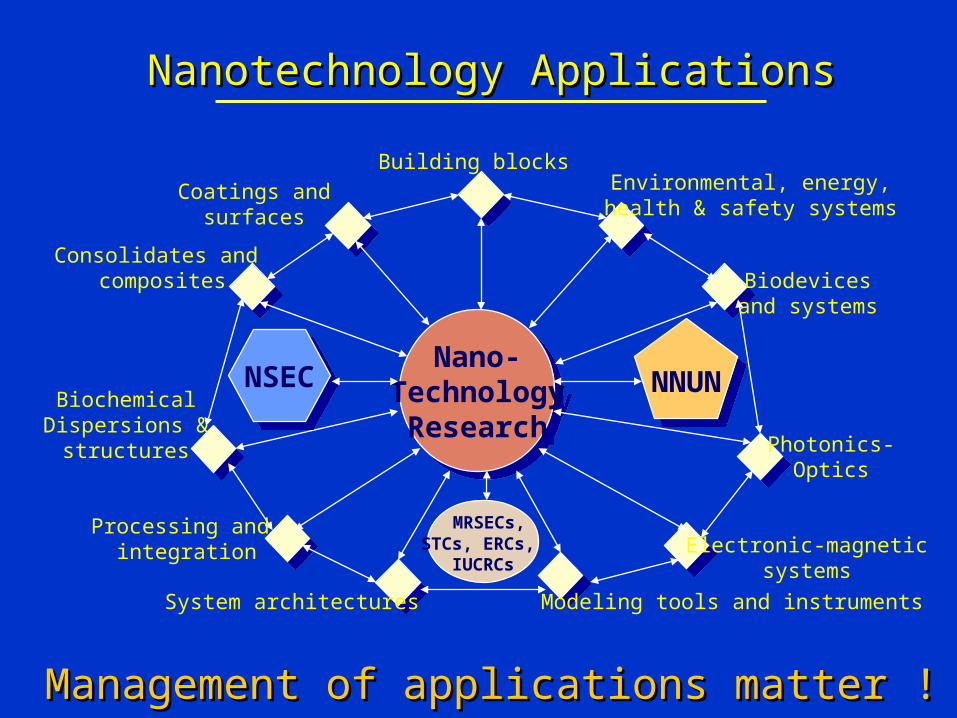
Nanotechnology ApplicationsNanotechnology Applications
Nano-Technology
ResearchNNUNNSEC
Building blocksCoatings and surfaces
Consolidates and composites
BiochemicalDispersions &
structures
Processing and integration
System architectures Modeling tools and instruments
Electronic-magneticsystems
Photonics-Optics
Biodevicesand systems
Environmental, energy,health & safety systems
MRSECs,STCs, ERCs,
IUCRCs
Management of applications matter !Management of applications matter !
Technology Development – Technology Development – ChallengesChallenges
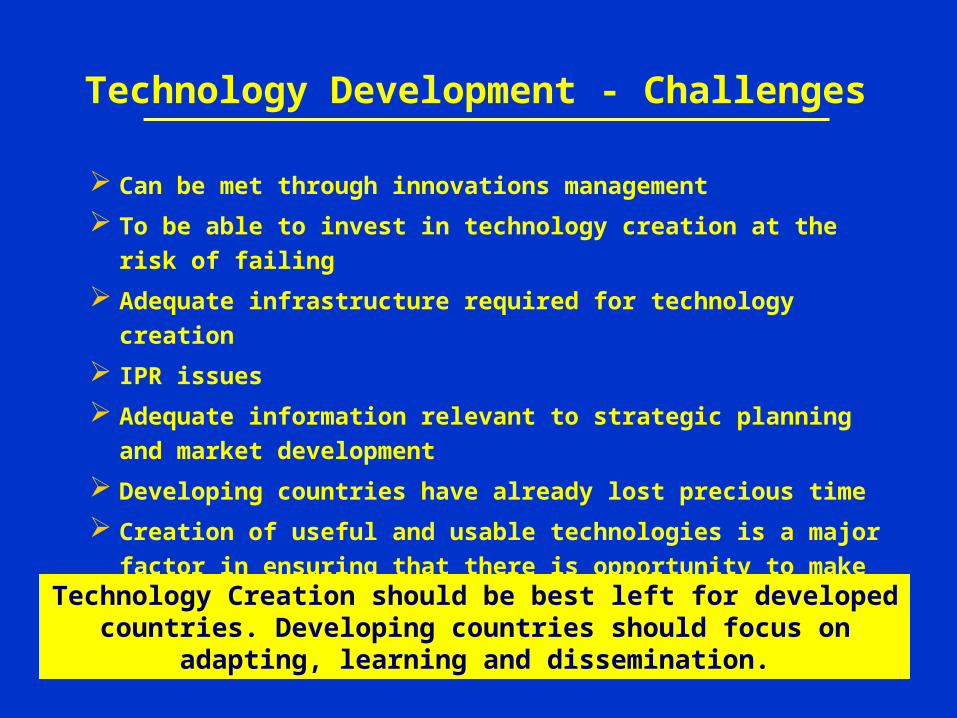
Technology Development - Challenges
Can be met through innovations management To be able to invest in technology creation at the risk of failing Adequate infrastructure required for technology creation IPR issues Adequate information relevant to strategic planning and market
development Developing countries have already lost precious time Creation of useful and usable technologies is a major factor in
ensuring that there is opportunity to make informed and confident choices in technology investment projects
Technology Creation should be best left for developed countries. Developing countries should focus on adapting, learning and
dissemination.
India – Case StudiesIndia – Case Studies
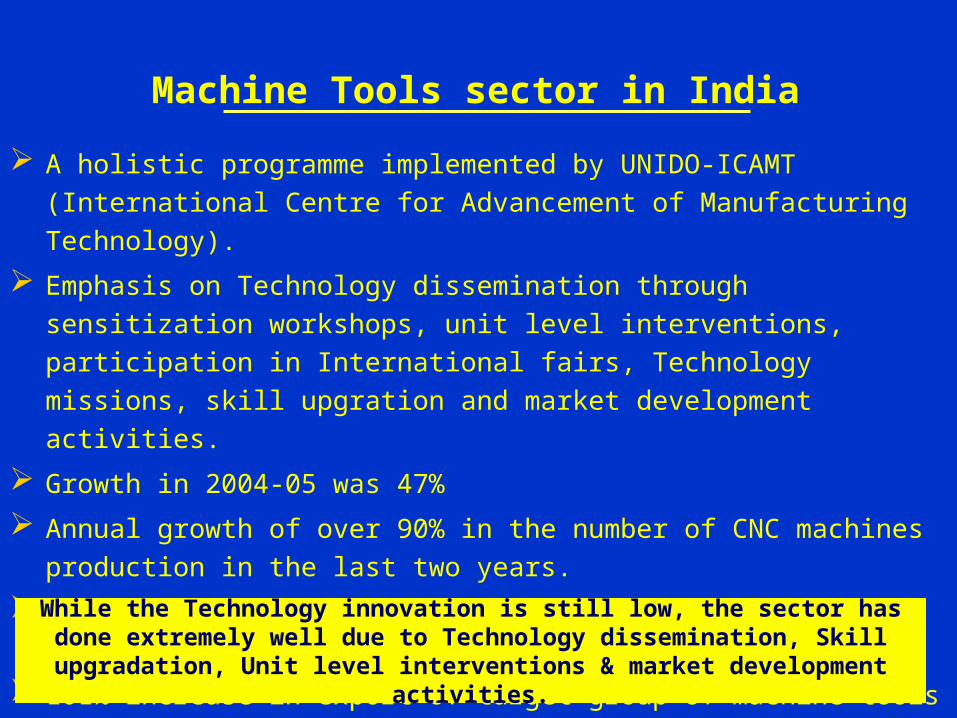
Machine Tools sector in India
A holistic programme implemented by UNIDO-ICAMT (International Centre for Advancement of Manufacturing Technology).
Emphasis on Technology dissemination through sensitization workshops, unit level interventions, participation in International fairs, Technology missions, skill upgration and market development activities.
Growth in 2004-05 was 47% Annual growth of over 90% in the number of CNC machines production in
the last two years. 50% increase in production of components and accessories. 101% increase in export of target group of machine tools – from USD 6.6
million to USD 13.3 million While the Technology innovation is still low, the sector has done extremely
well due to Technology dissemination, Skill upgradation, Unit level interventions & market development activities.
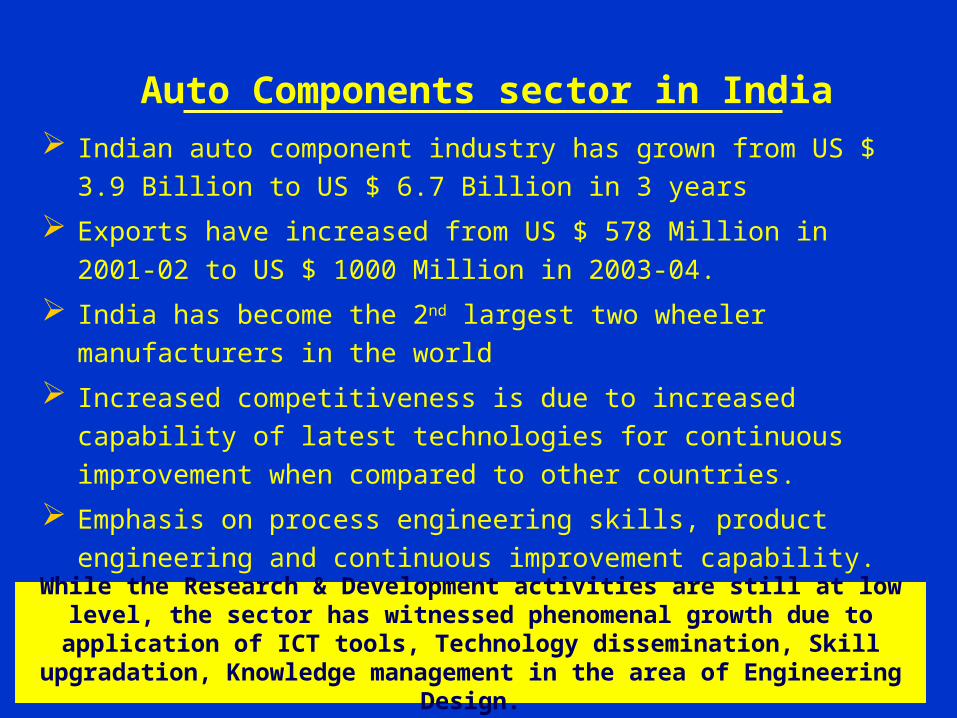
Auto Components sector in India Indian auto component industry has grown from US $ 3.9 Billion to US
$ 6.7 Billion in 3 years Exports have increased from US $ 578 Million in 2001-02 to US $
1000 Million in 2003-04. India has become the 2nd largest two wheeler manufacturers in the
world Increased competitiveness is due to increased capability of latest
technologies for continuous improvement when compared to other countries.
Emphasis on process engineering skills, product engineering and continuous improvement capability.
While the Research & Development activities are still at low level, the sector has witnessed phenomenal growth due to application of ICT tools,
Technology dissemination, Skill upgradation, Knowledge management in the area of Engineering Design.
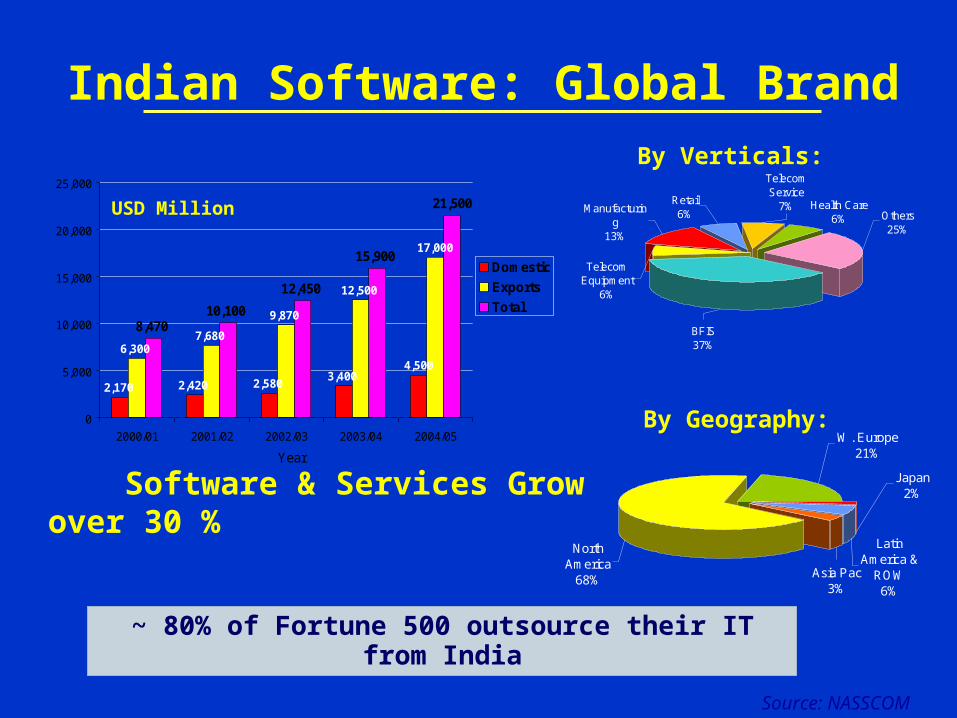
Indian Software: Global Brand
2,170 2,420 2,580 3,4004,500
6,3007,680
9,870
12,500
17,000
8,47010,100
12,450
15,900
21,500
0
5,000
10,000
15,000
20,000
25,000
2000/01 2001/02 2002/03 2003/04 2004/05
Year
DomesticExportsTotal
USD Million
Source: NASSCOM
Software & Services Grow over 30 %
Health Care6% Others
25%
Telecom Service
7%
Telecom Equipment
6%
Manufacturing
13%
BFIS37%
Retail 6%
Asia Pac3%
W. Europe21%
Japan2%
North America
68%
Latin America &
ROW6%
By Verticals:
By Geography:
~ 80% of Fortune 500 outsource their IT from India
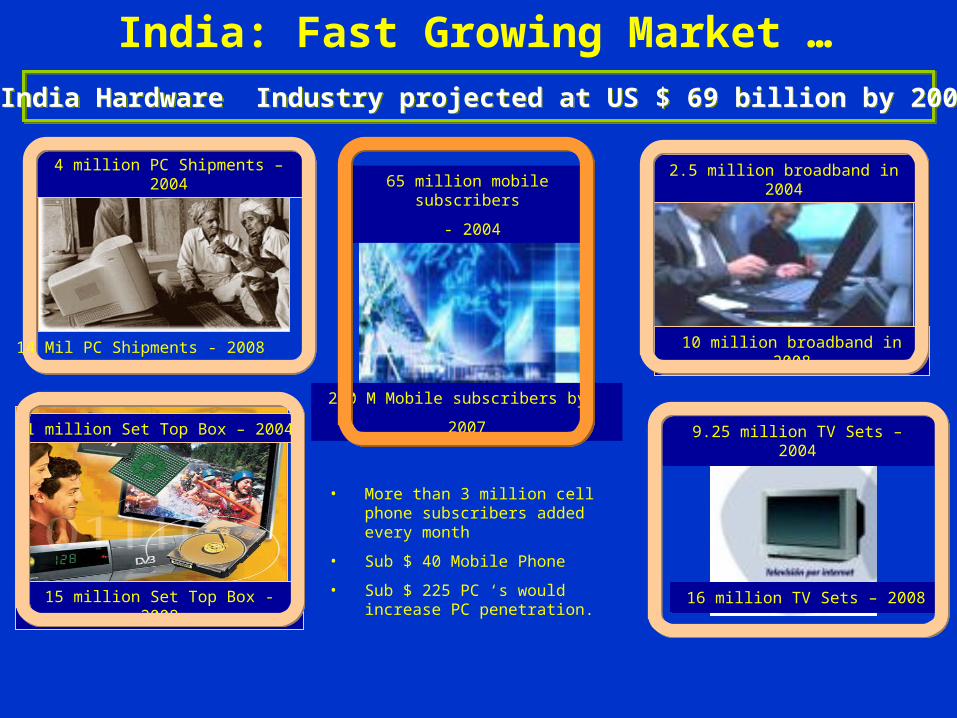
2.5 million broadband in 2004
10 million broadband in 2008
India: Fast Growing Market …
9.25 million TV Sets – 2004
16 million TV Sets – 2008
4 million PC Shipments – 200465 million mobile subscribers
- 2004
200 M Mobile subscribers by
20071 million Set Top Box – 2004
15 million Set Top Box - 2008
• More than 3 million cell phone subscribers added every month
• Sub $ 40 Mobile Phone
• Sub $ 225 PC ‘s would increase PC penetration.
India Hardware Industry projected at US $ 69 billion by 2008
14 Mil PC Shipments - 2008
Indian IT IndustryIndian IT Industry
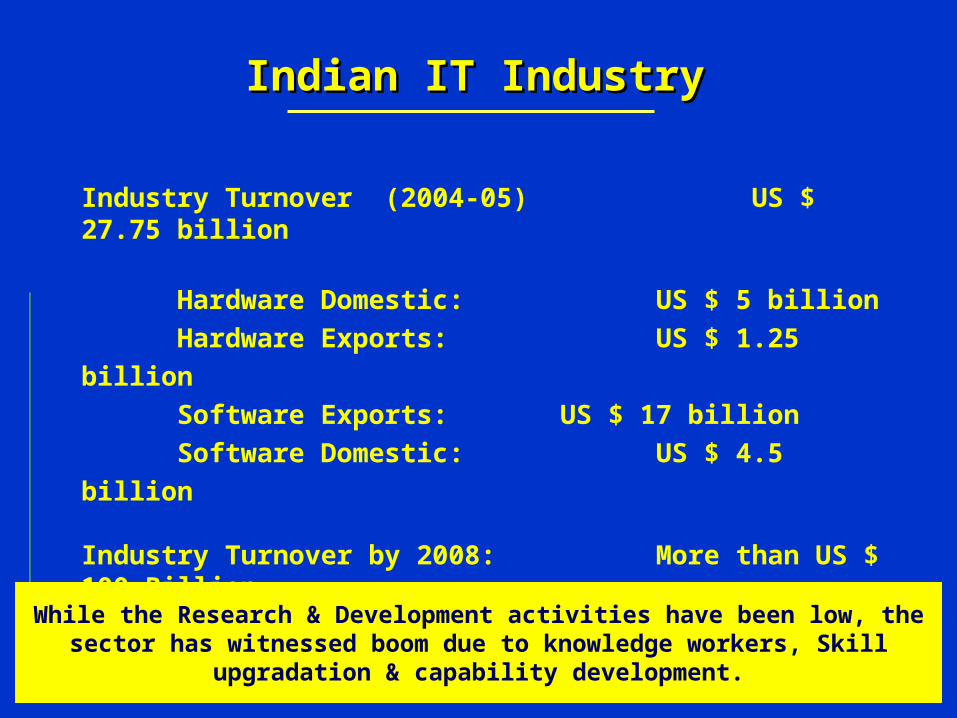
Industry Turnover (2004-05) US $ 27.75 billion
Hardware Domestic: US $ 5 billionHardware Exports: US $ 1.25 billionSoftware Exports: US $ 17 billionSoftware Domestic: US $ 4.5 billion
Industry Turnover by 2008: More than US $ 100 Billion
While the Research & Development activities have been low, the sector has witnessed boom due to knowledge workers, Skill upgradation & capability
development.
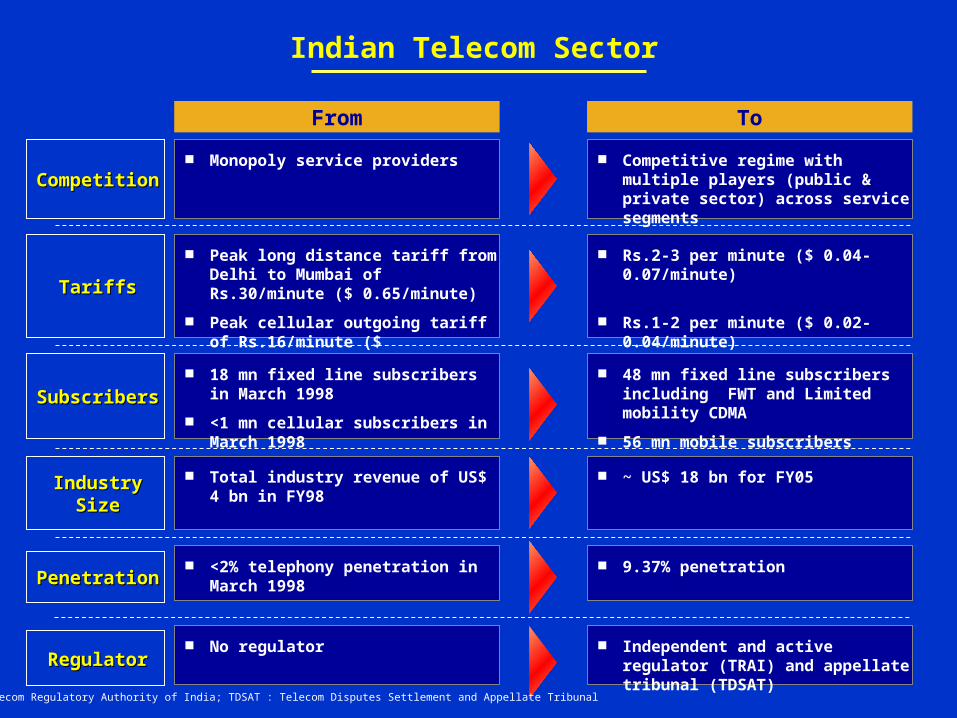
Monopoly service providers Competitive regime with multiple
players (public & private sector) across service segments
Peak long distance tariff from Delhi to Mumbai of Rs.30/minute ($ 0.65/minute)
Peak cellular outgoing tariff of Rs.16/minute ($ 0.35/minute)
Rs.2-3 per minute ($ 0.04-0.07/minute)
Rs.1-2 per minute ($ 0.02-0.04/minute)
CompetitionCompetition
TariffsTariffs
From To
18 mn fixed line subscribers in March 1998
<1 mn cellular subscribers in March 1998
48 mn fixed line subscribers including FWT and Limited mobility CDMA
56 mn mobile subscribers
SubscribersSubscribers
Total industry revenue of US$ 4 bn in FY98
~ US$ 18 bn for FY05
<2% telephony penetration in March 1998
9.37% penetration
Industry SizeIndustry Size
PenetrationPenetration
No regulator Independent and active regulator (TRAI) and appellate tribunal (TDSAT)RegulatorRegulator
TRAI: Telecom Regulatory Authority of India; TDSAT : Telecom Disputes Settlement and Appellate Tribunal
Indian Telecom Sector
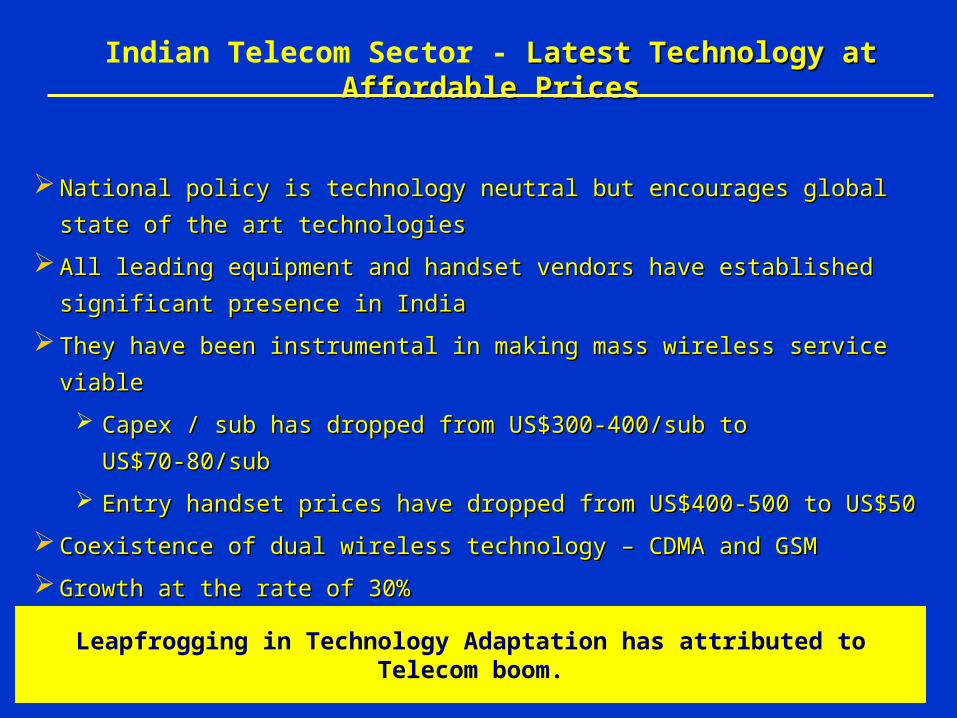
Indian Telecom Sector - Latest Technology at Affordable PricesLatest Technology at Affordable Prices
National policy is technology neutral but encourages global state of the National policy is technology neutral but encourages global state of the
art technologiesart technologies
All leading equipment and handset vendors have established significant All leading equipment and handset vendors have established significant
presence in Indiapresence in India
They have been instrumental in making mass wireless service viableThey have been instrumental in making mass wireless service viable
Capex / sub has dropped from US$300-400/sub to US$70-80/subCapex / sub has dropped from US$300-400/sub to US$70-80/sub
Entry handset prices have dropped from US$400-500 to US$50Entry handset prices have dropped from US$400-500 to US$50
Coexistence of dual wireless technology – CDMA and GSMCoexistence of dual wireless technology – CDMA and GSM
Growth at the rate of 30%Growth at the rate of 30%
Leapfrogging in Technology Adaptation has attributed to Telecom boom.
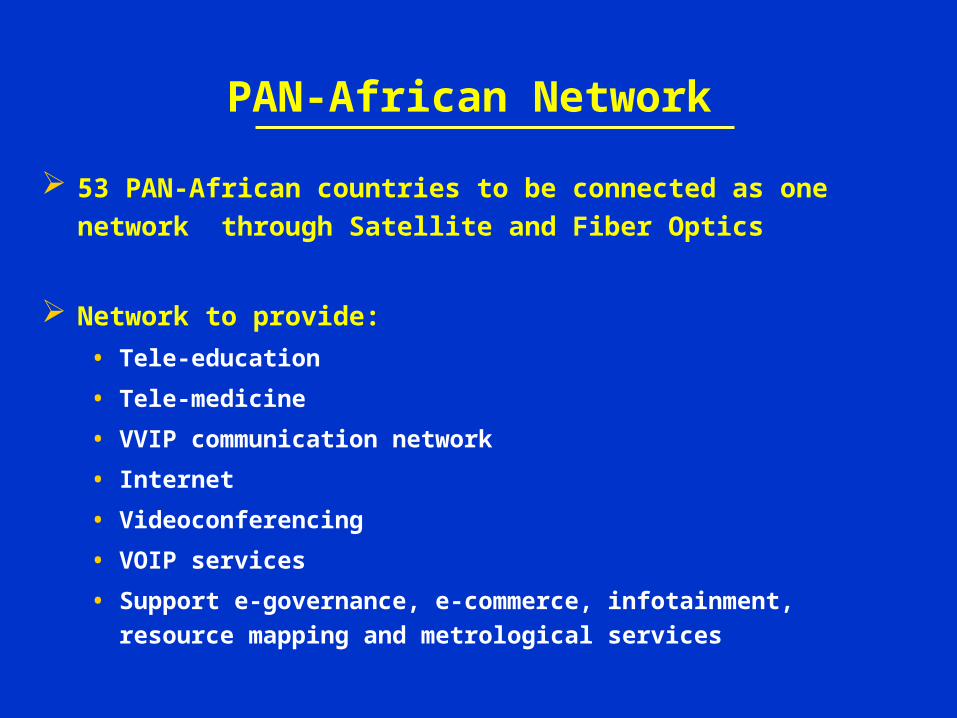
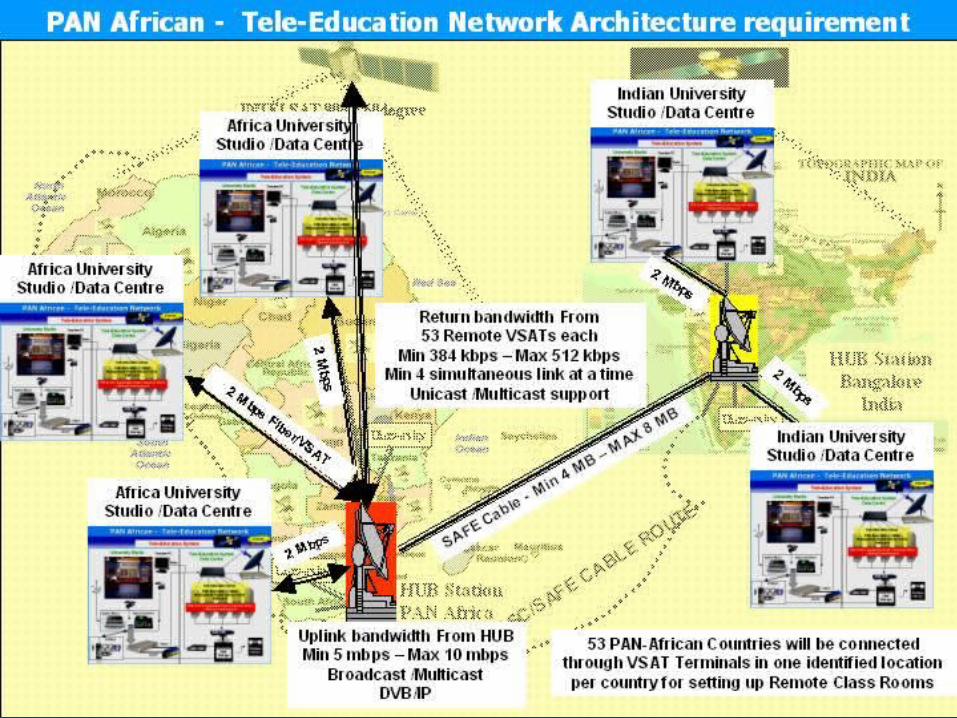
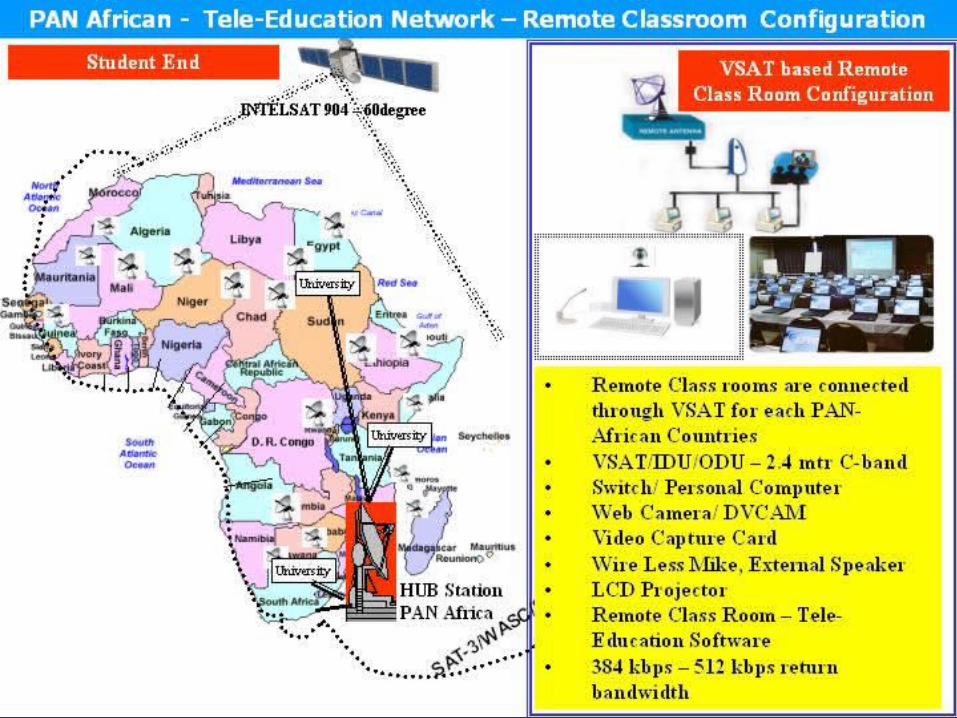
PAN-African Network 53 PAN-African countries to be connected as one network
through Satellite and Fiber Optics
Network to provide:• Tele-education• Tele-medicine• VVIP communication network• Internet• Videoconferencing• VOIP services• Support e-governance, e-commerce, infotainment, resource mapping
and metrological services
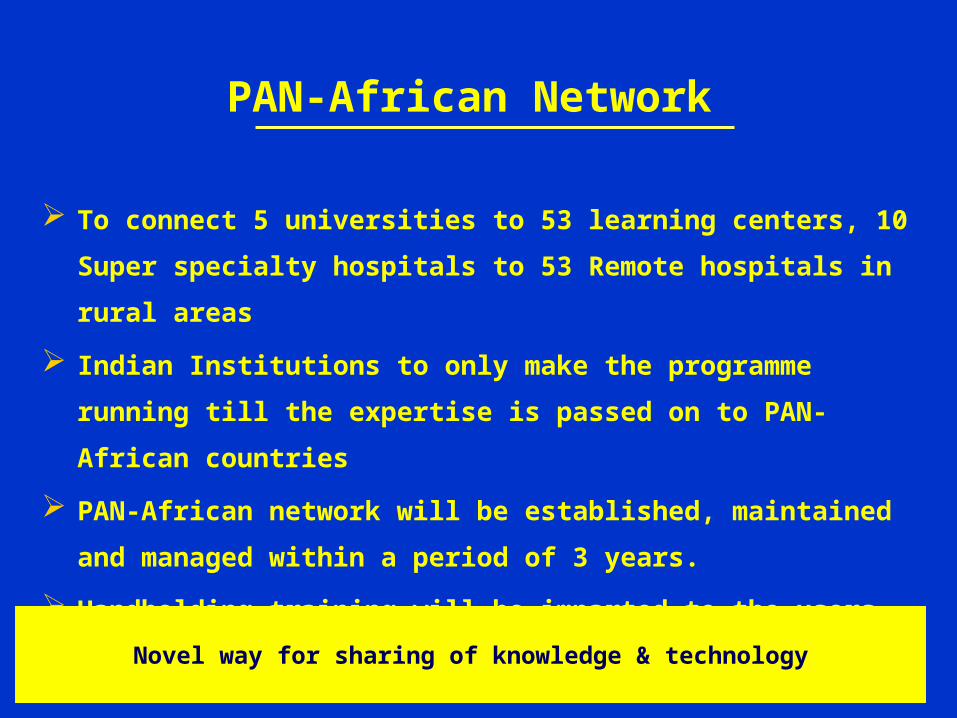
PAN-African Network To connect 5 universities to 53 learning centers, 10 Super
specialty hospitals to 53 Remote hospitals in rural areas
Indian Institutions to only make the programme running till the expertise is passed on to PAN-African countries
PAN-African network will be established, maintained and managed within a period of 3 years.
Handholding training will be imparted to the users and handed over by the end of 3 years
Novel way for sharing of knowledge & technology

Technology Transfer – Way Technology Transfer – Way AheadAhead
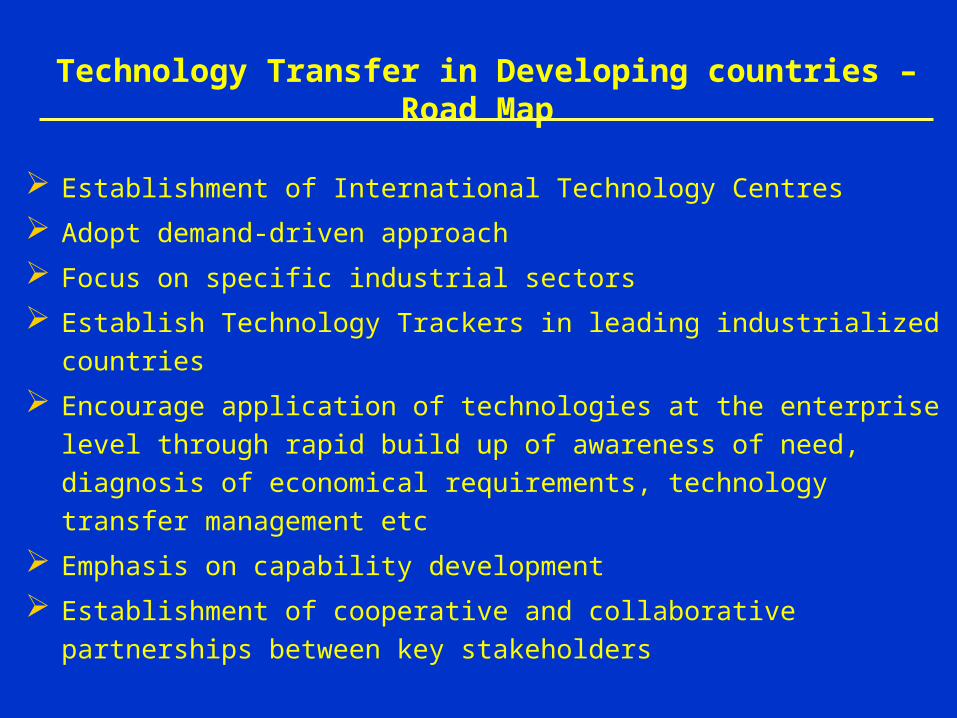
Technology Transfer in Developing countries – Road Map
Establishment of International Technology Centres Adopt demand-driven approach Focus on specific industrial sectors Establish Technology Trackers in leading industrialized countries Encourage application of technologies at the enterprise level through rapid
build up of awareness of need, diagnosis of economical requirements, technology transfer management etc
Emphasis on capability development Establishment of cooperative and collaborative partnerships between key
stakeholders
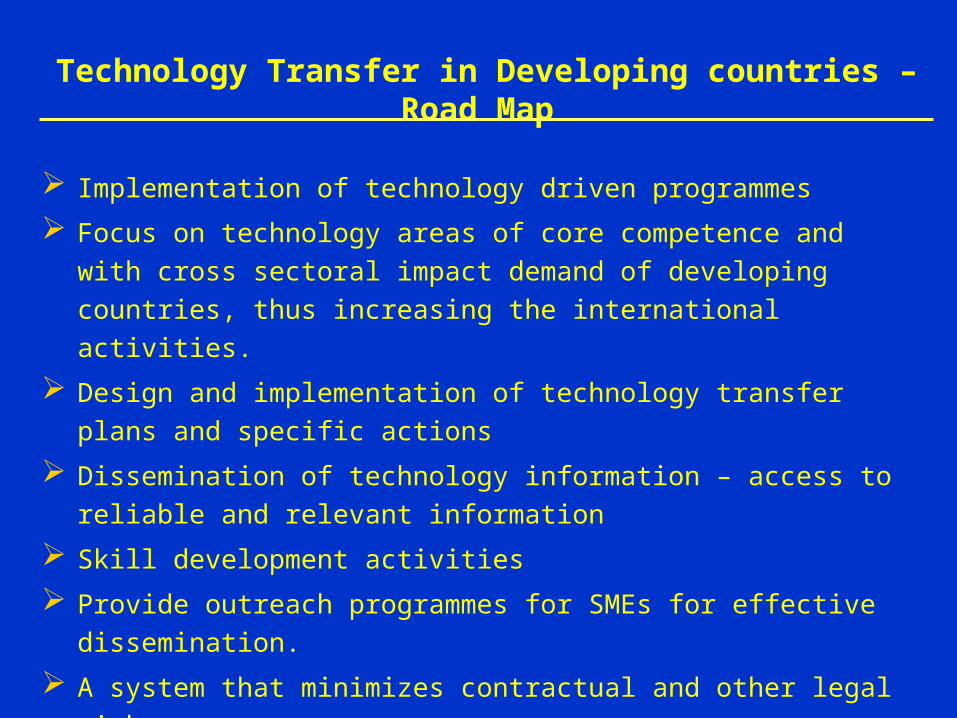
Implementation of technology driven programmes Focus on technology areas of core competence and with cross
sectoral impact demand of developing countries, thus increasing the international activities.
Design and implementation of technology transfer plans and specific actions
Dissemination of technology information – access to reliable and relevant information
Skill development activities Provide outreach programmes for SMEs for effective dissemination. A system that minimizes contractual and other legal risks. Access to Decision Support Tools.
Technology Transfer in Developing countries – Road Map
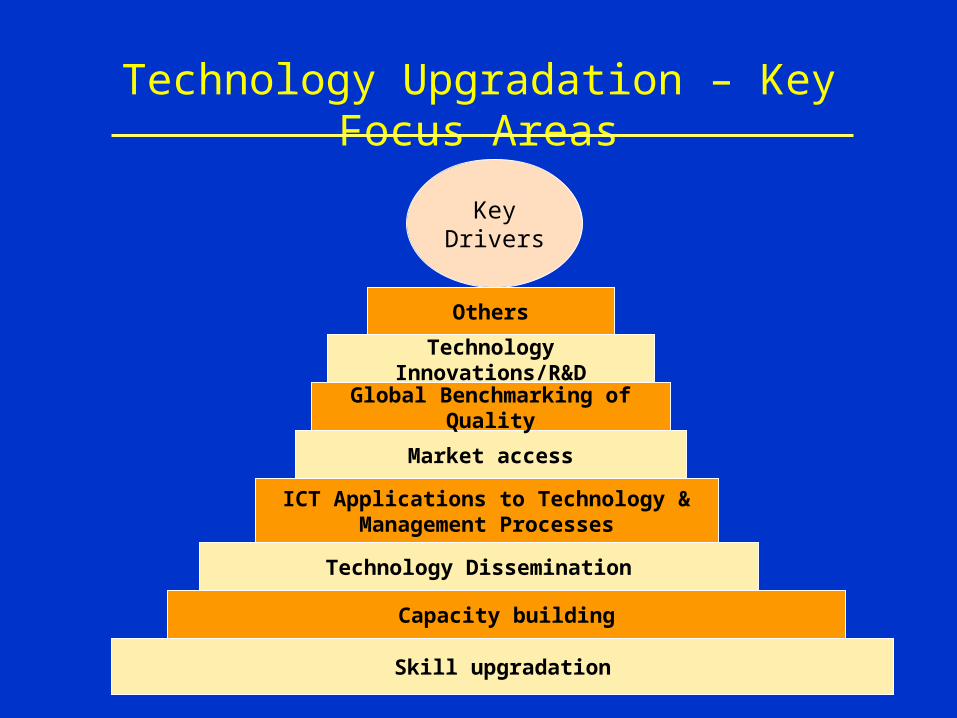
Technology Upgradation – Key Focus Areas
Skill upgradation
Capacity building
Technology Dissemination
ICT Applications to Technology & Management Processes
Market access
Global Benchmarking of Quality
Technology Innovations/R&D
Others
Key Drivers

Thank YouThank You
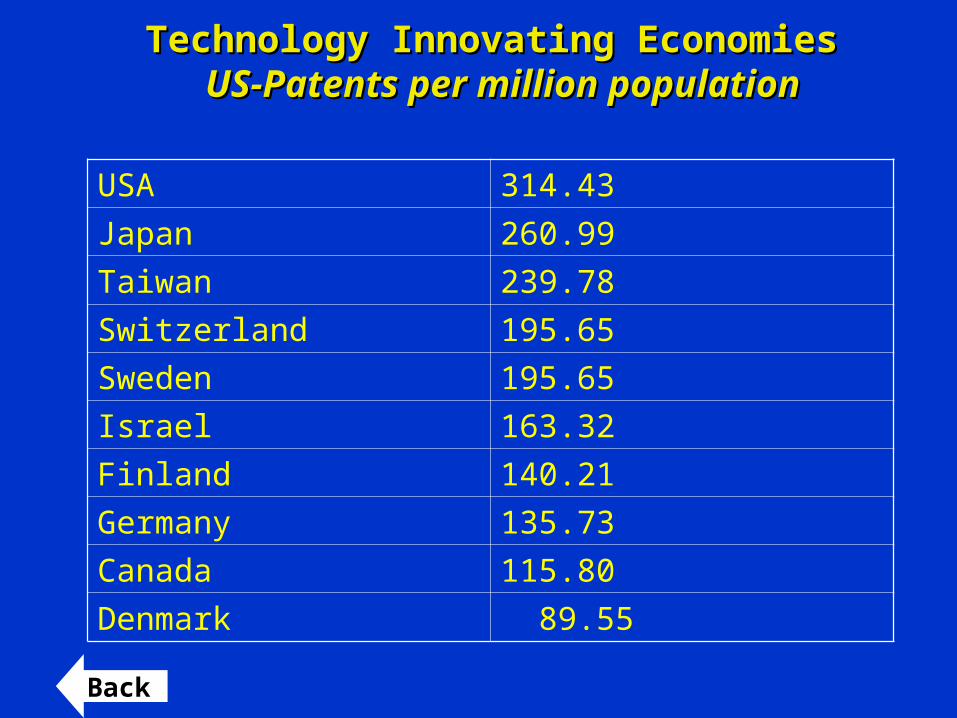
Technology Innovating Economies Technology Innovating Economies US-Patents per million populationUS-Patents per million population
USA 314.43Japan 260.99Taiwan 239.78Switzerland 195.65Sweden 195.65Israel 163.32Finland 140.21Germany 135.73Canada 115.80Denmark 89.55
Back