Embed Size (px)
Citation preview

開放資料暨資料視覺化 (D3.js)May 27, 2015
2015 Spring Web Programming, NCCU唐維佋 (pa4373 <AT> gmail.com)
Licensed by CC-By 4.0
1

Before we start
2
● Download Startkit● Download Apache OpenOffice● For those who use Chrome: (ajax issue)
○ Use Firefox! (it won’t burn your computer)○ Windows: https://code.google.com/p/mongoose/○ OS X / Linux:$ python -m SimpleHTTPServerServing HTTP on 0.0.0.0 port 8000 ...
127.0.0.1 - - [27/May/2015 00:33:23] "GET / HTTP/1.1" 200 -
127.0.0.1 - - [27/May/2015 00:33:23] "GET /js/d3.js HTTP/1.1" 200 -
127.0.0.1 - - [27/May/2015 00:33:23] "GET /js/app.js HTTP/1.1" 200 -

所有的源代碼都可在https://github.com/pa4373/tw-edu-colleges-grant找到
3

今天我們來聊聊
1. 何謂開放資料2. 何謂資料視覺化3. 兩者有何關聯4. 動手做看看!(With D3.js)
4

何謂開放資料 (Open Data)
開放資料就是把電子文件放到網站上就對了
5

6

問題出在哪?
● 妖壽讚?● 原檔以JPG / PDF 格式上傳,利用價值不高● 利用價值不高?
7

{
"name": "段緯宇",
"job": "議員",
"location": "日本, 四國",
"startDate": "2013-08-31T16:00:00.000Z",
"endDate": "2013-09-03T16:00:00.000Z",
"reportDate": "2013-09-04T16:00:00.000Z",
"purpose": "考察",
"report": "妖壽讚"
}
http://www.tccc.gov.tw/wb_introduction02.asp?cno=228&stno=01#top
8

來源:http://en.wikipedia.org/wiki/DIKW_Pyramid#/media/File:DIKW_Pyramid.svg
TED演講:Tim Berners-Lee 爵士 - 下一個網際網路 (http://www.ted.com/talks/tim_berners_lee_on_the_next_web) 9

10
開放無所不在
● 開放資料● 開放原始碼● 開放硬體● 開放內容
不受著作權、專利權等所限制,可自行散步以及
運用。

為何我們需要開放資料
● 人類產生新知識的迫切需要
● 網際網路的困境
11

開放資料從哪裡來
● 科學界● 政府● 企業● 學校● 你跟我● …...
12

政府的開放資料
● 公開透明● 監督政府● 便民
○ 與開發者的合作
● 資料 vs 電力
13

政府的開放資料
14
來源:http://www.mckinsey.com/insights/business_technology/open_data_unlocking_innovation_and_performance_with_liquid_information

英國政府的開放資料
● Crown copyright (皇家版權)
15她不是柴契爾夫人喔!

英國政府的開放資料
● The Guardian (衛報)● 2006年: “Free our data”
16

"如果鐵路以及電力由政府來營運才能穩定的話,為什麼像網際網路這種如此動態的知識經濟體需要被國營企業來掌控?"
17

英國政府的開放資料
● 2009年, Sir Tim Berners-Lee 與 Prof. Nigel Shadbolt 被英國首相Brown召見給予開放資料的意見
18

英國政府的開放資料
● 2010年:● data.gov.uk上線
○ 同月,data.london.gov.uk 也上線
● 英國政府釋出開放政府授權 (Open Government Licence)
● 英國圖形測量局發表創用CC授權的版本的地圖
19

英國政府的開放資料
● 2014:○ 根據評比,英國政府在開放資料的努力被評為第一○ mySociety (https://www.mysociety.org/)○ Open Data Institute (http://opendatainstitute.org/)
20

英國政府的開放資料: 加值應用
● Funding Options○ http://data.gov.uk/apps/funding-options○ https://www.fundingoptions.com/
21

英國政府的開放資料: 加值應用
● Who Shall I Vote For?○ http://data.gov.uk/apps/who-shall-i-vote○ http://www.whoshallivotefor.com/
22

美國政府的開放資料
● 2013年,歐巴馬的行政命令。● 開放且機器可讀的政府資料。(你看看人家都
有看到重點......)
23

美國政府的開放資料
● 聯邦政府: www.data.gov/● 地方政府
○ 紐約市: https://data.cityofnewyork.us/, the Big Apps○ 三藩市: http://datasf.org/○ 芝加哥: https://data.cityofchicago.org/
● Open Data 500: http://www.opendata500.com/
24

美國政府的開放資料: 加值應用
25
● www.alltuition.com○ 學費預測○ 財務援助○ 學貸償還

美國政府的開放資料
26
● PHL Crime Mapper: http://www.phlcrimemapper.com/

美國政府的開放資料: 資料梳理
27
● Enigma.io○ Public Data != Accessible Data○ 公私有資料結合查詢

台灣政府的開放資料
實價登錄事件
28http://mmdays.com/2012/11/15/和人民做朋友真的這麼難?民間版全台實價登錄網站的哀歌/

29來源

30
台灣政府的開放資料: g0v
好吧,它說對一件事情了......

32
台灣政府的開放資料: g0v
http://g0v.tw/zh-TW/index.html

33
台灣政府的開放資料: g0v
g0v 在太陽花學運:https://youtu.be/GwIMe3MNQ_Q?t=18m31s

34
台灣政府的開放資料
● Code for Tomorrow (http://cft.schee.info/)
● 媒合不同領域的資料供給者與需求者
● 孵育公民新創企業與人才
● 國際發展與合作

台灣政府的開放資料
● Open Data 聯盟: http://www.opendata4tw.org.tw/
● 台北市電腦商業同業公會之聯誼性聯盟● 跟政府關係良好,也常是民間跟政府要資料的
角色
35

台灣政府的開放資料
資料供給面:國發會
業界推廣宣導: 經濟部工業局
36

台灣政府的開放資料
2005: 政府資訊公開法
2011: http://data.taipei/2013: http://data.gov.tw/
37

台灣政府的開放資料
● 專屬格式的資料● API仍缺乏● 缺乏後續維護● 經費資源
38

台灣政府的開放資料
● 果菜花終端機
39

台灣政府的開放資料
● 三秒算房價
40

Raw Data vs API
API: 應用程式介面自己砍柴燒 v.s. 插座
Raw Data: 下載資料集,自己處理 (維護與更新)API: 閱讀文件,自行介接 (資料由提供者更新)
目前台灣都以Raw Data為主,極少有API
41

CSV
● 逗點分隔值(Comma-Separated Values)
42
Year,Make,Model,Description,Price1997,Ford,E350,"ac, abs, moon",3000.001999,Chevy,"Venture ""Extended Edition""","",4900.001999,Chevy,"Venture ""Extended Edition, Very Large""",,5000.001996,Jeep,Grand Cherokee,"MUST SELL!air, moon roof, loaded",4799.00

JSON
43
[
{
"Year": "1997",
"Make": "Ford",
"Model": "E350",
"Description": "ac, abs, moon",
"Price": "3000.00"
},
…….
{
"Year": "1996",
"Make": "Jeep",
"Model": "Grand Cherokee",
"Description": "MUST SELL!\nair, moon roof, loaded",
"Price": "4799.00"
}
]

XML
44
<?xml version="1.0" encoding="UTF-8" ?>
<0>
<Year>1997</Year>
<Make>Ford</Make>
<Model>E350</Model>
<Description>ac, abs, moon</Description>
<Price>3000.00</Price>
</0>
…….
<3>
<Year>1996</Year>
<Make>Jeep</Make>
<Model>Grand Cherokee</Model>
<Description>
MUST SELL!
air, moon roof, loaded</Description>
<Price>4799.00</Price>
</3>

資料星級
45
★ 以開放授權公布在網路上(無論什麼格式)
★★ 以可機讀的結構化資料形式散佈在網路上(如Excel)
★★★ 除了二星級的要求外,以非專有的檔案格式儲存(如CSV)
★★★★ 除以上要求以外,以W3C標準(RDF與SPARQL)使你的內容能被他人連結
★★★★★ 除以上要求以外,與他人的資料交互連結
http://www.w3.org/DesignIssues/LinkedData.html

46
文字編碼
● 數位資料本質是一連串的0與1● 要用0與1表示人類可理解的資料,需要一套設
計過的轉換規則,稱為編碼(Encoding)○ 1100001 代表 a○ 1100010 代表 b (ascii)
● Web與UNIX系統的默認編碼是UTF-8○ ex: 100111101001011 代表 ‘佋’
● Windows預設系統編碼是BIG5 (台灣繁中)● 使用正確的編碼才能打開文件

47
文字編碼
● 偵測工具: chardet.py, enca, file (UNIX)● 轉換工具: iconv (UNIX), ConvertZ (Win)

48
換行符
● 用來辨認換新一行的特殊符號● Windows: \r\n● UNIX: \n
The greater my wisdom, the\n
greater my grief.\n
To increase knowledge only\n
increases sorrow.\n
\n
Ecclesiastes 1:18
The greater my wisdom, the
greater my grief.
To increase knowledge only
increases sorrow.
Ecclesiastes 1:18
The greater my wisdom, the
greater my grief. To increase
knowledge only increases
sorrow.Ecclesiastes 1:18
UNIX系統上的樣子
Windows系統上的樣子
原始檔
Why?

49
Apache OpenOffice
● 免費開源的辦公室軟體● 跨OS、資料轉換提供豐富的選項
○ 各版本Excel支援度不一
● https://www.openoffice.org

動手實作
51

動手實作
● 刪除類別以及細項
● 將所有的”(先墊後支)”取代成空字串
● 依照大專院校名稱排序
● 合併同校預算○ 新增一個試算表 (移到A1)○ 資料 > 合併計算
● 重新命名欄位○ “大專院校名稱” > “schoolName”○ “補助經費” > “value”
52

動手實作
53

動手實作
● 在新的工作表:檔案 > 另存新檔 > 檔案類型 (csv) > 勾選編輯篩選設定後按下enter
54

動手實作
55

更多關於資料處理
1. 熟練試算表程式2. 使用程式語言來處理資料
a. Python, R都是不錯的候選 (豐富的庫)b. Web Crawler: http://axe.g0v.tw/level/
3. 統計學的解釋能力4. 資料庫管理系統 (RDBMS, Non-RDBMS)5. 從資料裡產生知識的思維
56
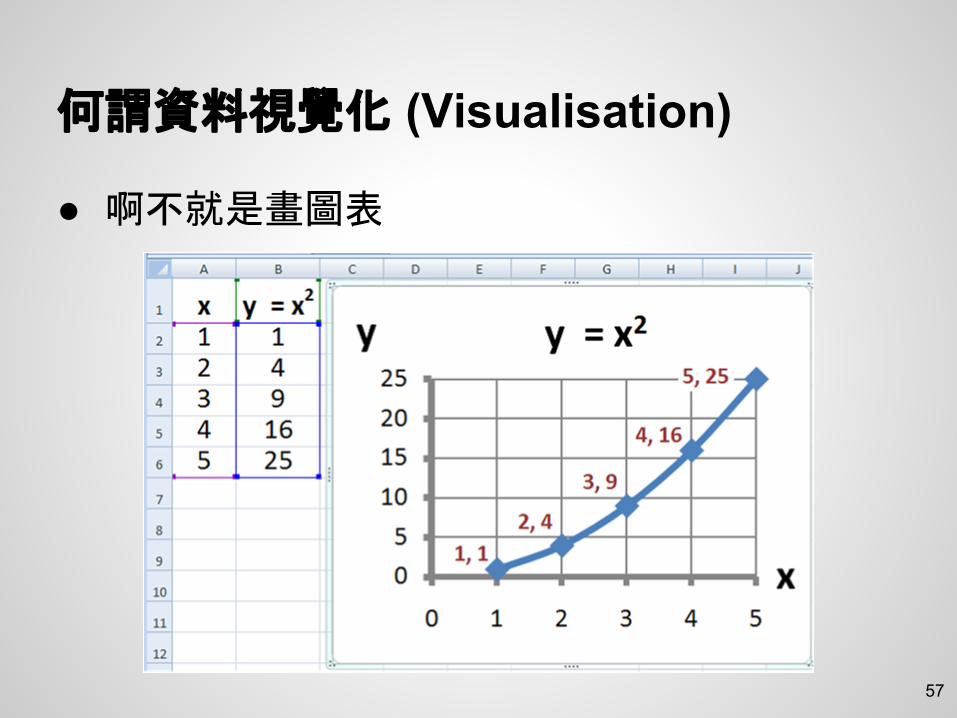
何謂資料視覺化 (Visualisation)
● 啊不就是畫圖表
57

南丁格爾 (1820 - 1910)她揪竟做了什麼,讓她留名青史呢?
科科史上的今天:南丁格爾 (http://history.pansci.tw/post/118735917271/5-12-florence-nightingale) 58

60
資料視覺化能:
● 與不懂統計的麻瓜溝通 (就像我一樣!)○ 但讀圖的能力也是需要訓練的

61
約翰·斯諾(1813 -1858)英國內科醫生,霍亂研究者

62

63
資料視覺化能:
● 與不懂統計的麻瓜溝通 (就像我一樣!)○ 但讀圖的能力也是需要訓練的
● 搜尋出可能潛在的模式● 資訊爆炸

資料視覺化: 水庫蓄水量
● http://data.infographics.tw/viz/reservoir/
64

資料視覺化
Dissecting a Trailer: The Parts of the Film That Make the Cut
65

67

Excel很棒啊 為什麼不用Excel?對呀,為什麼要寫Code?
68

SVG (Scalable Vector Graphics)
矩陣圖形:像素訊息,會失真
69lenna的故事:http://www.cs.cmu.edu/~chuck/lennapg/lenna.shtml
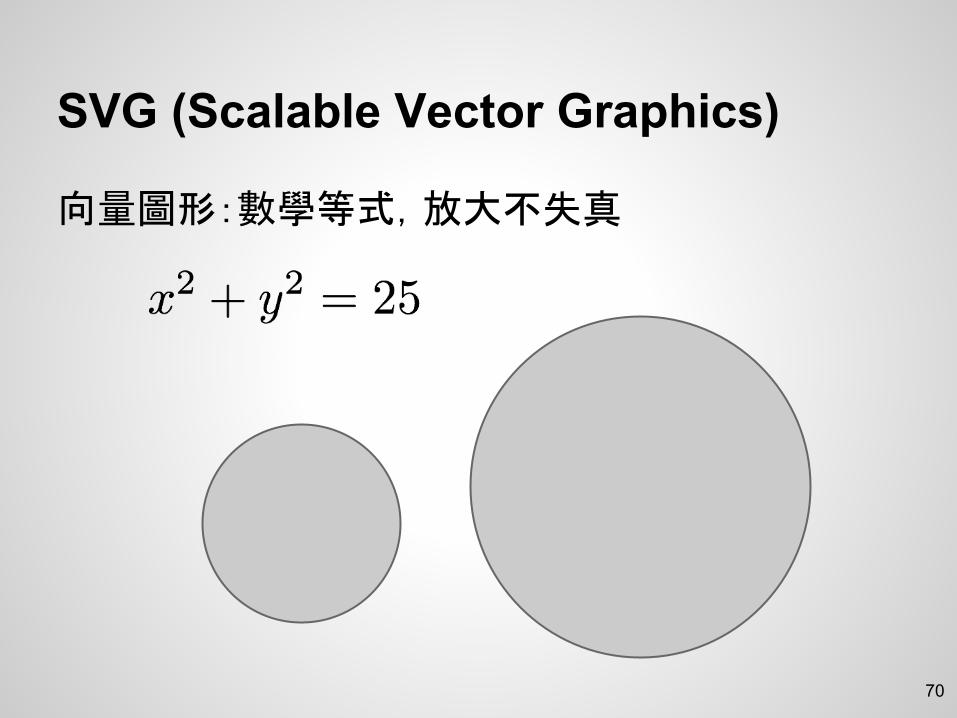
SVG (Scalable Vector Graphics)
向量圖形:數學等式,放大不失真
70

SVG (Scalable Vector Graphics)
● SVG是一種向量圖形的表示方式。● 所以SVG要算數學?
71

SVG (Scalable Vector Graphics)
● SVG以XML的形式呈現。● XML長得跟HTML很像:標籤 + 屬性● SVG範例時間
72
<svg width="100%" height="768"> <circle cx="100" cy="100" r="50" fill="#ccc" stroke="#000" /> <rect x="0" y="150" width="200" height="50" fill="blue" stroke="#000" /></svg>

SVG (Scalable Vector Graphics)
● 以<svg> tag宣告一個svg區塊,裡面可包含○ Rectangle <rect>○ Circle <circle>○ Ellipse <ellipse>○ Line <line>○ Polyline <polyline>○ Polygon <polygon>○ Path <path>○ Text <text> …….
● 這裏我們玩看看長方形跟圓形就好
73

SVG (Scalable Vector Graphics)
● <rect>○ x○ y○ fill○ width○ height○ stroke
● 給我一個藍色(blue)的, 長100, 寬50的長方形
74

SVG (Scalable Vector Graphics)
● <circle>○ cx (圓心)○ cy (圓心)○ r○ fill○ stroke
● 給我一個黑色的圓形,大小你決定
75

D3.js
D3?
76

D3.js
D3.js: 號稱資料視覺化的jQuery,是一個能有效操作SVG圖形的函式庫。
77

D3.js下載: http://d3js.org/
安裝: <script src="http://d3js.org/d3.v3.min.js" charset="utf-8"></script>
script標籤放哪兒比較好呢?
78

D3.js
● 產生頁面元素● 綁定資料
○ 胡搞瞎搞○ 畫圖○ 動畫○ 更新○ 互動
● 今天我們著重在畫圖上○ 互動性其實很棒,但今天得忍痛割愛.......
79

D3.js
● 條狀圖範例
80

D3.js: 產生頁面元素 & 綁定資料
● var data = [5, 10, 15, 20, 25];● var rects = d3.select('svg')
.selectAll('rect') .data(data) .enter() .append('rect');
81

D3.js: 畫圖
● var barHeight = 15, barUnit = 10;● rects.attr({
x: 0, y: function (d, i) { return i * (barHeight + 3); }, width: function (d) { return d * barUnit; }, height: barHeight, fill: function (d) { return color(d) } });
82

D3.js: 加上文字
d3.select('svg')
.selectAll('text')
.data(data)
.enter()
.append('text')
.attr({
x: 2,
y: function (d, i) { return i * (barHeight + 3) + 10; },
fill: '#111',
'font-size': '8pt'
})
.text(function (d) { return d; });
83

D3.js
以下泡泡圖教學是基於http://blog.infographics.tw/2015/05/d3js-tutorial-bubble-chart/
教育部103年度大專院校補助
84

D3.js: 讀取csv檔案
d3.csv(路徑, function (data) { // 回呼函數
});// 注意路徑其實是ajax call
85

D3.js: layout
● 算x軸, y軸 很頭痛???○ layout來拯救
○ 對資料做變換,讓資料能直接加上的與顯示有關的屬
性(如x, y軸等等)● 你存在我的回呼函數裡。
86

87
var data = { children: rawData };
var pack = d3.layout.pack();
pack = pack.padding(2)
.size([1024, 768])
.sort(function (a, b) {
return b.value - a.value;
}); // set the layout
var nodes = pack.nodes(data);
nodes = nodes.filter(function(it) { return it.parent; });
var color = d3.scale.category20(); // helper function to
pick color

88
Map, Filter
1
2
3
4
5
f(1) = 2
f(2) = 4
f(3) = 6
f(4) = 8
f(5) =10
f(x) = x*2
1
2
3
4
5
2
4
P(x): x mod 2 = 0

89
d3.select('svg')
.selectAll('circle') // select existing circles, or create a placeholder
.data(nodes) // parse the data
.enter() // bind the data
.append('circle') // create circle if placeholder exists
.attr({
cx: function (d) { return d.x; },
cy: function (d) { return d.y; },
r: function (d) { return d.r; }
fill: function (d) { return color(d.schoolName); },
stroke: '#444'
}).append('svg:title').text(function (d) {
return d.schoolName + '\n$' +
Number(d.value.toFixed(1)).toLocaleString(); // format the number
to currency
}); // using title attribute to simulate tooltip
注意x, y, r在資料轉變前還不存在
(如果有人欠揍,資料有key叫x, y or z怎辦?)

90
d3.select('svg') .selectAll('text') .data(nodes) .enter() .append('text') .attr({ x: function (d) { return d.x }, // here we set the text in the center of the circle y: function (d) { return d.y }, 'text-anchor': 'middle', 'font-size': '8pt' }).text(function (d) { if (d.value > 600000000) { return d.schoolName; } else { return ''; } }); // only show school name if the grant is larger than.

More…..
● Interactive Data Visualization for the Web● D3plus● MobileVis● 資料視覺化FB粉專
○ blog.infographics.tw● Muyueh● chart.js
91


![[朝陽科大] D3.js 資料視覺化入門](https://img.dokumen.tips/doc/110x75/586fda3a1a28ab18428b5c77/-d3js-.jpg)