Embed Size (px)
Citation preview

Unit 5 Research Project
Worthing College Sports Science
By Anna D’souza
2015
Assessment Criteria Pages 3-17 & 27-38
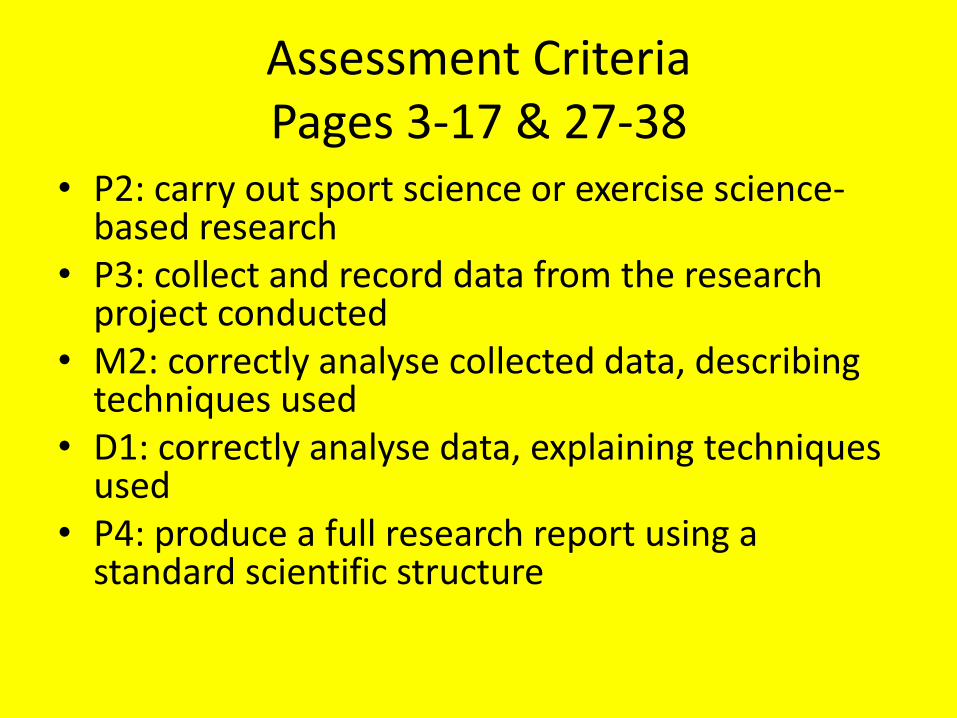
• P2: carry out sport science or exercise science-based research
• P3: collect and record data from the research project conducted
• M2: correctly analyse collected data, describing techniques used
• D1: correctly analyse data, explaining techniques used
• P4: produce a full research report using a standard scientific structure

To investigate how physical characteristics affects the
performance for elite standard climbing performers
P2: Carry out / P4: Produce

AbstractThis study is a contribution to the discussion on the structure, of elite standard rock climbers. The subjects included 16 indoor climbers. 5 variables were scrutinised for the participants, this included BMI a time trial sore on a specific climb, the participants current onsite grade and climbing experience of climbers involved in research . A sample of 15- 25 elite level climbing performers of any age, initially completed a PAR-Q in 10 minutes before testing began, after being read a set of standardized instructions. Height and weight tests are then performed of each participant and recorded alongside participantsPAR-Q’s, to calculate BMI . A timed climb is then carried out on an unseen 6a climb for all 16 participants, which is recorded on a digital stopwatch alongside an observation showing that they are elite performers and recorded on a tick list. An observation of climbers completed another unseen limb at a 6b level with a big rockover, so that it can be compared to other participantsand ensure the participants are of elite level and performing difficult moves. The participants then complete a second questionnaire which enables to show the participants climbing experience in years and months along with there current onsite grade. This data is compared against one another to produce 6 different results. Results relate to first hypotheses, show that no matter if the participants BMI is high then there grade is not low. There is a weak relationship between the two variables. These results indicate that there is no relationship between having a high BMI, and current onsite grade being low. The reason for theparticipants climbing grade is down to there experience and practice in the sport/specific climbs. Results formed in second hypothesis , showed that the higher the climbers experience the lower there time trial score (panel 7 yellow 6a). There is a strong relationship between climbers experience and being able to ascend up a wall quickly. This is due to the climbers knowledge of the sport, in knowing there own strengths and having an understanding of this climbing centre and its grading system. Through further research into how this result relates to other walls and their grading system, it would give strongerevidence into why there is a relationship between the two variables. Results formed through exploring hypothesis, showed thatthere is no correlation between having a low time trial score, and having a BMI being healthy. The scatter graph showed a negative correlation of the two variables. These results show that having a low time trail score is affected by something other then BMI, it is most likely due to being an elite performer and knowledge of the sport, how you should position yourself on the wall. Further research would look into why BMI has no effect on time trial score, of participants and specifically their weekly diet. Results produced through exploring hypothesis four showed that there is a negative trend between low BMI and current onsite grade. The results disprove my hypothesis and show a weak correlation between variables. Therefore it shows that even having a high BMI will not affect there onsite grade, over there whole climbing experience at elite standard of performance. Further research that could look into the effect of BMI on current onsite grade, and what it does specifically looking at foundation level performance, compared to elite standard climbers. Results formed in fifth hypothesis showed that if the climbers have high climbing experience (in years and months), then the current onsite grade will match this. There is a strong correlation between these two variables. If a climber has been climbing for a long time, or gained allot of training then this will be reflected in the grade they are able to climb at. Further research would look into how the climbers performance can be simulated, at other walls. See if there is any difference in ability. It would also look further, into why some of my participants have reached such a high ability with only little experience. Results formed through exploring hypothesis six showed tat there is a moderate correlation, between if climbers onsite grade is high then time trial score will be low. Through looking at the scatter graph between onsite grade and time trial score, it shows a positive trend between the two factors. There is only a moderate relationship, due to how some participants have the same onsite grade but differ in time trial score. Therefore further researchwould look at how climbers have the same onsite grade, but don’t have the same time trial score. Is this due to experience,the wall they are climbing or the age of the climbing?
P2: Carry out / P4: Produce

Contents: GeneralPage 3: AimPage 4: Abstract Page 5: Contents: General Page 6: Contents: Appendices Page 7: Contents: Figures and tables Page 8: Acknowledgements Page 9: Introduction Page 10: Literature review and References Page 11: Project hypothesis Page 12: Method Page 13: Data collection Page 14: Data Analysis Page 15-16: Results Page 17: DiscussionPage 18-19: Conclusion Page 20: Assessment criteria Page 21: Review 1/3Page 22: Review 2/3Page 23: Review 3/3Page 24: Future recommendations 1/5Page 25: Future recommendations 2/5Page 26: Future recommendations 3/5Page 27: Future recommendations 4/5Page 28: Future recommendations 5/5Page 29- 42: Appendices Page 43-56:Figures and tables
P2: Carry out / P4: Produce

Contents: AppendicesObjective 1-Page 30- Appendix 1: standardised instructions Page 31 - Appendix 2:PAR-Q template Page 32- Appendix 3: Participants PAR-Q’s who did not continue to be involved in research, due to injury and the right to withdraw. Page 33-35 -Appendix 4 PAR-Q’s of participants involved in researchPage 36- Appendix 5: standardised instructions for time trial Page 37- Appendix 6: Time trial score of participants A-P doing panel 7 yellow 6a Page 38- Appendix 7: Tick list to show that the participants are elite climbers, done after completing the timed panel 7 6a climb Page 39- Appendix 8: Videos of participants A-P doing panel 15 green 6b. Analysing there performance on this harder climb and comparing it to all participants involved in research.Page 40-Appendix 9: Climbing wall tick list of the entire wall at the AOAC, ShorehamObjective 2-Page 41- Appendix 10: Evidence of equipment used in research Objective 3-Page 42- Appendix 11: Questionnaire looking at climbing ability and experience of each participants
P2: Carry out / P4: Produce
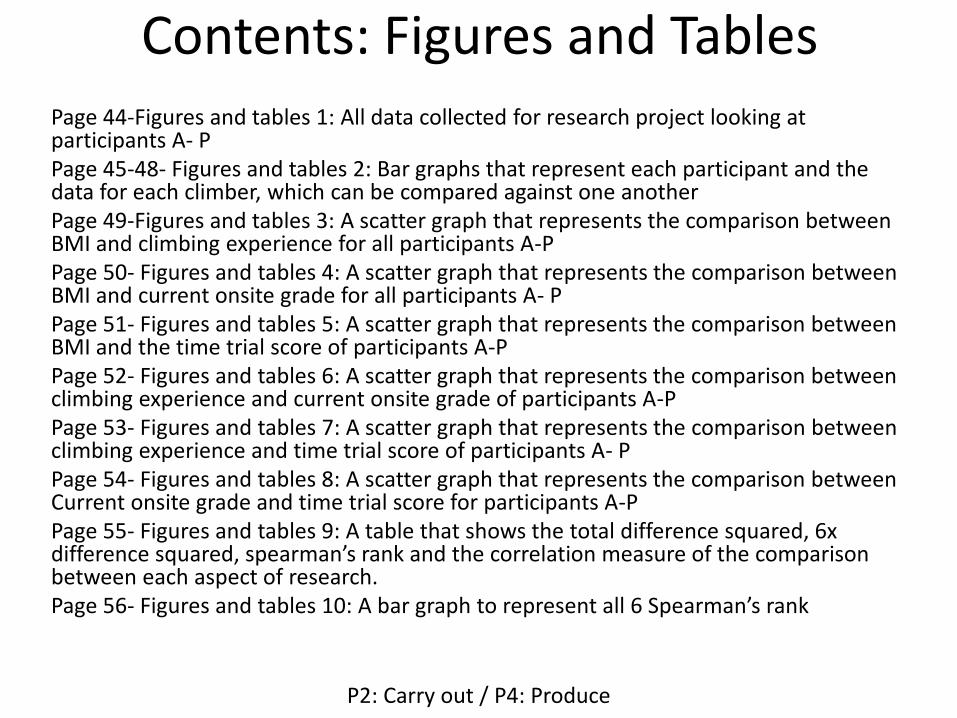
Contents: Figures and TablesPage 44-Figures and tables 1: All data collected for research project looking at participants A- P Page 45-48- Figures and tables 2: Bar graphs that represent each participant and the data for each climber, which can be compared against one another Page 49-Figures and tables 3: A scatter graph that represents the comparison between BMI and climbing experience for all participants A-P Page 50- Figures and tables 4: A scatter graph that represents the comparison between BMI and current onsite grade for all participants A- PPage 51- Figures and tables 5: A scatter graph that represents the comparison between BMI and the time trial score of participants A-P Page 52- Figures and tables 6: A scatter graph that represents the comparison between climbing experience and current onsite grade of participants A-PPage 53- Figures and tables 7: A scatter graph that represents the comparison between climbing experience and time trial score of participants A- P Page 54- Figures and tables 8: A scatter graph that represents the comparison between Current onsite grade and time trial score for participants A-P Page 55- Figures and tables 9: A table that shows the total difference squared, 6x difference squared, spearman’s rank and the correlation measure of the comparison between each aspect of research. Page 56- Figures and tables 10: A bar graph to represent all 6 Spearman’s rank
P2: Carry out / P4: Produce

Acknowledgements
I would like to thank all who agreed to be involved in my research and performed my basic tests, so that I could collect data for my research. All who attend the climbing community at the AOAC on a Wednesday evening between 7-10pm. I would also like to thank participant J, who helped me to perform the height and weight tests on the climbing subjects. Without the commitment of my participants I would not have been able to complete my research based on my aim: to investigate how BMI affects the performance for elite standard climbing performers.
P2: Carry out / P4: Produce

Introduction:
For my research project I have decided to look at indoor rock climbing, in particular I wanted to look at a climber and compare there physical characteristics to how well they are able to climb if there is a relationship between these two variables. The aim of my project is “By the end of my research project, I aim to understand how physical characteristics affects the performance of a 6a climber and above”. I chose this aim, due to being a climber myself and looking at my own performance, and being part of an elite climbing group I wanted to broaden my knowledge to understanding why other climbers become elite performers. I was then able to break down my thinking when looking at how climbers climb, from understanding that being a good climber is affected by there knowledge and understanding along with there size. There size was either a trait to their ability, or what comes with the territory of being an elite performer. Through this thought process I come up with the aim for my project. The timescale for my research is the initial planning started on the 14th of February to the 20th , then the research started on the 21st of February and finished by the 11th of march. The write up and data collection will then be finished by the 27th of march, and uploaded onto wordpress.
P2: Carry out / P4: Produce

Literature Review and References
https://worthingsportscience.wordpress.com/2015/03/27/unit-5-sports-science-research-project-anna-dsouza/
P2: Carry out / P4: Produce

Project Hypothesis
P2: Carry out / P4: Produce
• I predict that the higher the BMI, the lower the current onsite grade will be
• The higher the climbers experience of climbing, the lower the time trial score will be on panel 7 yellow 6a.
• If the participants time trial score is low then there BMI will be healthy
• There will be a positive trend between low BMI and current onsite grade
• If the climbing experience is high then current onsite grade will match this.
• If the climbers onsite grade is high then there time trial score will be low.

MethodI will distribute 25 PAR-Q’s of opportunity for my research; from these initial 20 the results of there PAR-Q’s will determine if they will continue to be involved I the research or not. This is determined on if they give any ‘yes’ answers to any of the health questions and there explanation/doctors consent of the issue. If the answers interfere with the research and health of participants, then this person will not carry on with testing. Firstly I will read out the standardised instructions (see appendix 1) to all participants and show the testing areas/climbs they will be doing. I will then distribute the PAR-Q questionnaires (see appendix 2) found on Tuesday the 7th – 9th of October at https://worthingsportscience.wordpress.com/category/unit-11-lessons/page/2/ . I give the participants 20 minutes to complete questionnaire before collecting and identifying who will continue research from answers and who will not. (see appendix 3 and 4)I then distribute the second questionnaire (see appendix 10) on participants current grade of climbing and climbing experience, with the same standardised instructions (see appendix 1). I give the participants 5 minutes to complete questionnaires and collect in. This provides me with qualitative data that I will enter into excel by the 12th of march. I then ask participants to complete the 6a climb on panel 7 in the quickest possible time and read the set of standardized instructions to each participant (see appendix 5). This test of all participants will be completed by Wednesday 11th march .After this I then ask participants to complete the participants to complete the green 6b climb which is a harder climb at an elite level of performance, this will be videoed and each participant will be compared to one another to prove they are elite standard performers (see appendix 8). This will be completed by the 11th of march After these climbs are completed by the climbers, I then ask them to complete further height and weight tests (see appendix 10), with the help of participant J to conduct height test using a tape measure then weigh climbers in kg. this data for each participant was written down and further entered into a BMI calculator http://www.nhs.uk/tools/pages/healthyweightcalculator.aspx.All participants personal info received will remain confidential. I will ensure that any personal data will be replaced with a letter to represent participant and covered. My research is field based and all participants were tested in their sporting environment. Through conducting a field based research project this will gain me primary data that has higher validity as I am aware of how the testing is conducted and the weakness and strengths of my research first hand.
P3: Collect and record / M2: Correctly analyse & describe techniques / D1: Correctly analyse & explain techniques

Data Collection
My data collection is of primary data, as I have collected and researched the climbers myself. Collecting two types of data –quantative and qualitative but through collecting qualitative data I will produce quantative data this reacts to the hypothesis I formulated at the beginning of the research, on what I predict to find. The quantative data obtained is the age (years) of participants, heights (cm) and weights (kg)(BMI) and if they can climb a 6a climb or not. The quantative data is collected to compare to the climbers performance (onsite grade) with knowledge of the sport. The qualitative data collected through handing out a questionnaire 10 participants A-P in which there are 4 closed questions that the participants answer alongside their PAR-Q. this is conducted to show a correlation between their climbing experience, current onsite grade and the climbers BMI if BMI has an high impact on their performance as climbers.
P3: Collect and record / M2: Correctly analyse & describe techniques / D1: Correctly analyse & explain techniques

Data AnalysisTo analyse the data I have collected through conducting my research, I will input what I have found on each participant into excel, this makes it easier for me to produce tables and graphs to show correlations. The data I have collected will produce bar graphs on each participant that shows there specific data and can be easily compared against one another to show any similarities and differences. I have then conducted scatter graphs to show correlation through all the results and a spearman's rank table, which show how strong the correlation is between two variables- very weak, weak, moderate, strong or very strong. I will produce 6 spearman's rank results from the data, on every aspect of the athlete each compared against one another. This is BMI and climbing experience, BMI and climbing onsite grade, BMI and time trial score, experience and climbing onsite grade, experience and time trial score and onsite grade and time trial score.
P3: Collect and record / M2: Correctly analyse & describe techniques / D1: Correctly analyse & explain techniques

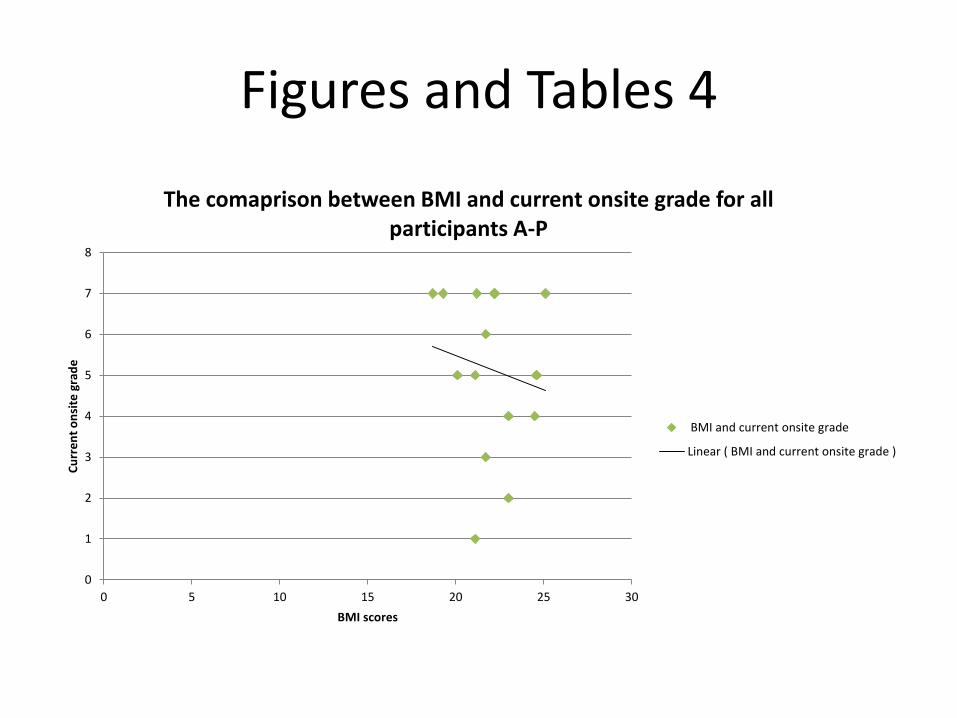
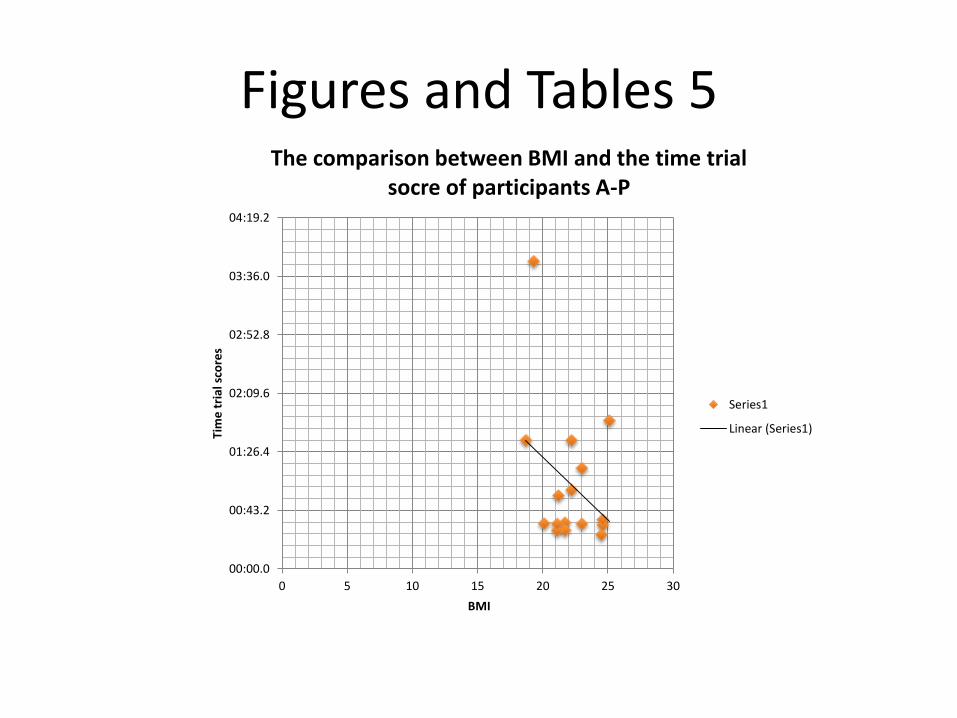
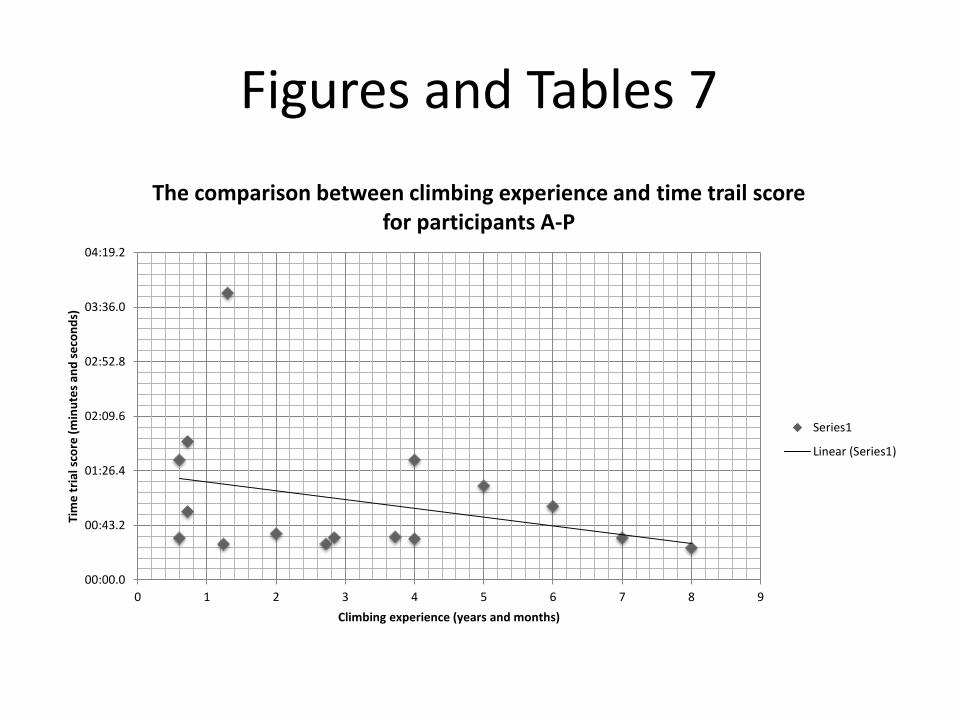
Results- When looking at my hypothesis: I predict the higher the BMI the lower the current onsite grade will be. The results show (see figures and tables 4) that there is a weak 0.25 correlation between these two variables evidence using spearman's rank order ( see figures and tables 9). This shows that this hypothesis was inaccurate and had a negative relationship. As evidence looking at participant J (see figures and tables 1), who had the lowest BMI over all participants at a score of 18.7. In conclusion with this has a low onsite grade that proves my hypothesis wrong. - I also found when looking at the hypothesis, the higher the climbers experience of climbing, the lower the time trial score will be on panel 7 yellow 6a. The results shown (see figures and tables 7) that there is a strong correlation between the two variables of 0.71, using spearman's rank order correlation (see appendix 9). This shows that there is a strong positive relationship subject D, who has the highest level of experience at 8 years. In conclusion with this, got the best time trial score at 0:25.36 seconds, which is the best over all participants. This proves that my original hypothesis was correct. Although within this data there is a clear anomaly with participant H. Who has a rank score of 11 over all participants with some level of climbing experience, would not result in the highest time trial score this doesn't fit in with the original hypothesis. - When looking at the hypothesis, if the participants time trial score is low then there BMI will be healthy. My results show that if you have a healthy BMI, then generally the time trial score is between 0.25 and 0.43 (shown in figures and tables 5). I found a 00.4 correlation between the two variables, using spearman's rank correlation (shown in figures and tables 9). This shows a very weak relationship between BMI and time trial score. Participant C had the highest BMI and one of the highest time trial scores, this supports my original hypothesis. On the other hand participant H, had one of the lowest BMI scores but one of the highest time trial scores. This proves that there is a very weak correlation between the two variables. So the initial hypothesis is incorrect.
P3: Collect and record / M2: Correctly analyse & describe techniques / D1: Correctly analyse & explain techniques
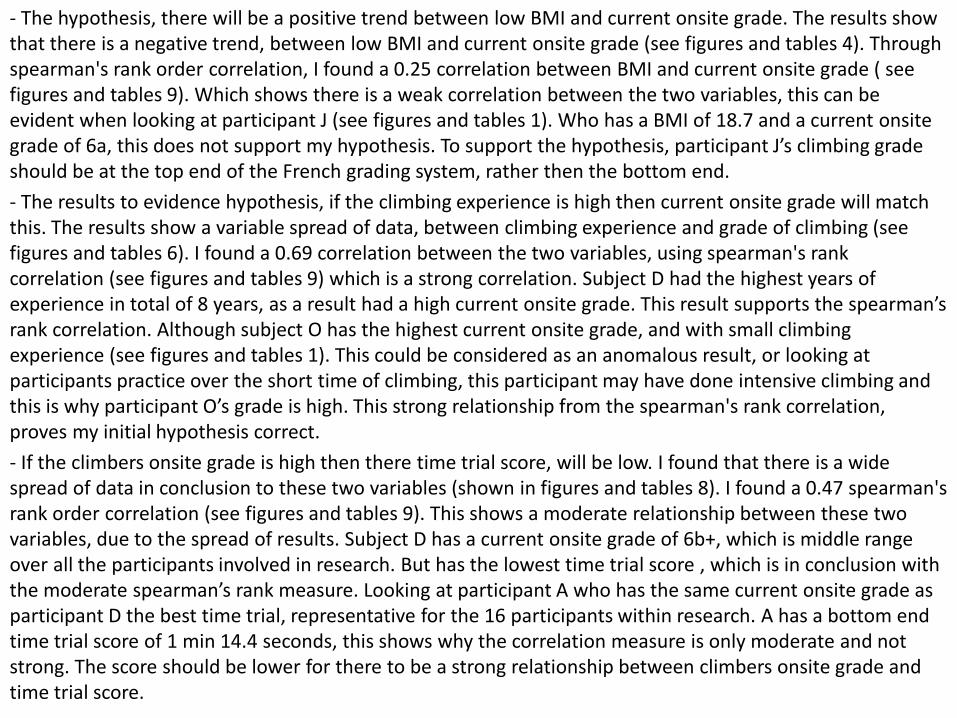
- The hypothesis, there will be a positive trend between low BMI and current onsite grade. The results show that there is a negative trend, between low BMI and current onsite grade (see figures and tables 4). Through spearman's rank order correlation, I found a 0.25 correlation between BMI and current onsite grade ( see figures and tables 9). Which shows there is a weak correlation between the two variables, this can be evident when looking at participant J (see figures and tables 1). Who has a BMI of 18.7 and a current onsite grade of 6a, this does not support my hypothesis. To support the hypothesis, participant J’s climbing grade should be at the top end of the French grading system, rather then the bottom end.
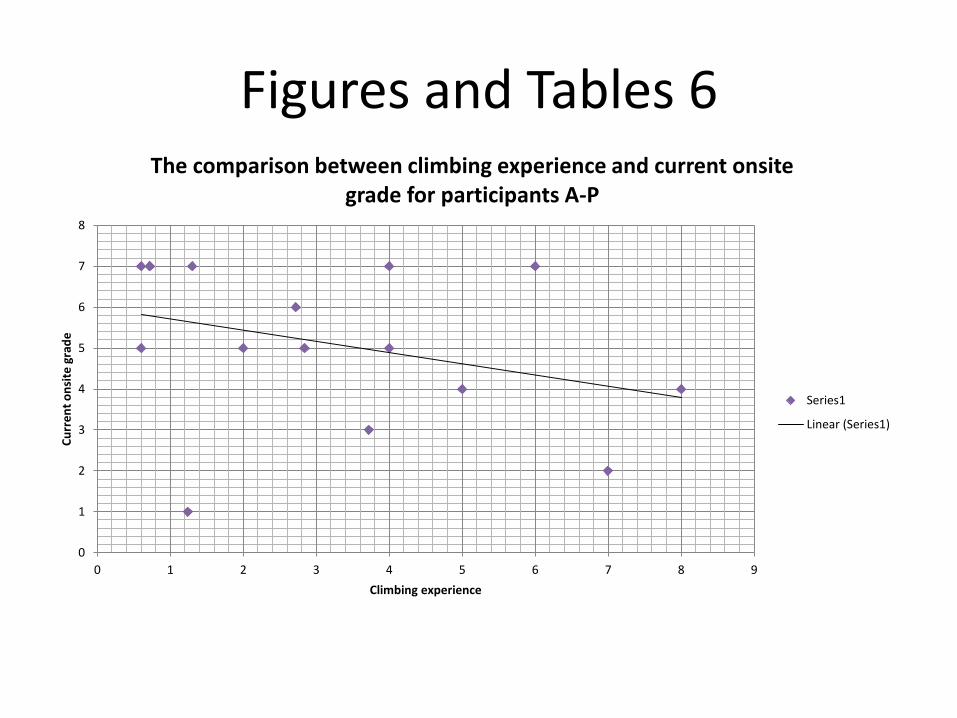
- The results to evidence hypothesis, if the climbing experience is high then current onsite grade will match this. The results show a variable spread of data, between climbing experience and grade of climbing (see figures and tables 6). I found a 0.69 correlation between the two variables, using spearman's rank correlation (see figures and tables 9) which is a strong correlation. Subject D had the highest years of experience in total of 8 years, as a result had a high current onsite grade. This result supports the spearman’s rank correlation. Although subject O has the highest current onsite grade, and with small climbing experience (see figures and tables 1). This could be considered as an anomalous result, or looking at participants practice over the short time of climbing, this participant may have done intensive climbing and this is why participant O’s grade is high. This strong relationship from the spearman's rank correlation, proves my initial hypothesis correct.
- If the climbers onsite grade is high then there time trial score, will be low. I found that there is a wide spread of data in conclusion to these two variables (shown in figures and tables 8). I found a 0.47 spearman's rank order correlation (see figures and tables 9). This shows a moderate relationship between these two variables, due to the spread of results. Subject D has a current onsite grade of 6b+, which is middle range over all the participants involved in research. But has the lowest time trial score , which is in conclusion with the moderate spearman’s rank measure. Looking at participant A who has the same current onsite grade as participant D the best time trial, representative for the 16 participants within research. A has a bottom end time trial score of 1 min 14.4 seconds, this shows why the correlation measure is only moderate and not strong. The score should be lower for there to be a strong relationship between climbers onsite grade and time trial score.
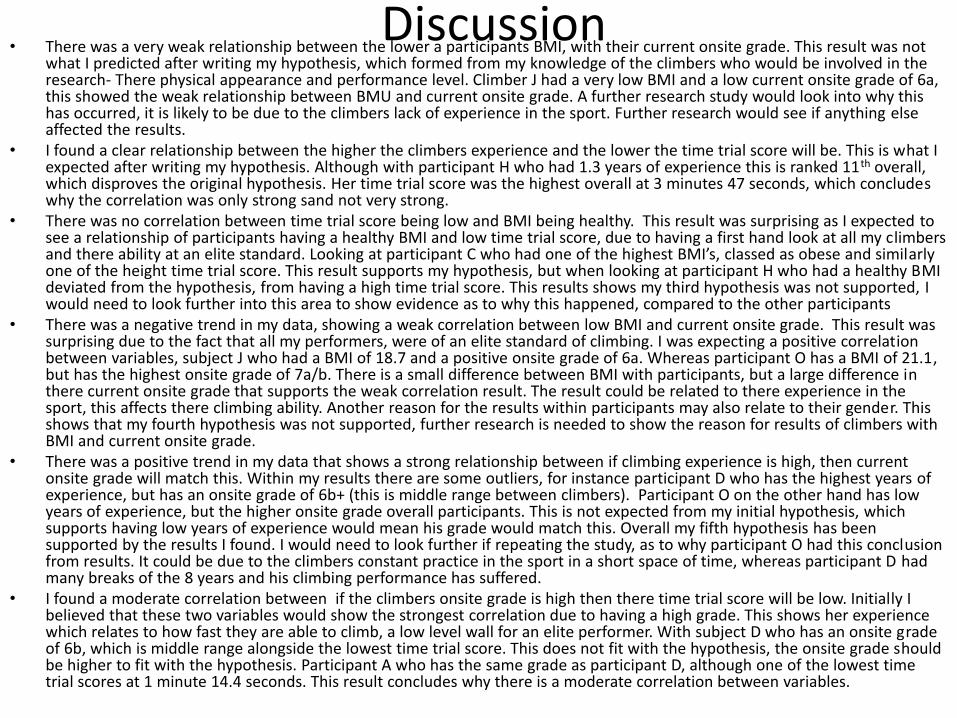
• There was a very weak relationship between the lower a participants BMI, with their current onsite grade. This result was notwhat I predicted after writing my hypothesis, which formed from my knowledge of the climbers who would be involved in the research- There physical appearance and performance level. Climber J had a very low BMI and a low current onsite grade of 6a, this showed the weak relationship between BMU and current onsite grade. A further research study would look into why this has occurred, it is likely to be due to the climbers lack of experience in the sport. Further research would see if anything else affected the results.
• I found a clear relationship between the higher the climbers experience and the lower the time trial score will be. This is what I expected after writing my hypothesis. Although with participant H who had 1.3 years of experience this is ranked 11th overall, which disproves the original hypothesis. Her time trial score was the highest overall at 3 minutes 47 seconds, which concludes why the correlation was only strong sand not very strong.
• There was no correlation between time trial score being low and BMI being healthy. This result was surprising as I expected to see a relationship of participants having a healthy BMI and low time trial score, due to having a first hand look at all my climbers and there ability at an elite standard. Looking at participant C who had one of the highest BMI’s, classed as obese and similarly one of the height time trial score. This result supports my hypothesis, but when looking at participant H who had a healthy BMI deviated from the hypothesis, from having a high time trial score. This results shows my third hypothesis was not supported, I would need to look further into this area to show evidence as to why this happened, compared to the other participants
• There was a negative trend in my data, showing a weak correlation between low BMI and current onsite grade. This result was surprising due to the fact that all my performers, were of an elite standard of climbing. I was expecting a positive correlationbetween variables, subject J who had a BMI of 18.7 and a positive onsite grade of 6a. Whereas participant O has a BMI of 21.1, but has the highest onsite grade of 7a/b. There is a small difference between BMI with participants, but a large difference in there current onsite grade that supports the weak correlation result. The result could be related to there experience in the sport, this affects there climbing ability. Another reason for the results within participants may also relate to their gender. This shows that my fourth hypothesis was not supported, further research is needed to show the reason for results of climbers withBMI and current onsite grade.
• There was a positive trend in my data that shows a strong relationship between if climbing experience is high, then current onsite grade will match this. Within my results there are some outliers, for instance participant D who has the highest years ofexperience, but has an onsite grade of 6b+ (this is middle range between climbers). Participant O on the other hand has low years of experience, but the higher onsite grade overall participants. This is not expected from my initial hypothesis, whichsupports having low years of experience would mean his grade would match this. Overall my fifth hypothesis has been supported by the results I found. I would need to look further if repeating the study, as to why participant O had this conclusion from results. It could be due to the climbers constant practice in the sport in a short space of time, whereas participant D hadmany breaks of the 8 years and his climbing performance has suffered.
• I found a moderate correlation between if the climbers onsite grade is high then there time trial score will be low. Initially I believed that these two variables would show the strongest correlation due to having a high grade. This shows her experience which relates to how fast they are able to climb, a low level wall for an elite performer. With subject D who has an onsite grade of 6b, which is middle range alongside the lowest time trial score. This does not fit with the hypothesis, the onsite grade should be higher to fit with the hypothesis. Participant A who has the same grade as participant D, although one of the lowest time trial scores at 1 minute 14.4 seconds. This result concludes why there is a moderate correlation between variables.
Discussion
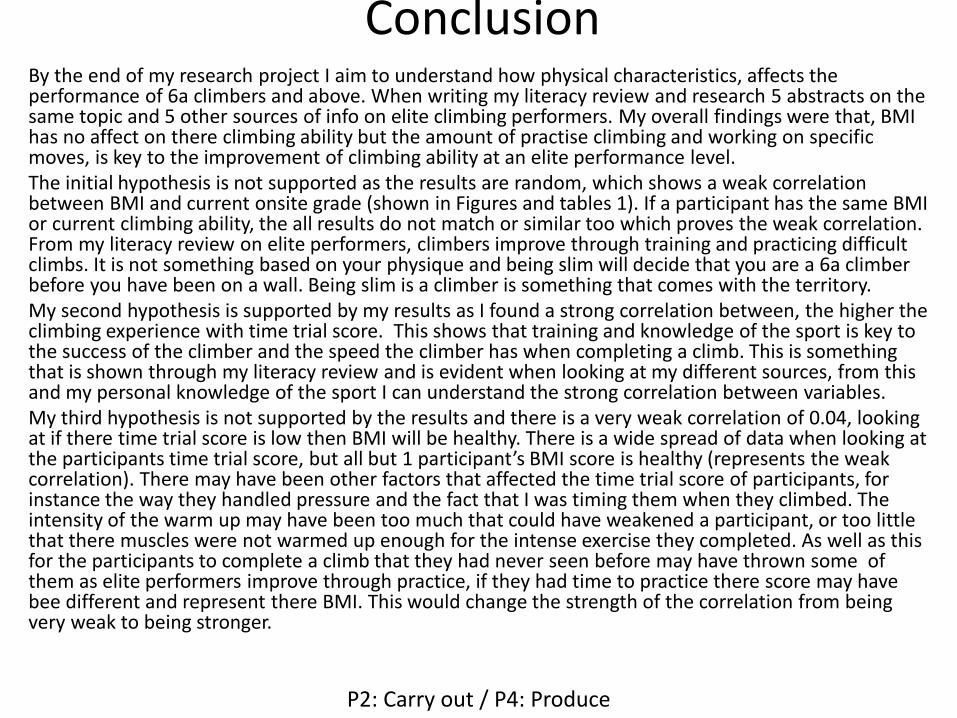
ConclusionBy the end of my research project I aim to understand how physical characteristics, affects the performance of 6a climbers and above. When writing my literacy review and research 5 abstracts on the same topic and 5 other sources of info on elite climbing performers. My overall findings were that, BMI has no affect on there climbing ability but the amount of practise climbing and working on specific moves, is key to the improvement of climbing ability at an elite performance level. The initial hypothesis is not supported as the results are random, which shows a weak correlation between BMI and current onsite grade (shown in Figures and tables 1). If a participant has the same BMI or current climbing ability, the all results do not match or similar too which proves the weak correlation. From my literacy review on elite performers, climbers improve through training and practicing difficult climbs. It is not something based on your physique and being slim will decide that you are a 6a climber before you have been on a wall. Being slim is a climber is something that comes with the territory. My second hypothesis is supported by my results as I found a strong correlation between, the higher the climbing experience with time trial score. This shows that training and knowledge of the sport is key to the success of the climber and the speed the climber has when completing a climb. This is something that is shown through my literacy review and is evident when looking at my different sources, from this and my personal knowledge of the sport I can understand the strong correlation between variables. My third hypothesis is not supported by the results and there is a very weak correlation of 0.04, looking at if there time trial score is low then BMI will be healthy. There is a wide spread of data when looking at the participants time trial score, but all but 1 participant’s BMI score is healthy (represents the weak correlation). There may have been other factors that affected the time trial score of participants, for instance the way they handled pressure and the fact that I was timing them when they climbed. The intensity of the warm up may have been too much that could have weakened a participant, or too little that there muscles were not warmed up enough for the intense exercise they completed. As well as this for the participants to complete a climb that they had never seen before may have thrown some of them as elite performers improve through practice, if they had time to practice there score may have bee different and represent there BMI. This would change the strength of the correlation from being very weak to being stronger.
P2: Carry out / P4: Produce
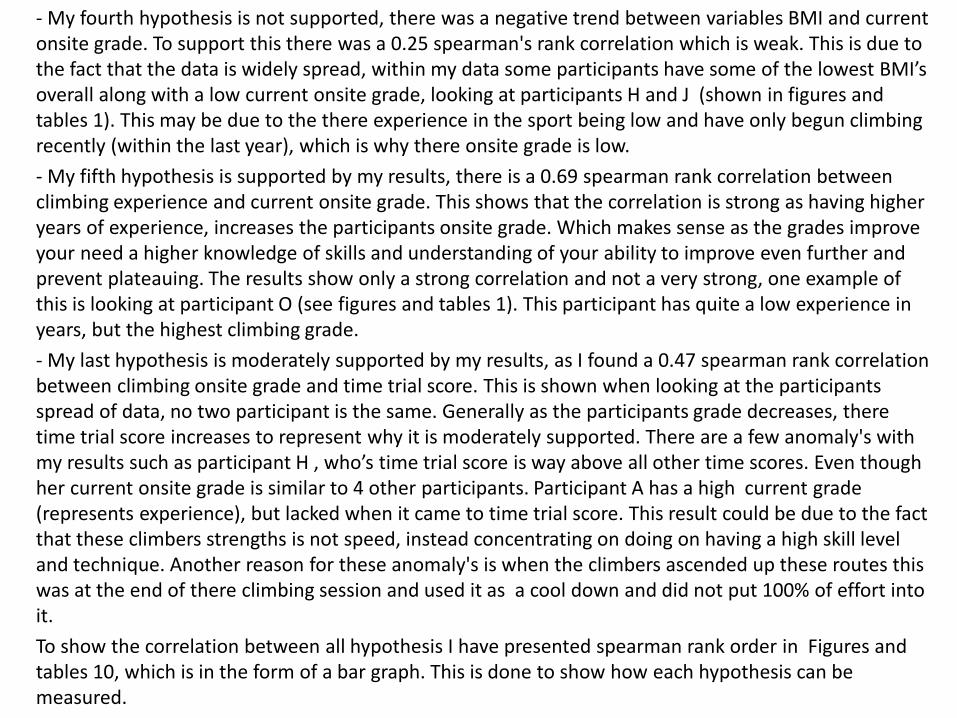
- My fourth hypothesis is not supported, there was a negative trend between variables BMI and current onsite grade. To support this there was a 0.25 spearman's rank correlation which is weak. This is due to the fact that the data is widely spread, within my data some participants have some of the lowest BMI’s overall along with a low current onsite grade, looking at participants H and J (shown in figures and tables 1). This may be due to the there experience in the sport being low and have only begun climbing recently (within the last year), which is why there onsite grade is low.
- My fifth hypothesis is supported by my results, there is a 0.69 spearman rank correlation between climbing experience and current onsite grade. This shows that the correlation is strong as having higher years of experience, increases the participants onsite grade. Which makes sense as the grades improve your need a higher knowledge of skills and understanding of your ability to improve even further and prevent plateauing. The results show only a strong correlation and not a very strong, one example of this is looking at participant O (see figures and tables 1). This participant has quite a low experience in years, but the highest climbing grade.
- My last hypothesis is moderately supported by my results, as I found a 0.47 spearman rank correlation between climbing onsite grade and time trial score. This is shown when looking at the participants spread of data, no two participant is the same. Generally as the participants grade decreases, there time trial score increases to represent why it is moderately supported. There are a few anomaly's with my results such as participant H , who’s time trial score is way above all other time scores. Even though her current onsite grade is similar to 4 other participants. Participant A has a high current grade (represents experience), but lacked when it came to time trial score. This result could be due to the fact that these climbers strengths is not speed, instead concentrating on doing on having a high skill level and technique. Another reason for these anomaly's is when the climbers ascended up these routes this was at the end of there climbing session and used it as a cool down and did not put 100% of effort into it.
To show the correlation between all hypothesis I have presented spearman rank order in Figures and tables 10, which is in the form of a bar graph. This is done to show how each hypothesis can be measured.

Assessment Criteria Pages 19-26
• P5: carry out a review of the research project conducted, describing strengths, areas for improvement and future recommendations.
• M3: carry out a review of the research project, explaining strengths, areas for improvement and future recommendations.
• D2: carry out a review of the research project, justifying future recommendations for further research.
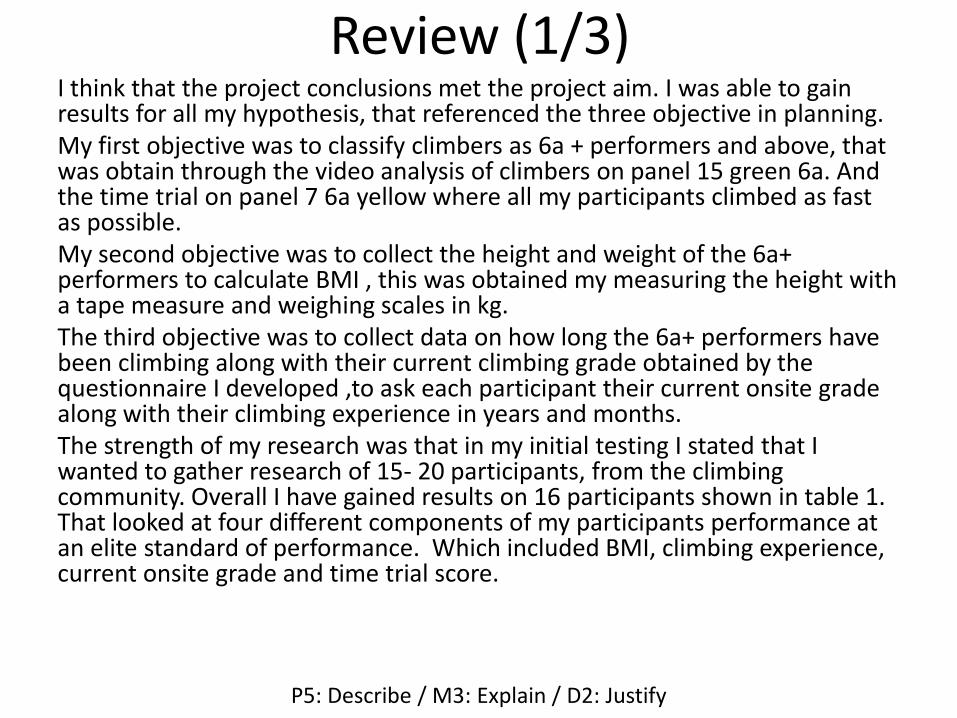
Review (1/3)I think that the project conclusions met the project aim. I was able to gain results for all my hypothesis, that referenced the three objective in planning. My first objective was to classify climbers as 6a + performers and above, that was obtain through the video analysis of climbers on panel 15 green 6a. And the time trial on panel 7 6a yellow where all my participants climbed as fast as possible. My second objective was to collect the height and weight of the 6a+ performers to calculate BMI , this was obtained my measuring the height with a tape measure and weighing scales in kg. The third objective was to collect data on how long the 6a+ performers have been climbing along with their current climbing grade obtained by the questionnaire I developed ,to ask each participant their current onsite grade along with their climbing experience in years and months. The strength of my research was that in my initial testing I stated that I wanted to gather research of 15- 20 participants, from the climbing community. Overall I have gained results on 16 participants shown in table 1. That looked at four different components of my participants performance at an elite standard of performance. Which included BMI, climbing experience, current onsite grade and time trial score.
P5: Describe / M3: Explain / D2: Justify
Review (2/3)The strengths of my research project were that I made sure all tests where completed in the same way. For example when doing the time trials, each participant had one leg on the hold before starting and I counted down from three before go when I would start the timer and as soon as there hand touched the top of the wall I stopped the timer. To ensure that this was accurate I gave my participants a set of standardised instructions before starting the test.
Another strength of my research was that when conducting the height and weight tests each participant was conducted in the same place, using the same method for testing and the exact same instruments to take data.
I think that the whole research is valid and reliable and meets the data protection guidelines stated in the project planning template. It is valid because I was able to measure and collect data on what I set out to measure, from objective 1- 3 in project planning template. The same standardised instructions were used when gaining results on part I have done this for participants A-P. I have met data protection guidelines as I have covered any personal info, replaced with the letter they represent in my research from A- P.
P5: Describe / M3: Explain / D2: Justify

Review (3/3)
One area of improvement for this investigation, would be when looking at the videos of performers see if there is a specific number of steps it takes for my participant to reach the top and if this is based on climbing experience or BMI and how does this correlate to the other participants. This would allow my research to be further extended as I would have more results. I would see the participants repeat this climb over a series of weak to ensure that there climbing was not changed under pressure (when filming) or there ability is down to there experience and knowledge of the sport and the way this related to other participants. Before the participants climb the two panels for testing each member warmed up, if repeating the investigation I would ensure that I monitor the warm up more accurately so that they each have the same length of time, stretching out the same types of muscles on the climbs that they are warming up on. This would improve the reliability of the research in the future. I would also use a speedometer that accurately measures time when climbing and the exact point climbers reached the top of the wall to ensure that observer validity has not compromised the results.
P5: Describe / M3: Explain / D2: Justify

Future Recommendations (1/5)
If I was repeat this investigation again, I would increase the number of participants that I researched. This number of participants would be representative of the climbing population in the Uk. This would make my conclusion, have higher validity, as I could use the results as normative data for further research.
P4: Produce / P5: Describe / M3: Explain / D2: Justify

Future Recommendations (2/5)
P4: Produce / P5: Describe / M3: Explain / D2: Justify
• If I was to repeat this investigation, I would look at climbers who are leaders, TR and outdoor climbers so that the results have a higher internal validity. Due to the fact that as a climber you experience the sport as a whole to improve your performance, which is particularly relevant to those who have been climbing for a long time.

Future Recommendations (3/5)
P4: Produce / P5: Describe / M3: Explain / D2: Justify
• If I was to repeat my research, I would see how my results relate to other climbing walls looking at the performance of elite standard climbers. I would do this due to the fact that the French grading system is subjective, there is no clear guide as to how a climb should be graded. So other walls may have variable levels of difficulty for routes, I would use this to reflect how my participants results fit in with other walls, or if they were subjective to the wall of testing.
Future Recommendations (4/5)
If I was to repeat this investigation again when using a wall, I would ensure that my results can be accurately converted to any climbing wall, by gathering results for all grading systems used so that my results are not subjective to one region but coincide with all walls. This gives my results higher validity as they can be used on a larger scale.
P4: Produce / P5: Describe / M3: Explain / D2: Justify

Future Recommendations (5/5)
P4: Produce / P5: Describe / M3: Explain / D2: Justify
• Increase the time frame that the research is completed in. Due to the nature of the participants, some of them did not come every weak. This made it difficult to process my findings together and had to rely on others to come each week for testing, and not until I had collected all data on each participant could I gather and process my findings. Through collecting my results sooner, I would be able to complete findings sooner and notice any anomalies and find reasons for these anomalies. Through collecting the initial sample, I then broke this down to only 16 participants. Having more time would enable me to find more participants, to be in my research. Doing this would result in me having a more representative answer on elite climbers.

Research Project Appendices

Appendix 1
Standardised instructions: • Have started to a research project to identify how BMI affects the
performance of elite standard climbers. This will be done through collecting through the initial distribution of 25 PAR-Q’s that show if you can be involved in research through the answers you give to the questionnaire completed in 10 minutes. This looks at your health and how fit you are, to ensure that my research will not put a strain on your health. Secondly I will then collect the height and weight of each participant. Thirdly I will distribute a second questionnaire that identified your specific climbing experience and current onsite grade.
• I will then carry our further testing by timing you on panel 7 yellow 6b, in comparison with other athletes. Along with a tick list tom show you are a 6a climber that is ticked after completion of the timed climb. I will then video you climbing the green 6b on panel 15, which will be analysed against your fellow participants.

Appendix 2
PAR-Q template used in research, that is given to each participant before involvement in research .
Appendix 3
1. 2. 3.
4. 5.
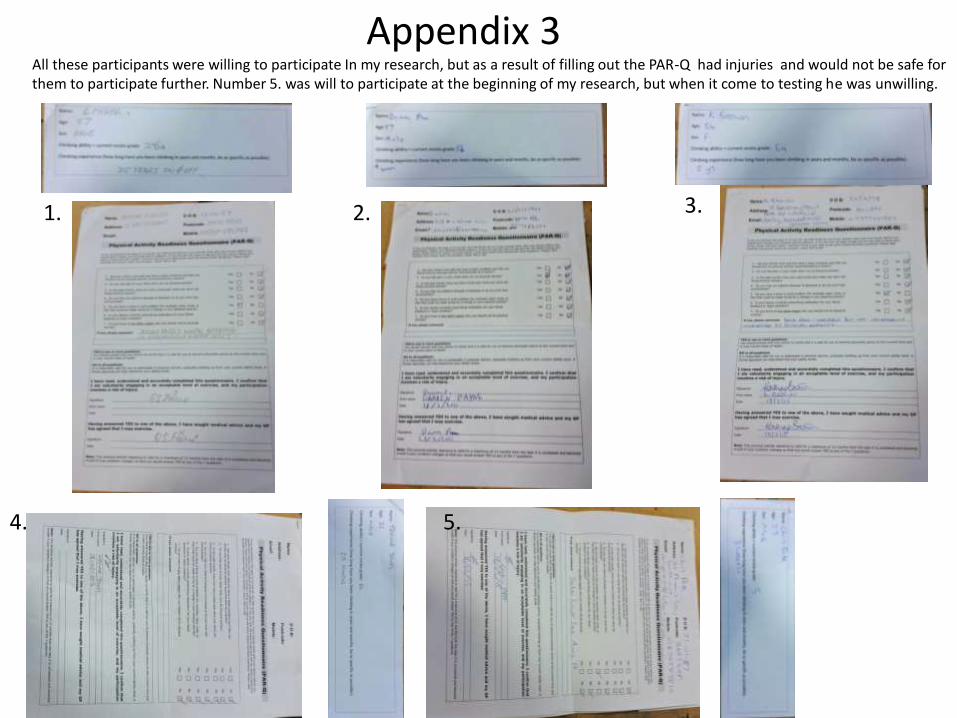
All these participants were willing to participate In my research, but as a result of filling out the PAR-Q had injuries and would not be safe for them to participate further. Number 5. was will to participate at the beginning of my research, but when it come to testing he was unwilling.

Appendix 4
C. D.
B.
E.F.

Appendix 4G.
H.
I.
J.K.

Appendix 4
L.
M. N.
O. P.
Appendix 5
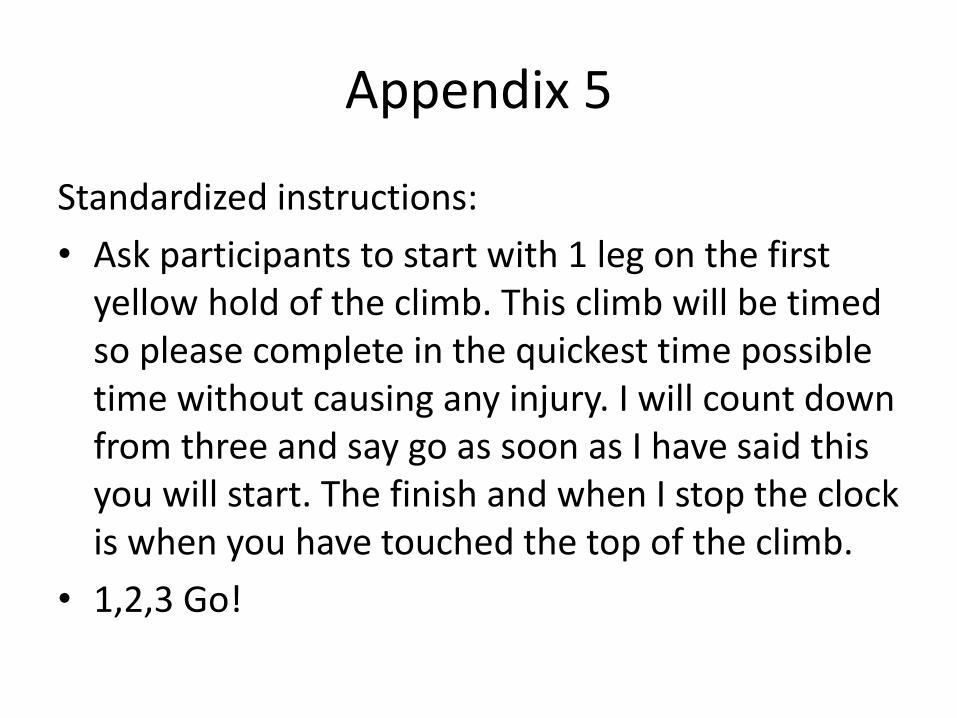
Standardized instructions:
• Ask participants to start with 1 leg on the first yellow hold of the climb. This climb will be timed so please complete in the quickest time possible time without causing any injury. I will count down from three and say go as soon as I have said this you will start. The finish and when I stop the clock is when you have touched the top of the climb.
• 1,2,3 Go!

Appendix 6
• Time trial on panel 7 yellow 6a: Participants A-P to gain data for objective 1 Letter: Time trial
score Panel 7 yellow 6a (minutes and seconds):
A 00:14.5
B 00:33.2
C 01:49.6
D 00:25.3
E 00:36.5
F 00:28.5
G 00:58.3
H 03:47.2
I 00:34.1
J 01:35.0
K 00:32.5
L 00:33.6
M 01:34.9
N 00:33.2
O 00:28.4
P 00:54.1

Appendix 7
A tick list to show if they are 6a climbers or not, completed after they have done the time trial on the 6a climb. To show if they are elite performers or not and can continue with the research.
Appendix 8 • https://www.youtube.com/watch?v=MtGr1ahadSY• https://www.youtube.com/watch?v=W6NSloCMb2w• https://www.youtube.com/watch?v=DfKgc4GC2cE• https://www.youtube.com/watch?v=l0hRHFmmUxI• https://www.youtube.com/watch?v=qF85jvYNzss• https://www.youtube.com/watch?v=WbLlDHx45kw• https://www.youtube.com/watch?v=wvmGAKXiQT0• https://www.youtube.com/watch?v=G7S4LxLGeB0&feature=youtu.be• https://www.youtube.com/watch?v=hV0ZfYn6P8M&feature=youtu.be• https://www.youtube.com/watch?v=6y8bmbGAj-c&feature=youtu.be• https://www.youtube.com/watch?v=xUDiAaJnqLw&feature=youtu.be• https://www.youtube.com/watch?v=I9ZbmnYEHRs
Videos of climbers doing panel 15 green 6b-looking at elite performers and how they climb compared to the other participants in my research. To show if there is a difference between there experience in climbing, and the way they climb.
Objective 1:

Appendix 9Climbing wall list: Panel number with the grade of each colour climbs in the wall.
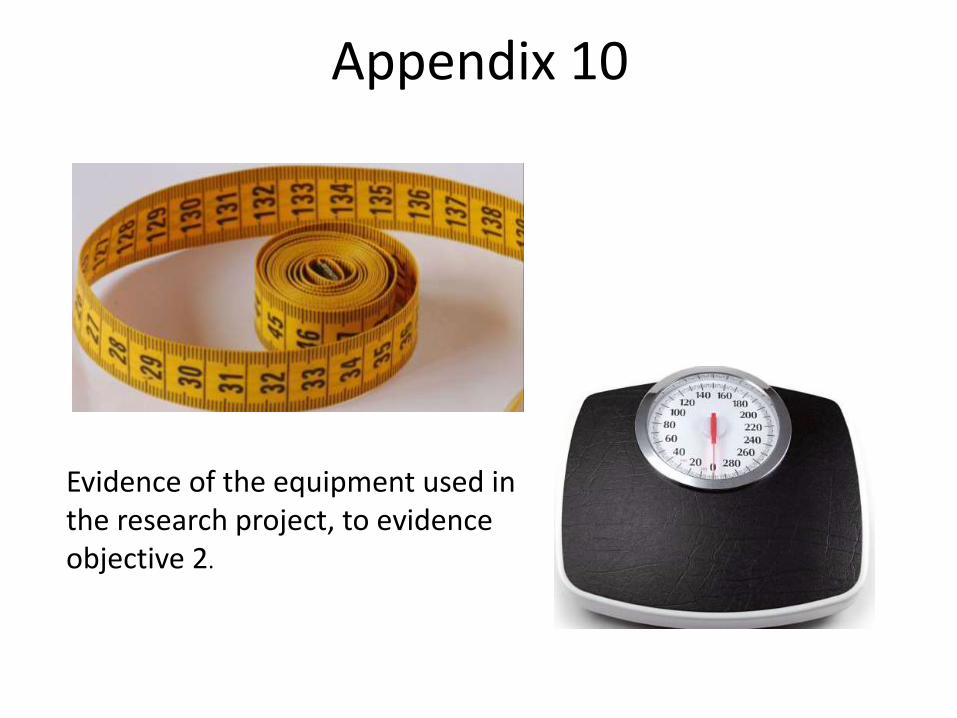
Appendix 10
Evidence of the equipment used in the research project, to evidence objective 2.

Appendix 11
Name: A- P
Age:
Sex:
Climbing ability = current onsite grade:
Climbing experience (how long have you been climbing in years and months, be as specific as possible):
Questionnaire: To answer objective 3 of the research project.

Research Project Figures and Tables
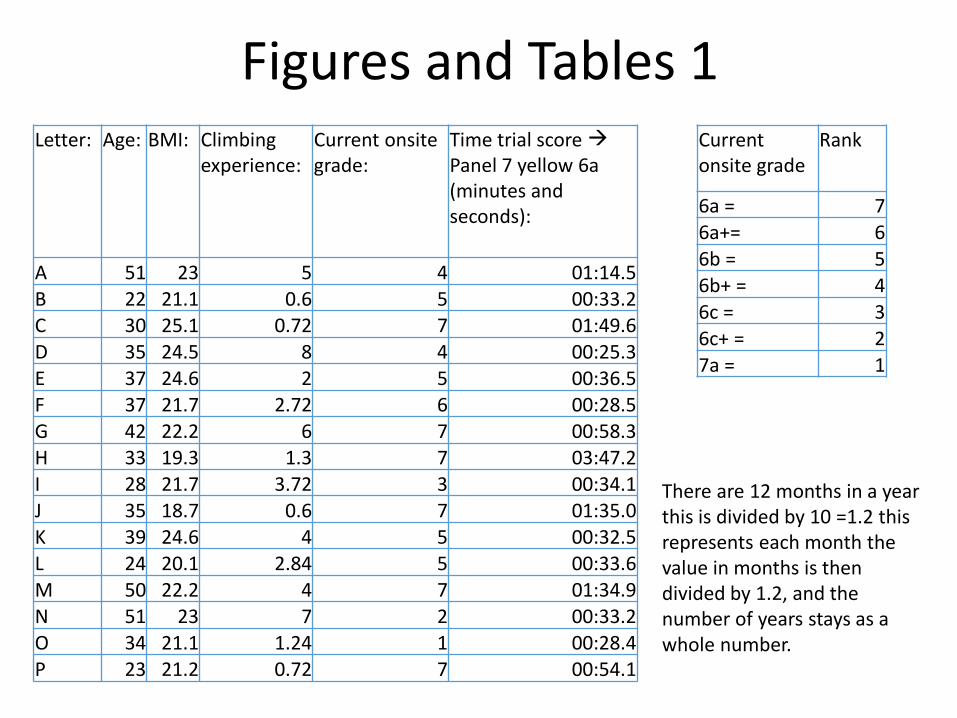
Figures and Tables 1 Letter: Age: BMI: Climbing
experience:Current onsite grade:
Time trial score
Panel 7 yellow 6a (minutes and seconds):
A 51 23 5 4 01:14.5B 22 21.1 0.6 5 00:33.2C 30 25.1 0.72 7 01:49.6D 35 24.5 8 4 00:25.3E 37 24.6 2 5 00:36.5F 37 21.7 2.72 6 00:28.5G 42 22.2 6 7 00:58.3H 33 19.3 1.3 7 03:47.2I 28 21.7 3.72 3 00:34.1J 35 18.7 0.6 7 01:35.0K 39 24.6 4 5 00:32.5L 24 20.1 2.84 5 00:33.6M 50 22.2 4 7 01:34.9N 51 23 7 2 00:33.2O 34 21.1 1.24 1 00:28.4P 23 21.2 0.72 7 00:54.1
Current onsite grade
Rank
6a = 76a+= 66b = 56b+ = 4
6c = 36c+ = 2
7a = 1
There are 12 months in a year this is divided by 10 =1.2 this represents each month the value in months is then divided by 1.2, and the number of years stays as a whole number.

Age
BMI Climbing
experience
Current onsite grade Time trial
score: 00:14.50
10
20
30
40
50
60
Participant A: Results
Age BMI
Climbing experience
Current onsite grade
Time trial score: 00:33.2
0
5
10
15
20
25
Participant B: Results
Age BMI
Climbing experience
Current onsite grade
Time trial score: 01:49.6
0
5
10
15
20
25
30
35
Participant C: Results
Age
BMI
Climbing experience
Current onsite grade
Time trial scale: 00:25.3
0
5
10
15
20
25
30
35
40
Participant D: Results
Figures and Tables 2
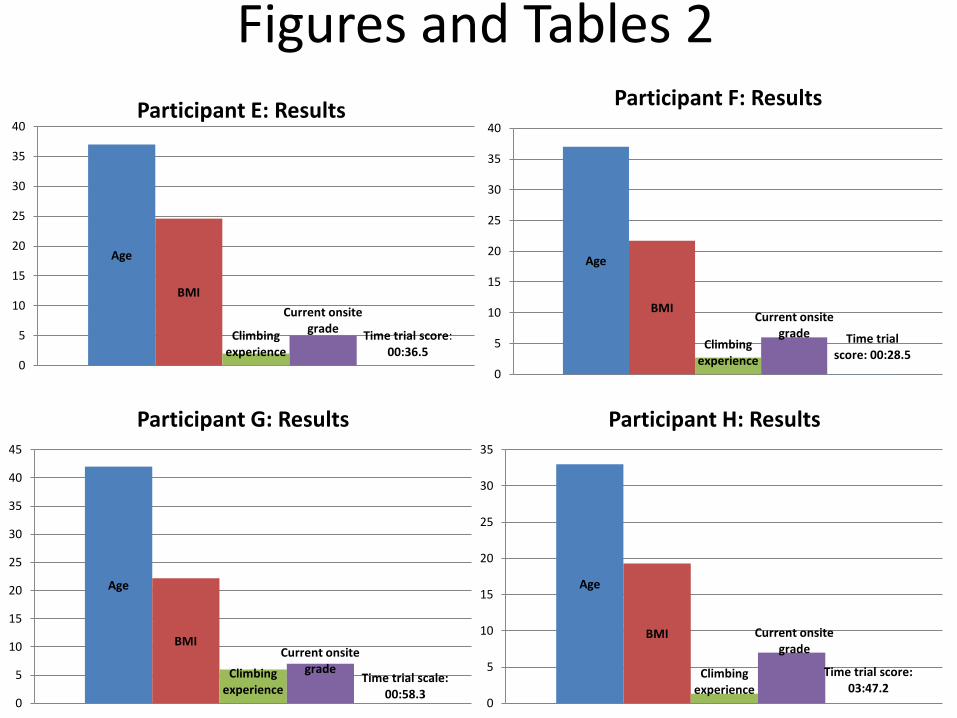
Age
BMI
Climbing experience
Current onsite grade
Time trial score: 00:36.5
0
5
10
15
20
25
30
35
40Participant E: Results
Age
BMI
Climbing experience
Current onsite grade Time trial
score: 00:28.5
0
5
10
15
20
25
30
35
40
Participant F: Results
Age
BMI
Climbing experience
Current onsite grade
Time trial scale: 00:58.3
0
5
10
15
20
25
30
35
40
45
Participant G: Results
Age
BMI
Climbing experience
Current onsite grade
Time trial score: 03:47.2
0
5
10
15
20
25
30
35
Participant H: Results
Figures and Tables 2

Age
BMI
Climbing experience
Current onsite grade Time trial
score: 00:34.10
5
10
15
20
25
30
Participant I:Results
Age
BMI
Climbing experience
Current onsite scale
Time trial scale: 01:35.0
0
5
10
15
20
25
30
35
40
Participant J: Results
Age
BMI
Climbing experience
Current onsite grade
Time trial score: 00:32.5
0
5
10
15
20
25
30
35
40
45
Participant K: Results
Age BMI
Climbing experience
Current onsite grade
Time trial score: 00:33.6
0
5
10
15
20
25
30
Participant L: Results
Figures and Tables 2

Age
BMIClimbing
experience
Current onsite grade Time trial
score:01:34.90
10
20
30
40
50
60
Participant M: Results
Age
BMIClimbing
experience Current onsite
grade
Time trial score: 00:33.2
0
10
20
30
40
50
60
Participant N: Results
Age
BMI
Climbing experience
Current onsite grade
Time trial score: 00:28.4
0
5
10
15
20
25
30
35
40
Participant O: Results
Age BMI
Climbing experience
Current onsite grade
Time trial scale:00:54.1
0
5
10
15
20
25
Participant P: Results
Figures and Tables 2

Figures and Tables 3
0
1
2
3
4
5
6
7
8
9
0 5 10 15 20 25 30
Clim
bin
g e
nxp
eri
en
ce
BMI
The comparison between BMI and climbing experience for all participants A-P
BMI and climbing experience
Linear (BMI and climbing experience)
Figures and Tables 4
0
1
2
3
4
5
6
7
8
0 5 10 15 20 25 30
Cu
rre
nt
on
site
gra
de
BMI scores
The comaprison between BMI and current onsite grade for all participants A-P
BMI and current onsite grade
Linear ( BMI and current onsite grade )
Figures and Tables 5
00:00.0
00:43.2
01:26.4
02:09.6
02:52.8
03:36.0
04:19.2
0 5 10 15 20 25 30
Tim
e t
rial
sco
res
BMI
The comparison between BMI and the time trial socre of participants A-P
Series1
Linear (Series1)
Figures and Tables 6
0
1
2
3
4
5
6
7
8
0 1 2 3 4 5 6 7 8 9
Cu
rre
nt
on
site
gra
de
Climbing experience
The comparison between climbing experience and current onsite grade for participants A-P
Series1
Linear (Series1)
Figures and Tables 7
00:00.0
00:43.2
01:26.4
02:09.6
02:52.8
03:36.0
04:19.2
0 1 2 3 4 5 6 7 8 9
Tim
e t
rial
sco
re (
min
ute
s an
d s
eco
nd
s)
Climbing experience (years and months)
The comparison between climbing experience and time trail score for participants A-P
Series1
Linear (Series1)

Figures and Tables 8
00:00.0
00:43.2
01:26.4
02:09.6
02:52.8
03:36.0
04:19.2
0 1 2 3 4 5 6 7 8
Tim
e t
rial
sco
re
Current onsite grade
The comparision between current onsite grade and time trial score of participants A-P
Series1
Linear (Series1)
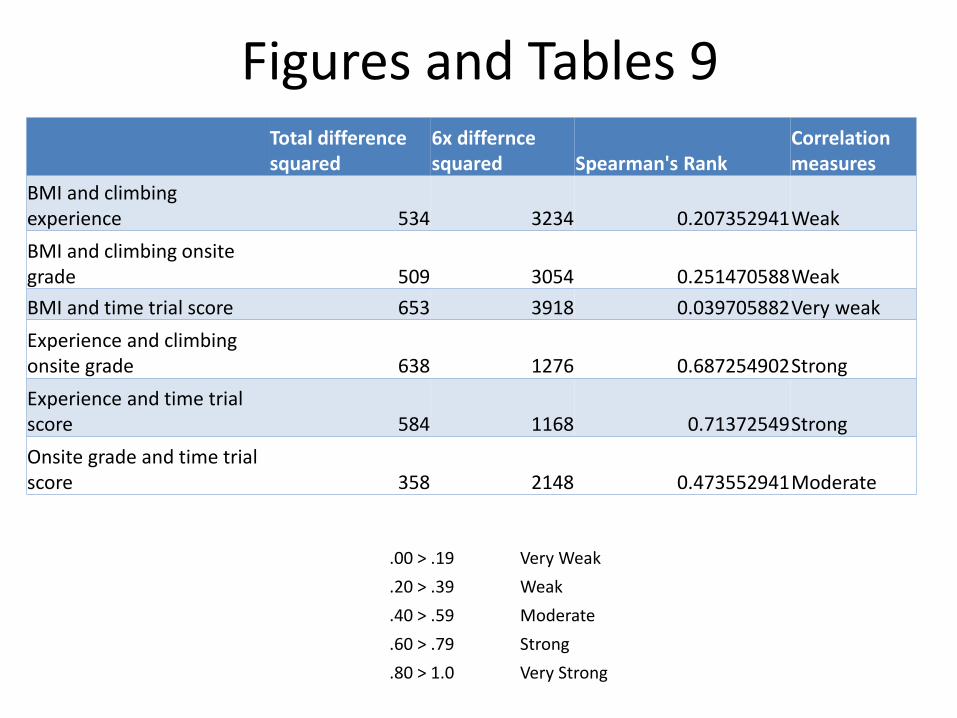
Figures and Tables 9 Total difference squared
6x differnce squared Spearman's Rank
Correlation measures
BMI and climbing experience 534 3234 0.207352941Weak
BMI and climbing onsite grade 509 3054 0.251470588Weak
BMI and time trial score 653 3918 0.039705882Very weak
Experience and climbing onsite grade 638 1276 0.687254902Strong
Experience and time trial score 584 1168 0.71372549Strong
Onsite grade and time trial score 358 2148 0.473552941Moderate
.00 > .19 Very Weak
.20 > .39 Weak
.40 > .59 Moderate
.60 > .79 Strong
.80 > 1.0 Very Strong

Figures and Tables 10
0
0.1
0.2
0.3
0.4
0.5
0.6
0.7
0.8
BMI andclimbing
experience
BMI andclimbing
onsite grade
BMI andtime trial
score
Experienceand cimbingonsite grade
Experienceand timetrial score
Onsitegrade andtime trial
score
Spearman's Rank
Spearman's Rank
.00 > .19 Very Weak
.20 > .39 Weak
.40 > .59 Moderate
.60 > .79 Strong
.80 > 1.0 Very Strong