Embed Size (px)
Citation preview

FEB 10, 2015
WHAT SHOULD I MONITOR
AND HOW SHOULD I DO IT? - IN MYSQL (MOSTLY)

Optimization, Backups, Replication, and more
Baron Schwartz, Peter Zaitsev &
Vadim Tkachenko
High PerformanceMySQL
3rd Edition
Covers Version 5.5
LOGISTICS
• Tweet questions to #vividcortex
• Slides & video will be available
• @xaprb on Twitter; email [email protected]
THIS IS NOT A VENDOR PITCH
• Sure, VividCortex is the world’s best MySQL performance monitoring platform, but…
• Some of what I’ll suggest isn’t in VividCortex’s feature set, and some may never be.
• Goal: narrow the surface area to get you 95% of the wins easily.
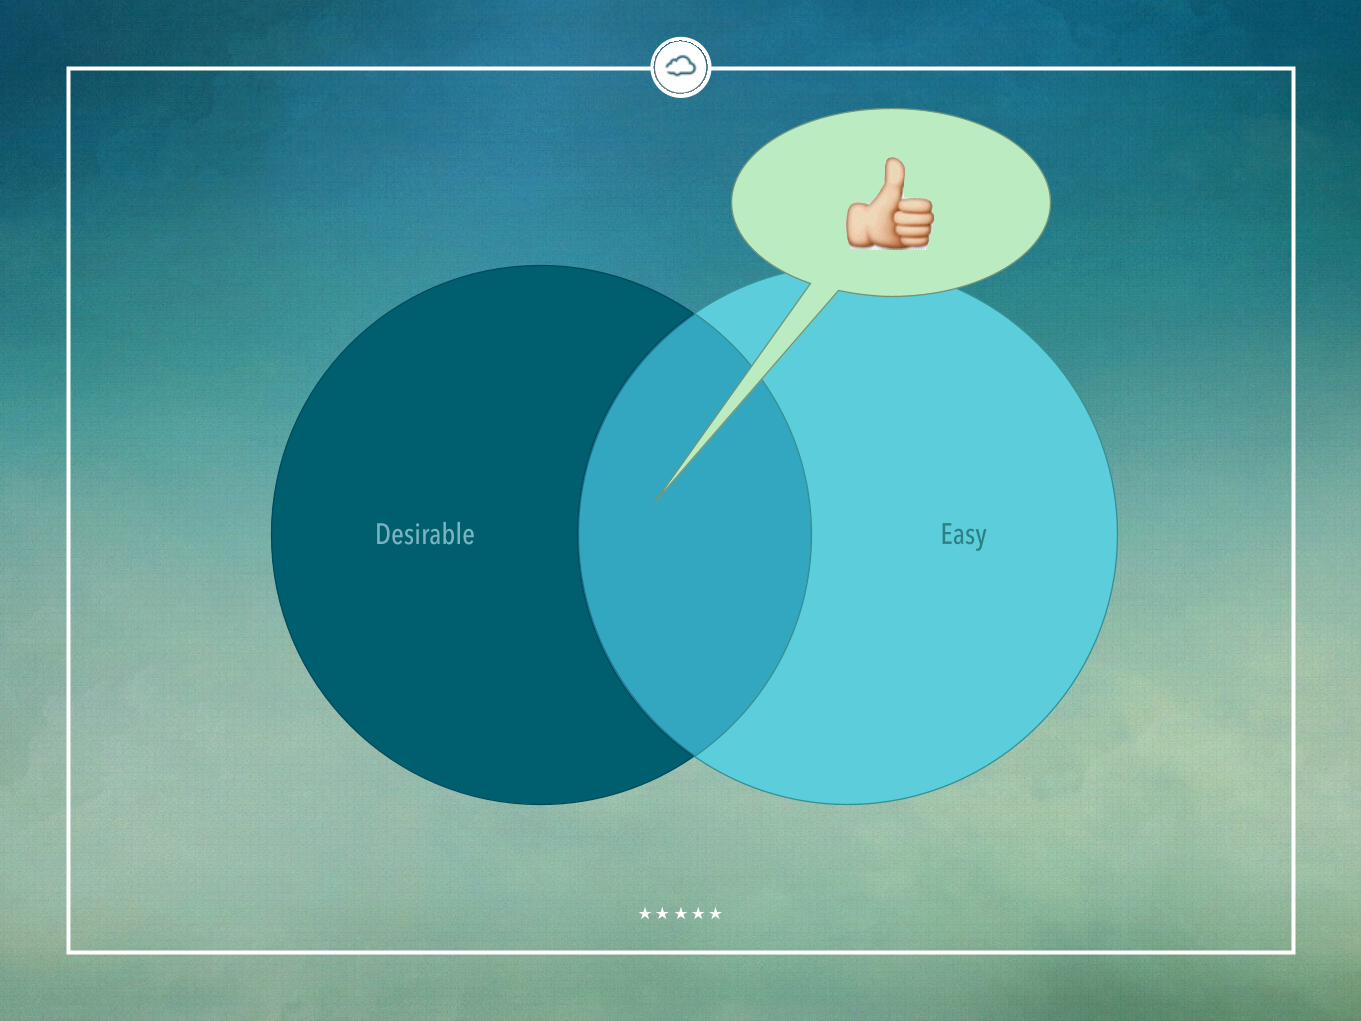
Desirable Easy

OVERALL GOAL
• Look for the smallest set of things that you should monitor and/or alert
• To get the most benefit
• Try very hard to avoid false alarms, and keep every alert actionable
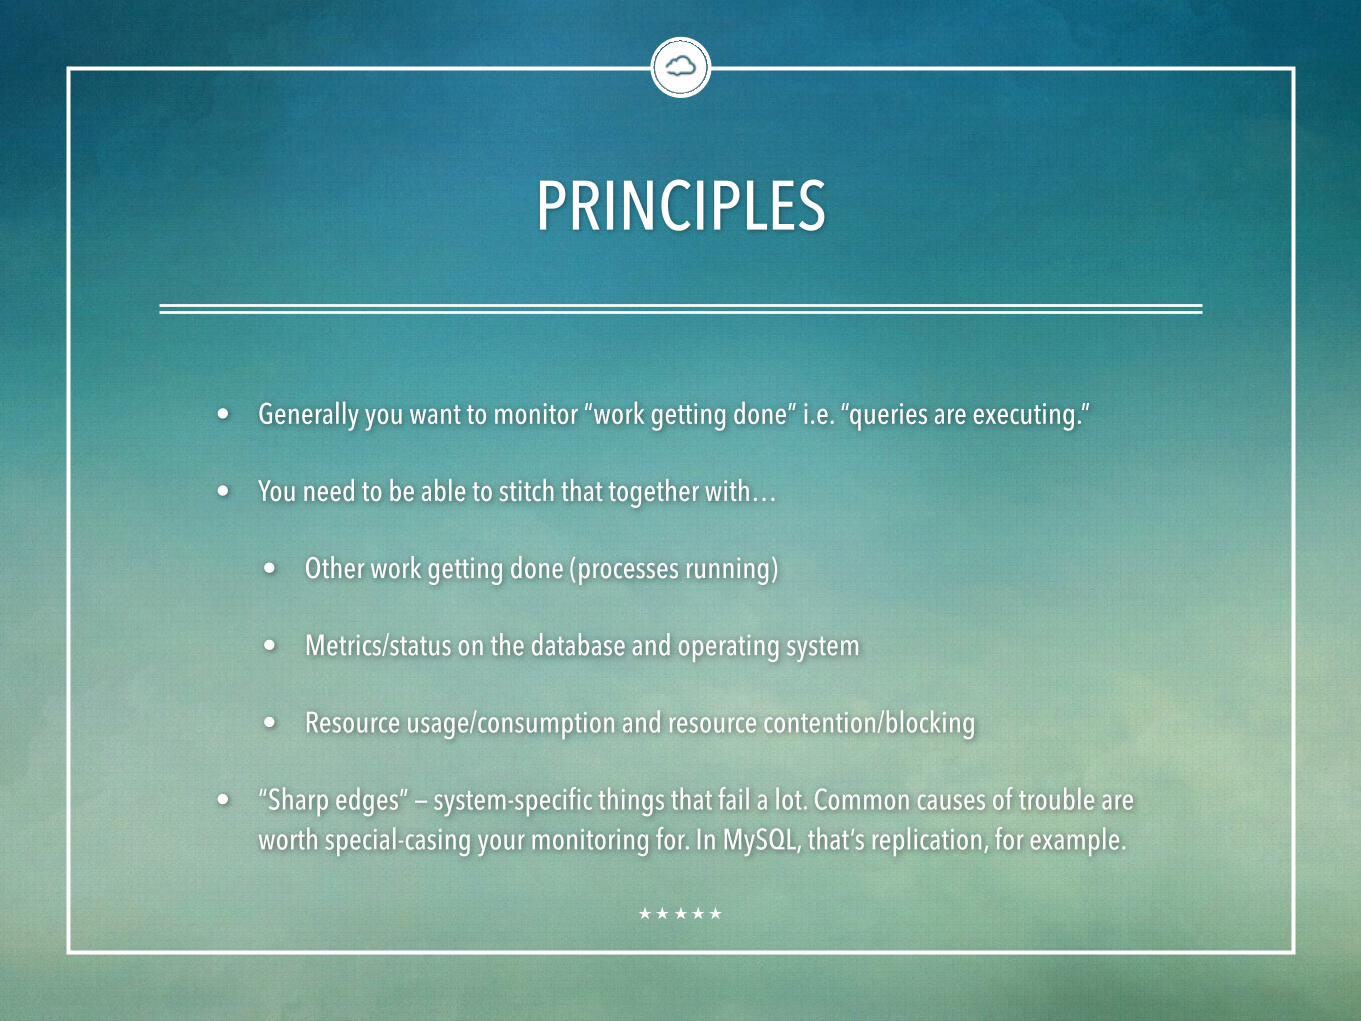
PRINCIPLES
• Generally you want to monitor “work getting done” i.e. “queries are executing.”
• You need to be able to stitch that together with…
• Other work getting done (processes running)
• Metrics/status on the database and operating system
• Resource usage/consumption and resource contention/blocking
• “Sharp edges” — system-specific things that fail a lot. Common causes of trouble are worth special-casing your monitoring for. In MySQL, that’s replication, for example.

• Don’t use top-N lists from Google
• Don’t just do what’s included in some Nagios plugin
WHAT NOT TO DO

SOME HORRIBLE PLUGIN YOU SHOULD
NOT USE
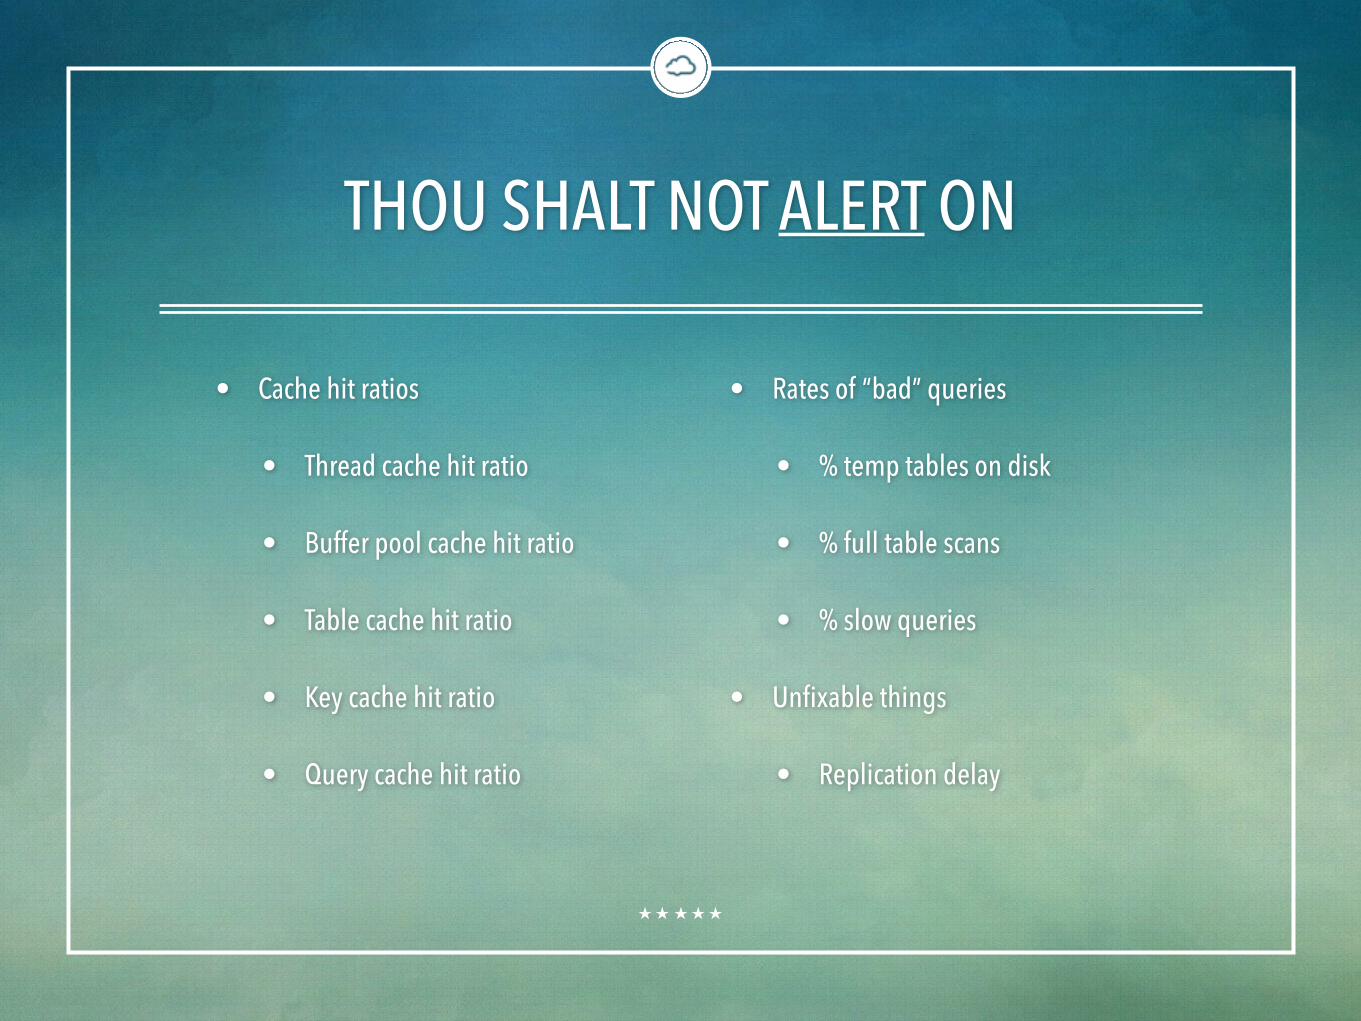
THOU SHALT NOT ALERT ON
• Cache hit ratios
• Thread cache hit ratio
• Buffer pool cache hit ratio
• Table cache hit ratio
• Key cache hit ratio
• Query cache hit ratio
• Rates of “bad” queries
• % temp tables on disk
• % full table scans
• % slow queries
• Unfixable things
• Replication delay

WHY NOT?
• Those are properties of the workload and application
• They are not conditions to alert/warn about
• They are not fixable / actionable in the service

“IF YOU COULD GIVE UP TRICKS AND CLEVERNESS, THAT WOULD BE THE CLEVEREST TRICK!”
— RUMI

№0 AVAILABILITY• Is the server available? • Can you connect? • Can you run a useful (real) query? • (Aside) configure skip_name_resolve!

№1 LOGS• Slow Query Log size. Is it rotated? • Is the slow query log deleted but still open? • Is the disk getting full?

№2 DISK SPACE• Is the disk getting full? • (Ideally) alarm on how soon till disk fills, not on a
threshold of disk fullness %

№3 STALLS/SPIKES• Momentary pauses/dips/spikes/freezes/stalls • What other processes are running on the machine? • Is the server actively paging/swapping? • (Generally) what is happening external-to-server?

№4 CONNECTIONS• Are you reaching max_connections limits? • (Optionally) max_user_connection limits • You need to know if app can’t connect.
№5PROCESSES
• Long-running queries? • Long-idle processes/threads/connections? • Too many running processes? • Process states:
• Locked • Statictics • Unauthenticated users (skip_name_resolve)

№6TRANSACTIONS
• Long-running or long-idle transactions? • Too many transactions? (InnoDB) Queued txns? • Locked/blocked/waiting transactions?
№7REPLICATION
• Is replication running? • Is there replication lag? (Generally don’t alert on
this) • Is replicated data, in fact, true and correct?
№8QUERY PERFORMANCE• These are generally NOT suitable for alerts. • Top queries to optimize. • Response time outliers (can indicate stalls/locking,
data skew, other problems to investigate). • Queries not using indexes; full scans. • Indexes that are duplicates or unused. • Queries that return errors/warnings to the client.
№9OPERATIONAL ASPECTS
• Server restarts (“uptime counter” is low). • Server configuration change events. • Messages in the error log.

LET ME ‘SPLAIN YOU… NO THERE IS TOO
MUCH, LET ME SUM UP
• Alert on work (queries) getting done, or lack thereof, if you can.
• Most of the metrics and counters in MySQL and similar systems shouldn’t be studied for their own sake.
• Look out for system-specific failures and edge cases that can make things brittle.
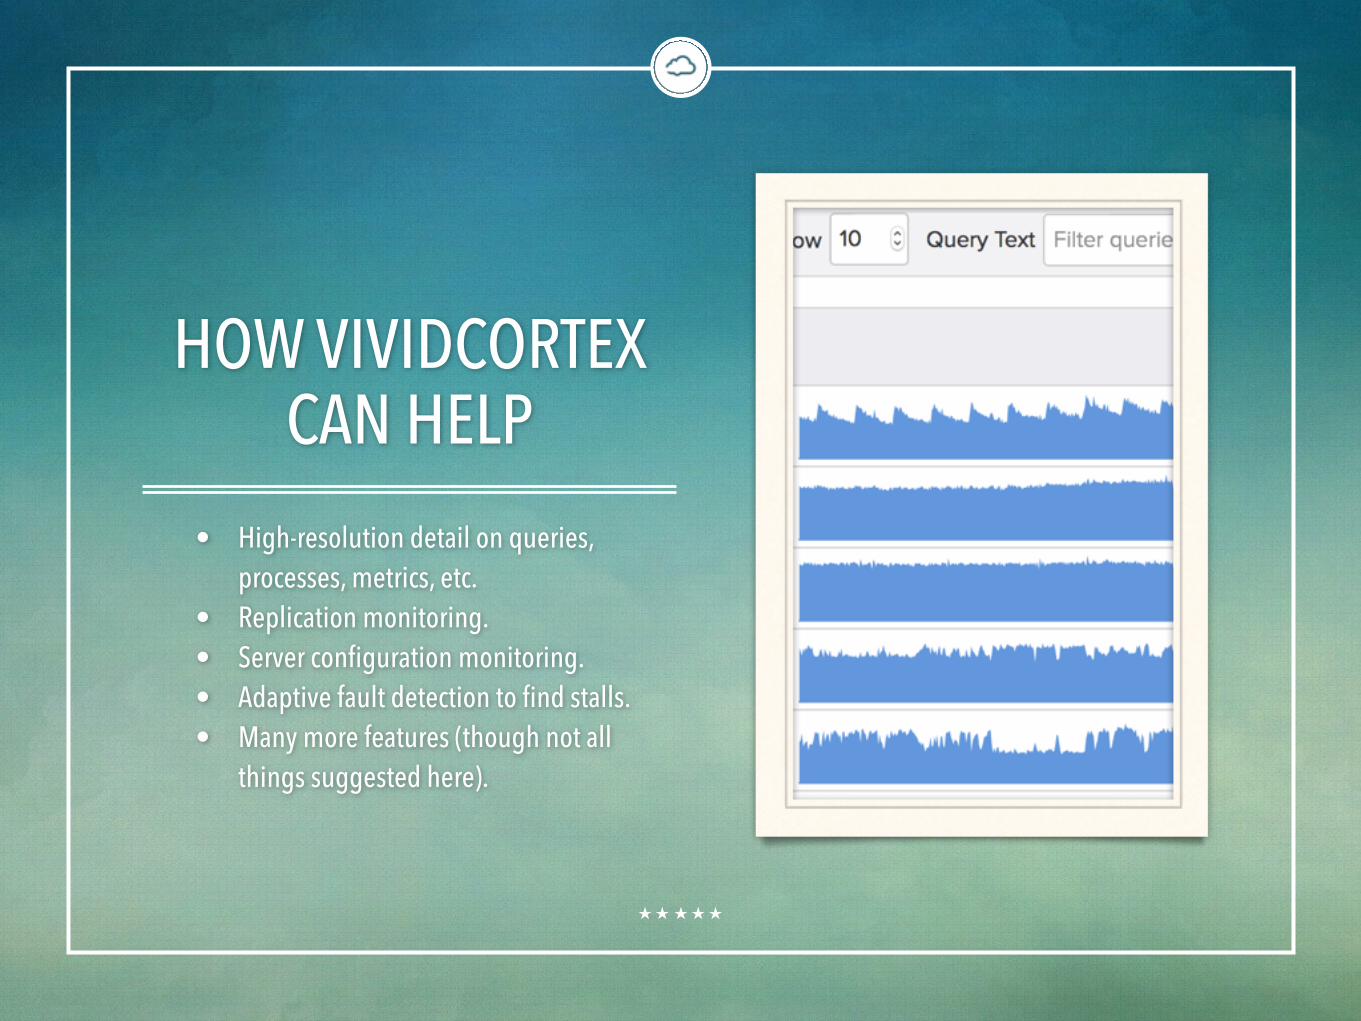
HOW VIVIDCORTEX CAN HELP
• High-resolution detail on queries, processes, metrics, etc.
• Replication monitoring. • Server configuration monitoring. • Adaptive fault detection to find stalls. • Many more features (though not all
things suggested here).

RESOURCES
• High Performance MySQL 3rd Edition — highperfmysql.com
• Percona Monitoring Plugins (I wrote them :-) for Nagios — percona.com
• VividCortex — https://vividcortex.com — free trial, see how well you know your systems!
• Feel free to contact me:
• Twitter @xaprb
• LinkedIn https://linkedin.com/in/xaprb


