Embed Size (px)
Citation preview
SUBMITED BY--Name : Kuhinoor AlamEmail : [email protected]
iBirds software services Pvt. Ltd.
DEVELOPER CONSOLE
Q. What is the developer console?
• The Developer Console is a environment with a collection of tools you can use to create, debug, and test applications in your Salesforce organization.
Q. Why Developer Console?
• Debugging.• Execute Apex code.• Code Coverage.• Execute query.
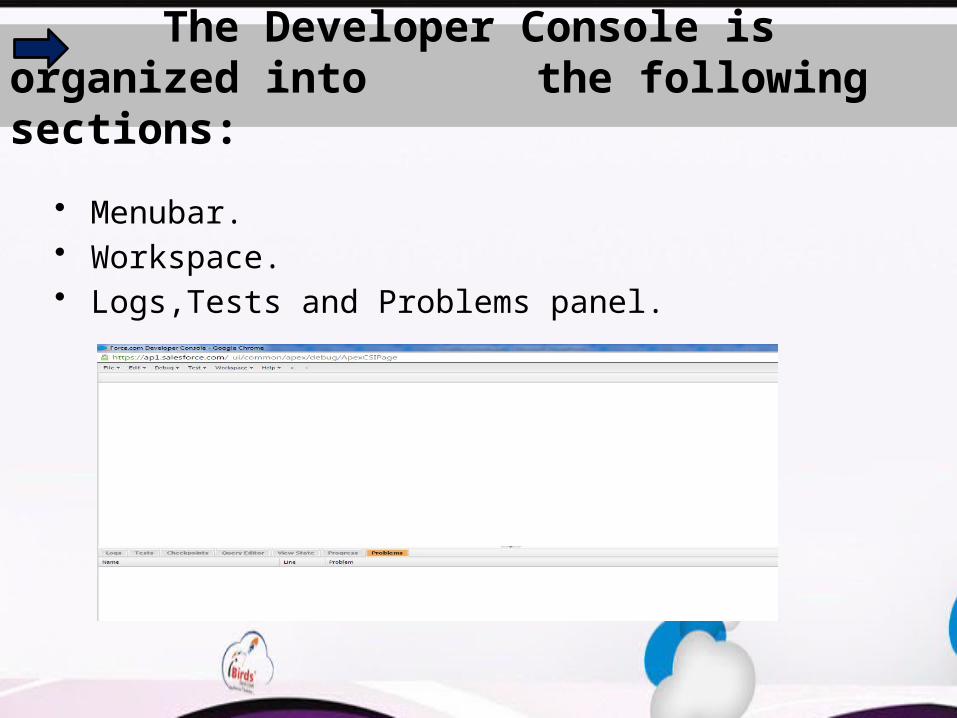
The Developer Console is organized into the following sections:
• Menubar.• Workspace.• Logs,Tests and Problems panel.
File Menu• New: You can create Apex class, trigger, Visualforce
page, Visualforce Component, Static resource(text, XML, JavaScript, or CSS).
• Open: Launches a File Open Window that allows you to browse and open your application code and data objects.
• Open Resource: Launches an Open Resource window that allows you to search for files by name.
• Open Log: Opens the selected log in the Log Inspector. You can also access logs from the Logs tab.
• Open Raw Log: Opens the selected log in plain text.• Download Log: Saves a text copy of the selected log to
your local machine.
• Save: Saves the item in the active tab.• Save All: Saves changes in all the tabs open in your
workspace. Use this option to save a set of dependent changes.
• Delete: Deletes the item in the active tab. You can only delete Apex classes, triggers, Visualforce pages, and static resource files.
• Close: Closes the active tab.• Close All: Closes all the tabs open in your workspace. If
any tab contains unsaved changes, you’ll be prompted to save them.
Edit Menu
• Find: Searches the current view for the selected text. If no text is selected, opens a browser find dialog.
• Find Next: Finds the next match for the selected or specified text in the current view.
• Find/Replace: Finds and replaces the selected or specified text in the current view.
• Search in Files: Opens a search dialog to search the contents of all code files.
• Fix Indentation: Corrects the indentation in the current code file.
Debug Menu
• Open Execute Anonymous Window: Opens a new window that allows you to enter Apex code for testing.
• Execute Last: Executes the most recent entry in the Enter Apex Code window.
• Switch Perspective: Selects the perspective from the list of available standard and custom perspectives.
• View Log Panels: Displays a list of available panels for use in a perspective.
• Perspective Manager: Opens the Perspective Manager. • Save Perspective: Saves any changes you’ve made to the current
perspective since it was open.• Save Perspective As: Saves a copy of the current perspective with
a different name.• Auto-Hide Logs: Select this option to clear existing logs when the
page is refreshed.
• Show My Current Logs Only: Deselect this option (selected by default) to see all logs saved for your organization, including newly-generated logs created by other users.
• Show My Current Checkpoints Only: Deselect this option (selected by default) to display all checkpoints currently saved for your organization, including newly-generated ones created by other users.
• Clear: Select Log Panel, Checkpoint Results Panel, or Checkpoint Locations to erase current data from the cache and refresh the display.
• Resume Updating: Renews the connection to the server. This option is only shown if polling has been interrupted due to inactivity.
• Change Log Levels: Opens the log settings dialog to define logging levels for future requests.
Tests in the Developer Console
• Always Run Asynchronously: Run Asynchronously is enabled, test runs that include tests from only one class run synchronously. Test runs that include more than one class run asynchronously.
• New Run: Creates a test run. For details.• Rerun: Runs the test that’s selected in the Tests tab.• Rerun Failed Tests: To rerun only the failed tests from the test run
that’s highlighted in the Tests tab, choose this option.• Run All: Runs all saved test runs.• Abort: Aborts the test selected in the Tests tab.• Collapse All: Collapses all open tests in the Tests tab.• Expand All: Expands all tests in the Tests tab.• Clear Test Data: Clears the current test data and code coverage
results.
Developer Console Workspaces
• Switch Workspace: Allows you to select from your saved workspaces.
• New Workspace: Creates a new workspace. Enter a name for the workspace and click OK. Open the resources that you want in the workspace. The workspace will be saved when you switch to a different workspace or close the Developer Console.
• Rename Current Workspace: Overwrites the current workspace with the name you enter.
• Workspace Manager: Opens a popup window that allows you to browse, open, create, and delete workspaces.
Log panel
The Log Inspector can contain any of the following panels:• Stack Tree• Execution Stack• Execution Log• Source • Variable• Execution Overview
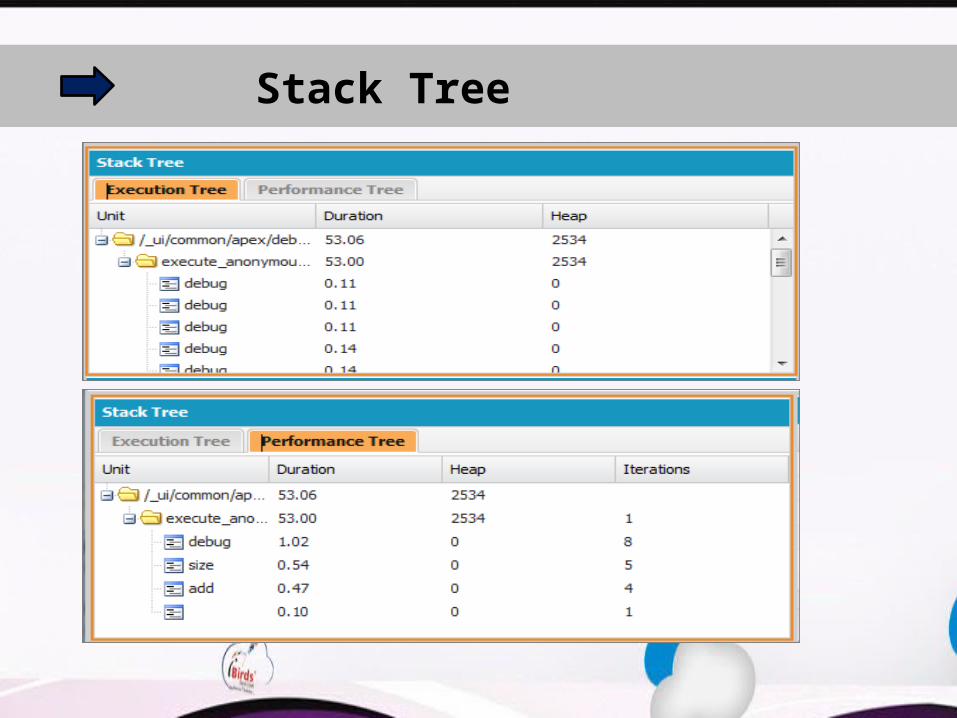
Stack Tree
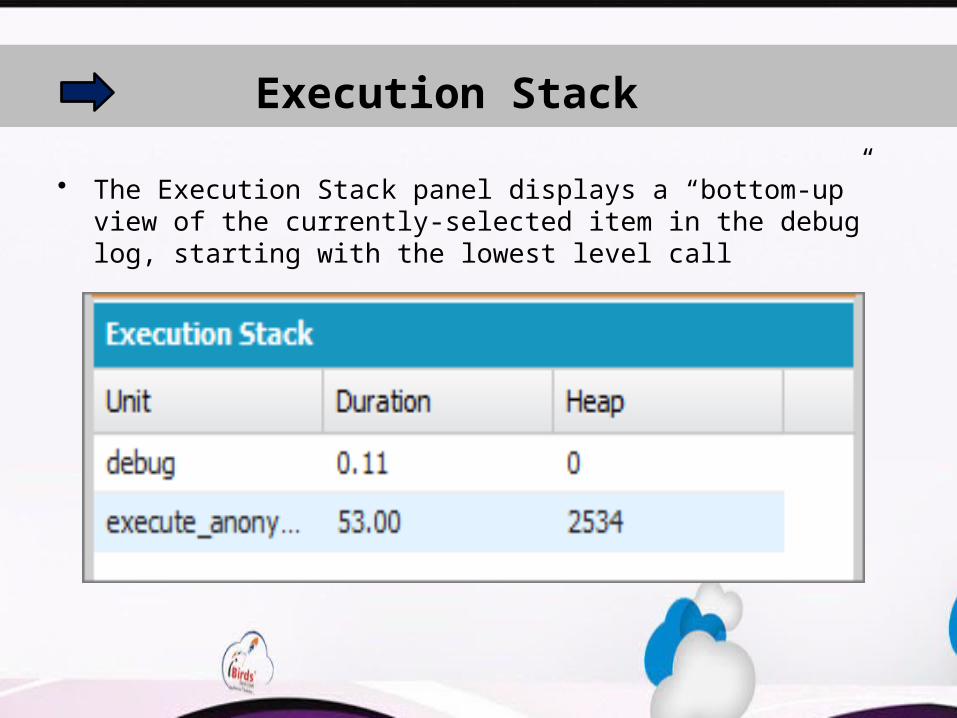
Execution Stack
• The Execution Stack panel displays a “bottom-up” view of the currently-selected item in the debug log, starting with the lowest level call
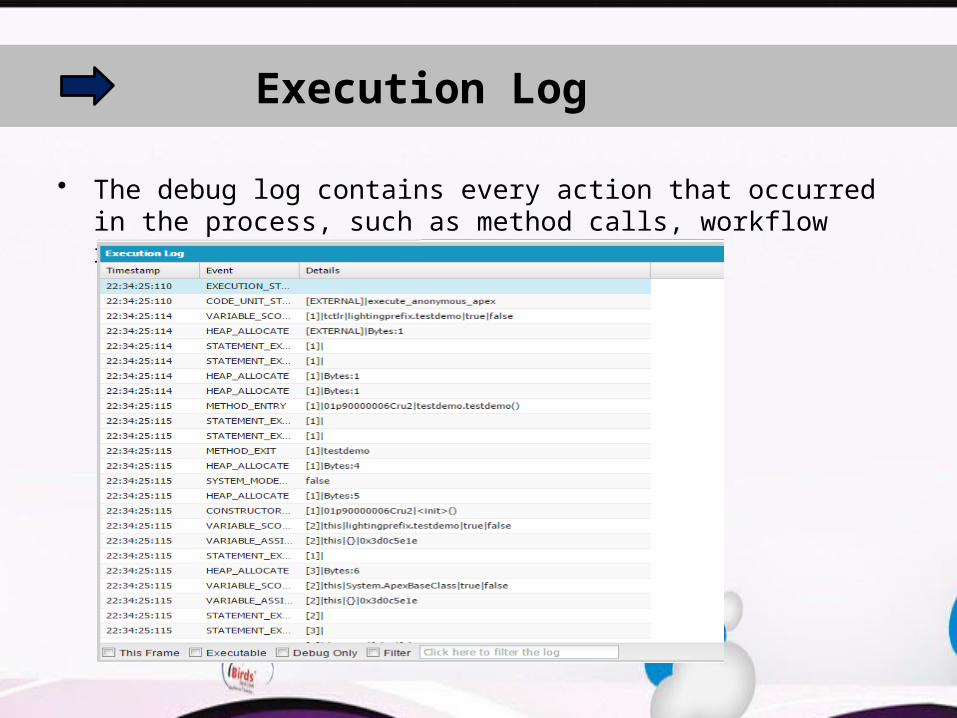
Execution Log
• The debug log contains every action that occurred in the process, such as method calls, workflow rules, and DML operations.
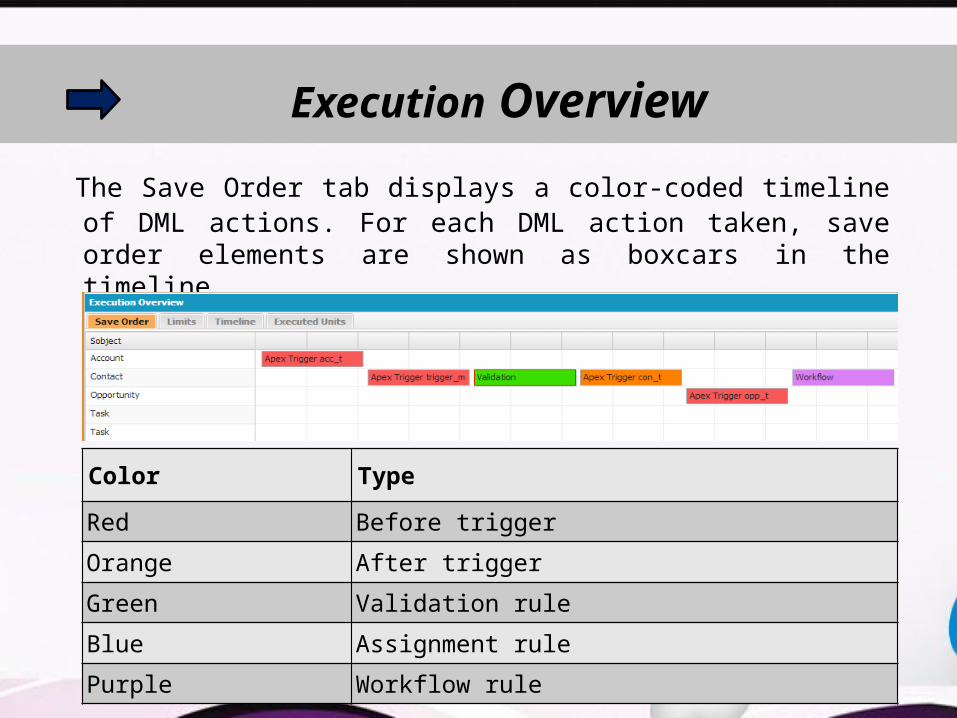
Execution Overview The Save Order tab displays a color-coded timeline of DML actions.
For each DML action taken, save order elements are shown as boxcars in the timeline.
Color TypeRed Before trigger
Orange After trigger
Green Validation rule
Blue Assignment rule
Purple Workflow rule
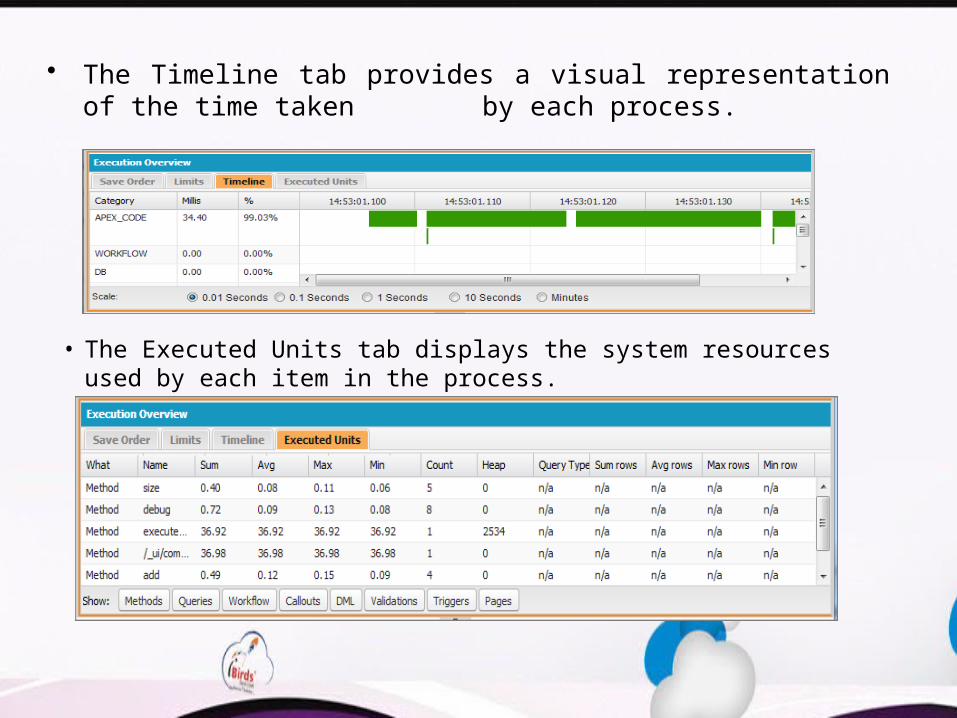
• The Timeline tab provides a visual representation of the time taken by each process.
• The Executed Units tab displays the system resources used by each item in the process.
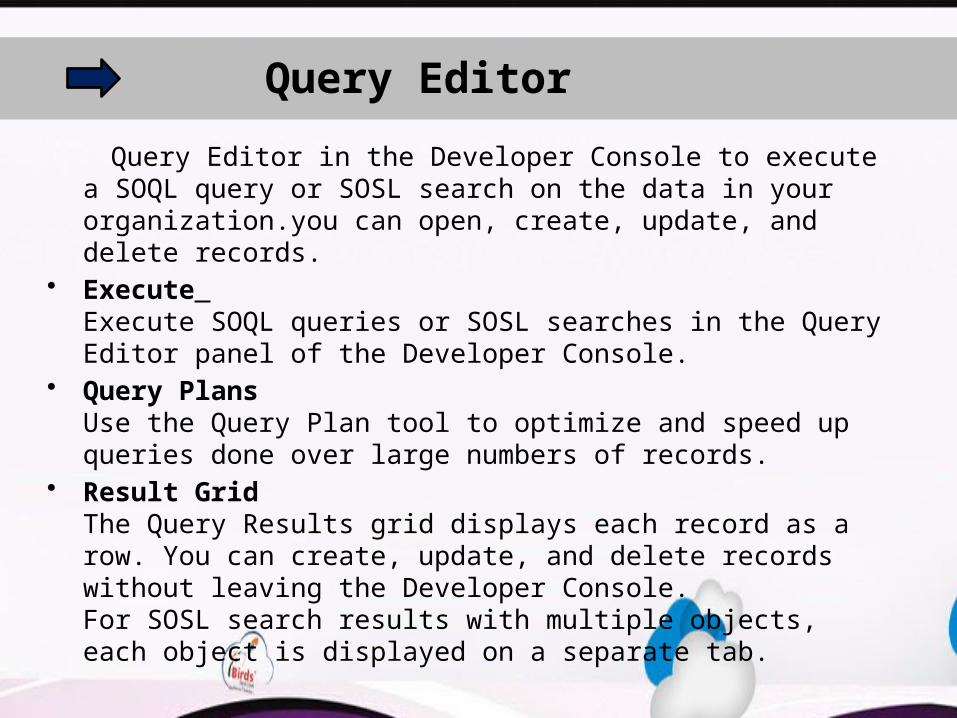
Query Editor Query Editor in the Developer Console to execute a SOQL query
or SOSL search on the data in your organization.you can open, create, update, and delete records.
• Execute Execute SOQL queries or SOSL searches in the Query Editor panel of the Developer Console.
• Query PlansUse the Query Plan tool to optimize and speed up queries done over large numbers of records.
• Result GridThe Query Results grid displays each record as a row. You can create, update, and delete records without leaving the Developer Console. For SOSL search results with multiple objects, each object is displayed on a separate tab.
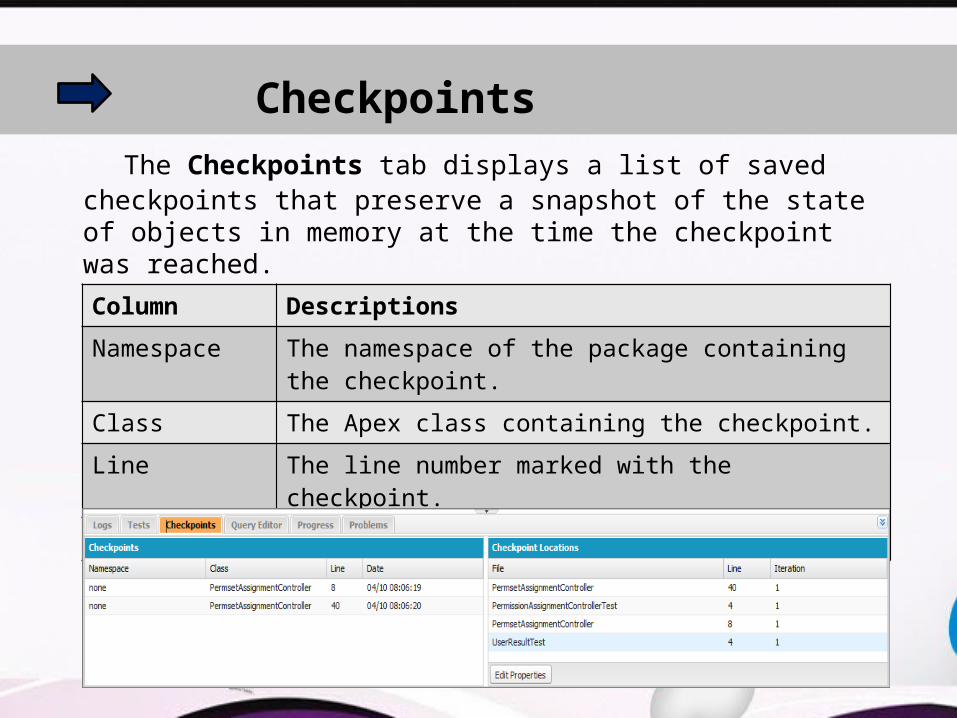
Checkpoints The Checkpoints tab displays a list of saved checkpoints that
preserve a snapshot of the state of objects in memory at the time the checkpoint was reached.
Column DescriptionsNamespace The namespace of the package containing the
checkpoint.Class The Apex class containing the checkpoint.
Line The line number marked with the checkpoint.
Time The time the checkpoint was reached.
View State Tab
The View State tab in the Developer Console allows you to examine the view state for a Visualforce page request.
Enable the View State tab:-• From your personal settings, enter Advanced User Details in
the Quick Find box, then select Advanced User Details. No results? Enter Personal Information in the Quick Find box, then select Personal Information.
• Click Edit.• Select the Development Mode checkbox if it isn't selected.• Select the Show View State in Development Mode checkbox.• Click Save.
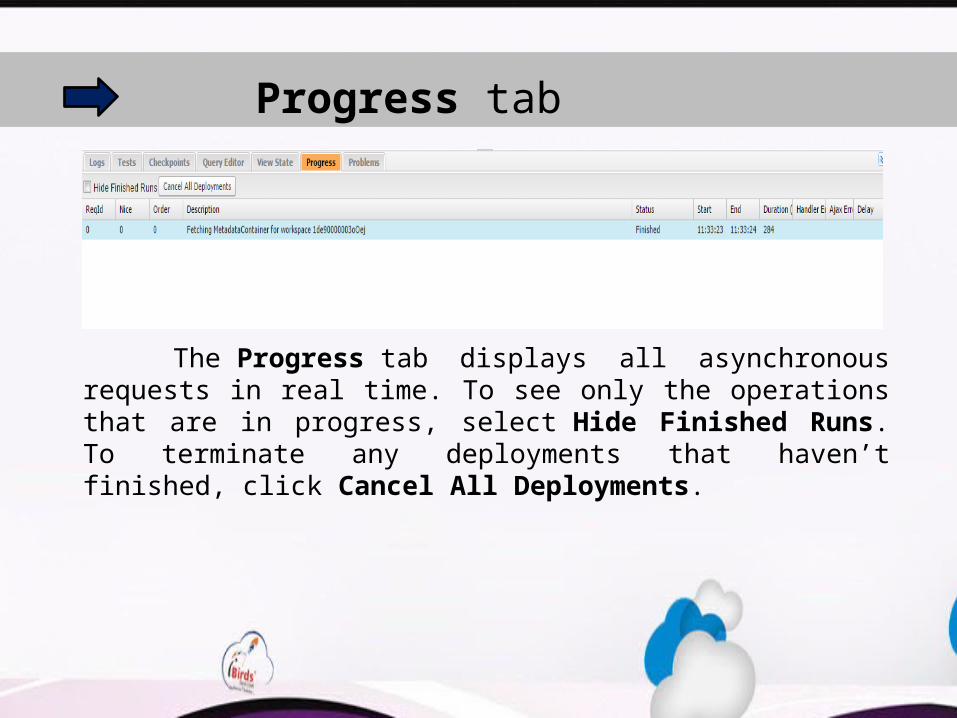
Progress tab
The Progress tab displays all asynchronous requests in real time.
To see only the operations that are in progress, select Hide Finished Runs. To terminate any deployments that haven’t finished, click Cancel All Deployments.
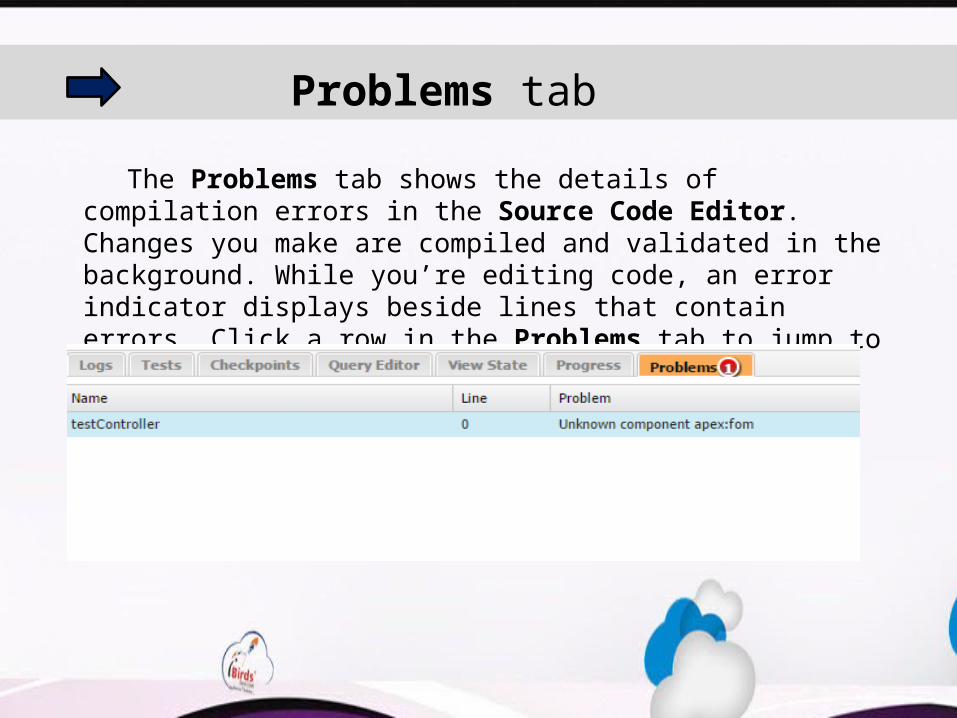
Problems tab
The Problems tab shows the details of compilation errors in the Source Code Editor. Changes you make are compiled and validated in the background. While you’re editing code, an error indicator displays beside lines that contain errors. Click a row in the Problems tab to jump to the line of code that caused the error.