Embed Size (px)
Citation preview

Measuring Social Media:
Assessing Your ImpactKelli Hansen
Special Collections & Rare BooksUniversity of Missouri Libraries
[email protected] | @BiblioKelli


Social media is not a numbers game.It’s a conversation.
“conversation” by Chris Blakeley CC BY-NC-ND 2.0 via Flickr. https://www.flickr.com/photos/csb13/4387566462

Start with a Goal
“Soccer Goal (Front)” by laffy4k CC BY 2.0 via Flickr. https://www.flickr.com/photos/laffy4k/4564776861

“001_365_01.01.2013” by Paula Naugle CC BY-NC-SA 2.0 via Flickr. https://www.flickr.com/photos/plnaugle/8334714234
Specific. Who? What? Where?
Measurable. How many or how much?
Attainable. Is this realistic?
Relevant. Why?
Time-bound. When?

Goal SMART GoalMake connections with students. During the 2015 fall semester, we will
tweet four times per day using images and hashtags to increase our local following by 10%.
Promote services and events. We will promote our services and events this month by making 2-3 Twitter and Facebook posts for each specific event or service.
Increase awareness of our library’s collections.
We aim to see a 15% growth in referrals to our website from social media by posting digitized images and links 3-5 times per week during the 2015-2016 academic year.

SMART Goal MeasureDuring the 2015 fall semester, we will tweet four times per day using images and hashtags to increase our local following by 10%.
• Post frequency and timing• Follower interests• Follower growth• Follower locations
We will promote our services and events this month by making 2-3 Twitter and Facebook posts per week with links to each specific event or service.
• Engagement rates• Post frequency and timing• Reach• Referrals
We aim to see a 15% growth in referrals to our website from social media by tweeting digitized images and links 3-5 times per week during the 2015-2016 academic year.
• Website referrals• Post frequency and timing• Retweet rate
Let your measurements fit your goals.

Terminology Defined
“dictionary definition: work” by Jeffrey Cuvillier, CC BY-NC-SA 2.0 via Flickr. https://www.flickr.com/photos/jaboney/390315232

Analytics terminology
• Reach = the number of people who could have seen your post, tweet, status update, etc.• Organic reach (on Facebook) = the number of unique
people who saw your unsponsored post
• Impressions = the aggregate number of times your piece of content shows up on a screen.• Engagement = clicks, likes, shares, retweets, or
other interactions with your posts• Engagement rates are calculated differently across
different platforms
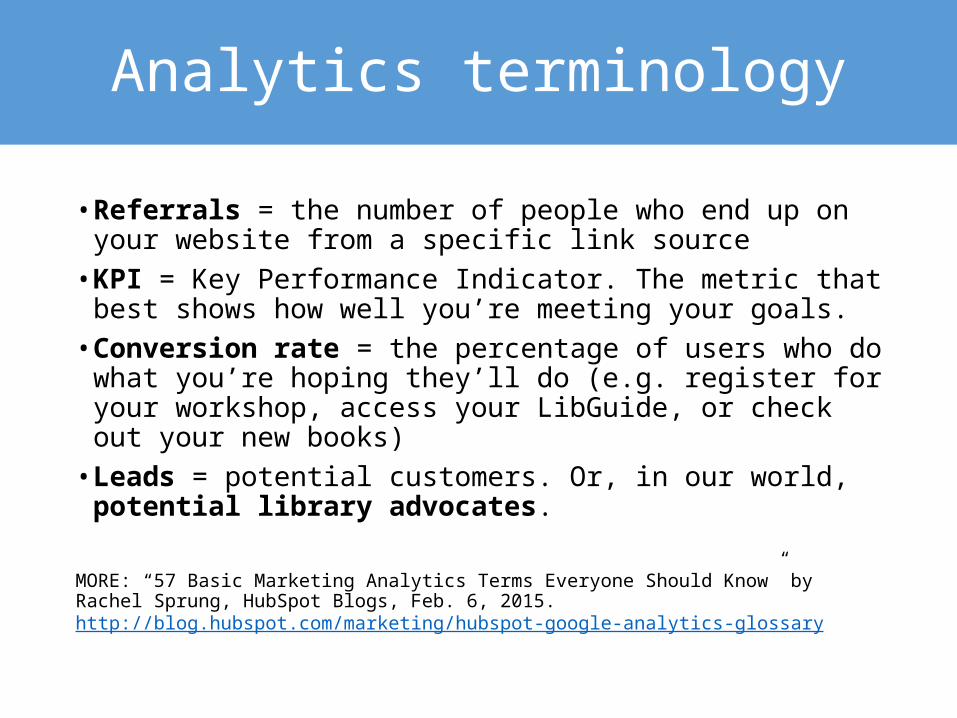
• Referrals = the number of people who end up on your website from a specific link source
• KPI = Key Performance Indicator. The metric that best shows how well you’re meeting your goals.
• Conversion rate = the percentage of users who do what you’re hoping they’ll do (e.g. register for your workshop, access your LibGuide, or check out your new books)
• Leads = potential customers. Or, in our world, potential library advocates.
MORE: “57 Basic Marketing Analytics Terms Everyone Should Know” by Rachel Sprung, HubSpot Blogs, Feb. 6, 2015. http://blog.hubspot.com/marketing/hubspot-google-analytics-glossary
Analytics terminology

SMART Goal MeasureDuring the 2015 fall semester, we will tweet four times per day using images and hashtags to increase our local following by 10%.
• Post frequency and timing• Follower interests• Follower growth• Follower locations
We will promote our services and events this month by making 2-3 Twitter and Facebook posts per week with links to each specific event or service.
• Engagement rates• Post frequency and timing• Reach• Referrals
We aim to see a 15% growth in referrals to our website from social media by tweeting digitized images and links 3-5 times per week during the 2015-2016 academic year.
• Website referrals• Post frequency and timing• Retweet rate
What’s your KPI?

Vanity Metrics
“Barbie Vanity” by deborah is lola CC BY-NC-SA 2.0 via Flickr. https://www.flickr.com/photos/deborah-is-lola/6352245598
• Follower counts• Raw numbers of
likes and shares• Hits• Page views• Visits• Time on site, etc.

Vanity Metrics
“Vanity metrics make you feel good, but they don’t offer clear guidance for what to do.”
-Eric Ries
“Barbie Vanity” by deborah is lola CC BY-NC-SA 2.0 via Flickr. https://www.flickr.com/photos/deborah-is-lola/6352245598

Market Research: Know Your Platforms
“Platform Nine and Three Quarters” by jillyspoon, CC-BY 2.0 via Flickr. https://www.flickr.com/photos/17516529@N00/10122995635

Adapt your message to
fit the platform’s
personality.

Who is out there?All Internet Users
18-29 30-49 50-640
20406080
100
Percentage by Age
18-29 30-49 50-640
20406080
100
Percentage by Age
Source: Maeve Duggan, et al. “Demographics of Key Social Networking Platforms.” Pew Research Center, January 9, 2015. http://www.pewinternet.org/2015/01/09/demographics-of-key-social-networking-platforms-2/
All Internet Users

Who is out there?All Internet Users
18-29 30-49 50-640
20406080
100
Percentage by Age
All Internet Users
18-29 30-49 50-640
20406080
100
Percentage by Age
Source: Irfan Ahmad, “#SocialMedia 2014: User Demographics For Facebook, Twitter, Instagram and Pinterest - #infographic” Digital Information World, October 13, 2014. http://www.digitalinformationworld.com/2014/10/social-media-user-demographics-linkedin-tumblr-facebook-and-more-infographic.html

Don’t count out the little guys.
Headline and left graph: http://techcrunch.com/2014/11/25/tumblr-overtakes-instagram-as-fastest-growing-social-platform-snapchat-is-the-fastest-growing-app/Right graph: Omar Akhtar, “Tumblr is the fastest growing social network of 2014,” The Hub, November 24, 2014.
http://www.thehubcomms.com/social-media/tumblr-is-the-fastest-growing-social-network-of-2014/article/385342/

How often to post?
Platform Frequency
Facebook 1-2 posts per dayPosting infrequently loses connection with your audience; posting more than twice per day is annoying.
Twitter 3-4 tweets per dayEngagement decreases after the third tweet.
Instagram 1-2 posts per dayBut there’s no drop in engagement if you post more.
Blogs 2 times per week“Companies that increase blogging from 3-5X/month to 6-8X/month almost double their leads.”
Source: Kevan Lee, “Infographic: How Often Should You Post on Social Media? See the Most Popular Research and Tips.” BufferSocial, February 25, 2015. https://blog.bufferapp.com/how-often-post-social-media

What time to post?
Platform Best Time Worst Time
Facebook 1:00 – 4:00 pm After 8:00 pm, before 8:00 am
Twitter 1:00 – 3:00 pm After 8:00 pm, before 9:00 am
Instagram 5:00 pm, 8:00 – 11:00 pm /12:00 – 4:00 am
Around 9:00 am and 6:00 pm
Tumblr 7:00 – 10:00 pm Before 4:00 pm
Pinterest Saturday mornings Monday-Friday, 8:00-5:00
Sources: Rachel Gillett, “The Best (and Worst) Times to Post on Social Media (Infographic).” FastCompany, Sept. 25, 2014. http://www.fastcompany.com/3036184/how-to-be-a-success-at-everything/the-best-and-worst-times-to-post-on-social-media-infograph; Damon Beres, “Here’s the Best Time to Post a Photo on Instagram,” The Huffington Post, Feb. 26, 2015. http://www.huffingtonpost.com/2015/02/25/get-instagram-likes_n_6751614.html
It depends on your audience!

Platforms with free, built-in analytics Platforms without free, built-in analytics
(paid only)
A few analytics for free, most for a fee
What can you track?

Where to find the data“Data” by aNto, CC BY-NC-SA 2.0 via Flickr. https://www.flickr.com/photos/dia-a-dia/7046151669

Facebook Insights

analytics.twitter.com

followerwonk.com

sumall.com

app.cyfe.com

iconosquare.com

Scheduling Apps

Google Analytics

Growth and Engagement
“First Tomato Seedling of 2010” by Chlot’s Run, CC BY-NC-SA 2.0 via Flickr. https://www.flickr.com/photos/chiotsrun/4472671089
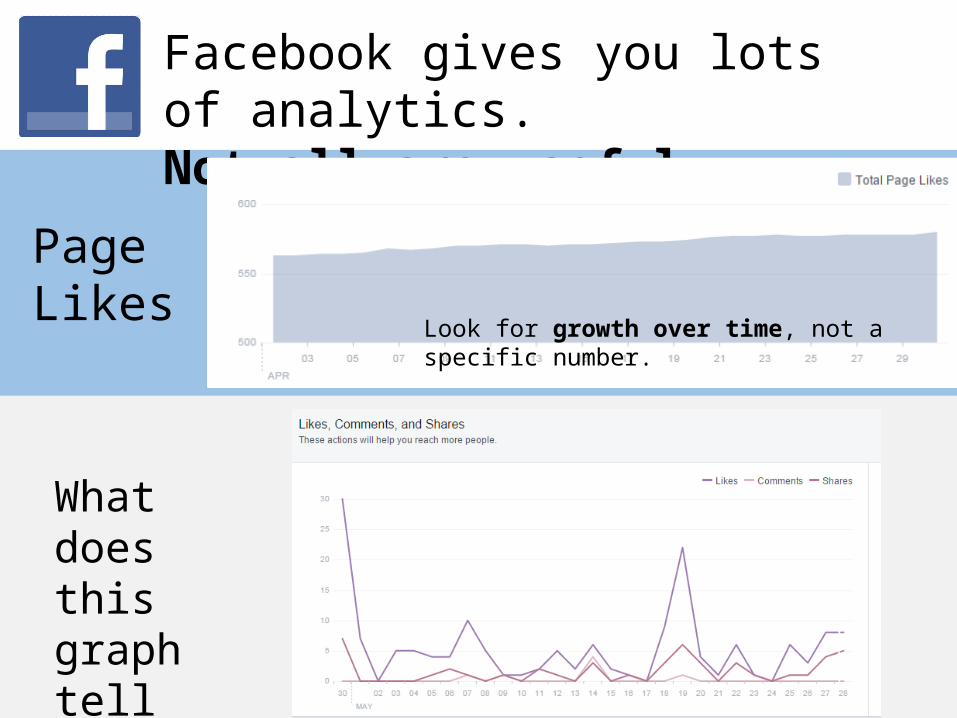
Facebook gives you lots of analytics. Not all are useful.
Look for growth over time, not a specific number.
PageLikes
What does this graph tell you?

Twitter gives you lots of analytics. They might be useful in context.
Is this good or bad?

Download your data and create your own tracking spreadsheet.

Understand Your Audience

Understand your audience:When and where

Understand your audience:Demographics
Conclusion: Facebook is not where we are reaching students.

Understand your audience:Are they on Twitter?

Understand your audience:Best times to post

Understand your audience:Location

Understand your audience:Interests

Understand your audience:Location and Interests


What do high-engagement tweets have in common?
Photos, meaningful hash tags, calls to action, and appeals to specific communities.

What are ingredients for reach and engagement?
Unique and shareable tidbits
Thought-provoking news articles
Local interests

Accept that you might not be able to increase your reach (unless you pay).

1.Where is your audience?2.When are they online?3.How often do you have time to post?4.Which platforms best fit your goals?