Embed Size (px)
Citation preview
Wnsdecisionpoint.com
Rethinking Customer Engagement in the Digital AgeDigitizing Customer Services in Utilities
11 Wnsdecisionpoint.com
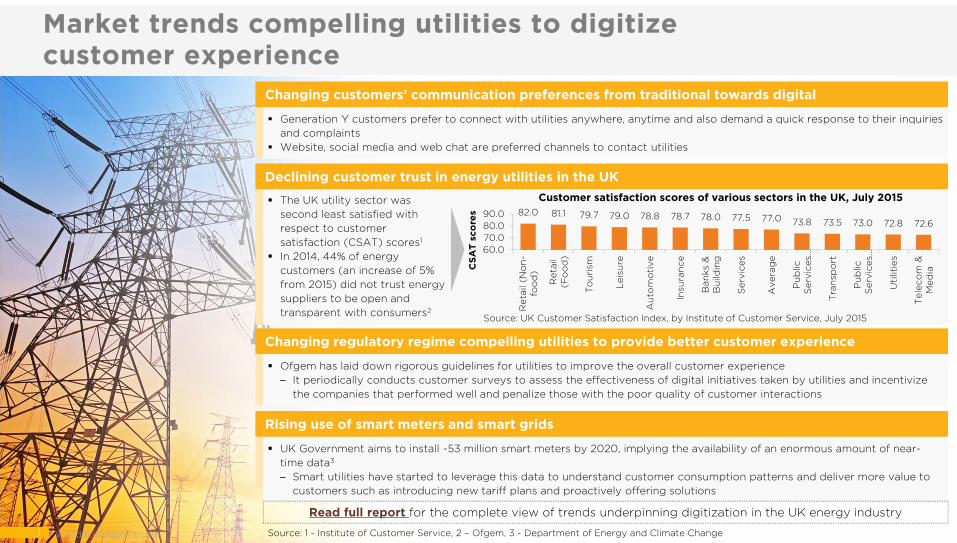
Changing customers’ communication preferences from traditional towards digital
Generation Y customers prefer to connect with utilities anywhere, anytime and also demand a quick response to their inquiries and complaints
Website, social media and web chat are preferred channels to contact utilities
Declining customer trust in energy utilities in the UK
Changing regulatory regime compelling utilities to provide better customer experience
Ofgem has laid down rigorous guidelines for utilities to improve the overall customer experience– It periodically conducts customer surveys to assess the effectiveness of digital initiatives taken by utilities and incentivize
the companies that performed well and penalize those with the poor quality of customer interactions
Rising use of smart meters and smart grids
UK Government aims to install ~53 million smart meters by 2020, implying the availability of an enormous amount of near-time data3
– Smart utilities have started to leverage this data to understand customer consumption patterns and deliver more value to customers such as introducing new tariff plans and proactively offering solutions
Source: 1 - Institute of Customer Service, 2 – Ofgem, 3 - Department of Energy and Climate Change
Read full report for the complete view of trends underpinning digitization in the UK energy industry
Market trends compelling utilities to digitize customer experience
1 Wnsdecisionpoint.com
The UK utility sector was second least satisfied with respect to customer satisfaction (CSAT) scores1
In 2014, 44% of energy customers (an increase of 5% from 2015) did not trust energy suppliers to be open and transparent with consumers2
82.0 81.1 79.7 79.0 78.8 78.7 78.0 77.5 77.0 73.8 73.5 73.0 72.8 72.6
60.070.080.090.0
Ret
ail (
No
n-
foo
d)
Ret
ail
(Fo
od
)
To
uri
sm
Lei
sure
Au
tom
oti
ve
Insu
ran
ce
Ban
ks &
Bu
ildin
g
Ser
vice
s
Ave
rag
e
Pu
blic
Ser
vice
s…
Tra
nsp
ort
Pu
blic
Ser
vice
s…
Uti
litie
s
Tel
eco
m &
Med
iaCSA
T sc
ore
s
Source: UK Customer Satisfaction Index, by Institute of Customer Service, July 2015
Customer satisfaction scores of various sectors in the UK, July 2015
22 Wnsdecisionpoint.com
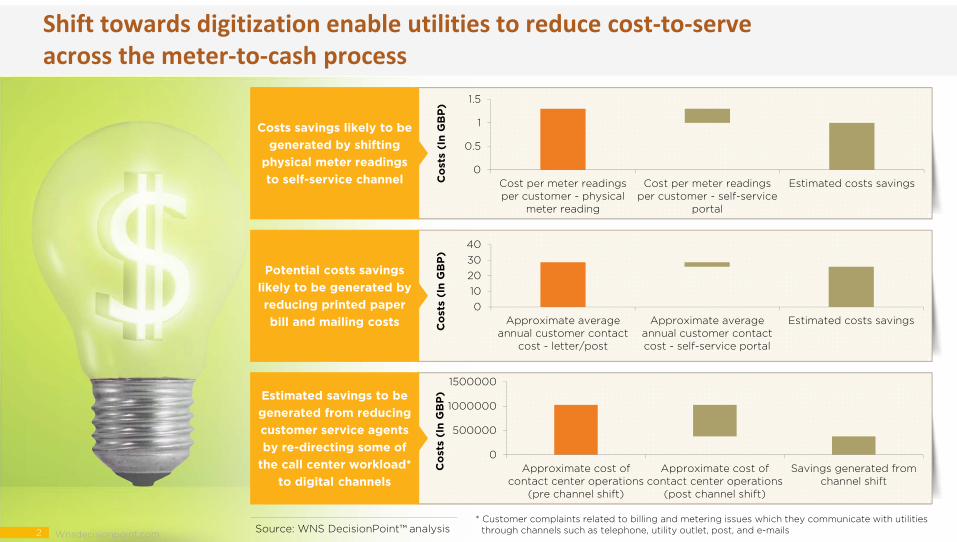
Shift towards digitization enable utilities to reduce cost‐to‐serve across the meter‐to‐cash process
Source: WNS DecisionPoint™ analysis* Customer complaints related to billing and metering issues which they communicate with utilities
through channels such as telephone, utility outlet, post, and e-mails2 Wnsdecisionpoint.com
0
0.5
1
1.5
Cost per meter readingsper customer - physical
meter reading
Cost per meter readingsper customer - self-service
portal
Estimated costs savingsCo
sts
(In
GB
P)
010203040
Approximate averageannual customer contact
cost - letter/post
Approximate averageannual customer contactcost - self-service portal
Estimated costs savingsCo
sts
(In
GB
P)
0
500000
1000000
1500000
Approximate cost ofcontact center operations
(pre channel shift)
Approximate cost ofcontact center operations
(post channel shift)
Savings generated fromchannel shift
Co
sts
(In
GB
P)
Costs savings likely to be generated by shifting
physical meter readings to self-service channel
Potential costs savings likely to be generated by reducing printed paper bill and mailing costs
Estimated savings to be generated from reducing customer service agents by re-directing some of
the call center workload* to digital channels
33 Wnsdecisionpoint.com
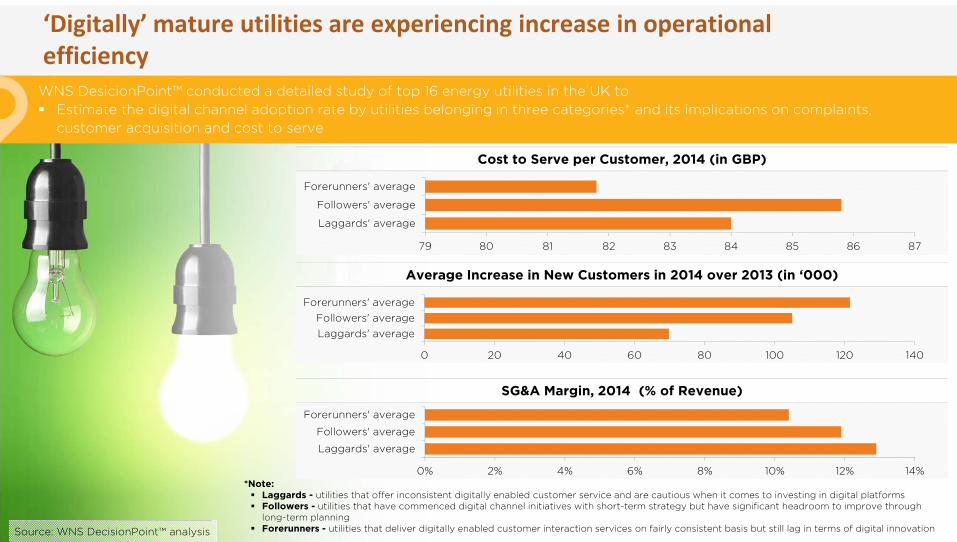
‘Digitally’ mature utilities are experiencing increase in operational efficiency
Source: WNS DecisionPoint™ analysis
0% 2% 4% 6% 8% 10% 12% 14%
Laggards' average
Followers' average
Forerunners' average
0 20 40 60 80 100 120 140
Laggards' averageFollowers' average
Forerunners' average
*Note: Laggards - utilities that offer inconsistent digitally enabled customer service and are cautious when it comes to investing in digital platforms Followers - utilities that have commenced digital channel initiatives with short-term strategy but have significant headroom to improve through
long-term planning Forerunners - utilities that deliver digitally enabled customer interaction services on fairly consistent basis but still lag in terms of digital innovation
WNS DesicionPoint™ conducted a detailed study of top 16 energy utilities in the UK to Estimate the digital channel adoption rate by utilities belonging in three categories* and its implications on complaints,
customer acquisition and cost to serve
79 80 81 82 83 84 85 86 87
Laggards' average
Followers' average
Forerunners' average
Cost to Serve per Customer, 2014 (in GBP)
Average Increase in New Customers in 2014 over 2013 (in ‘000)
SG&A Margin, 2014 (% of Revenue)
44 Wnsdecisionpoint.com
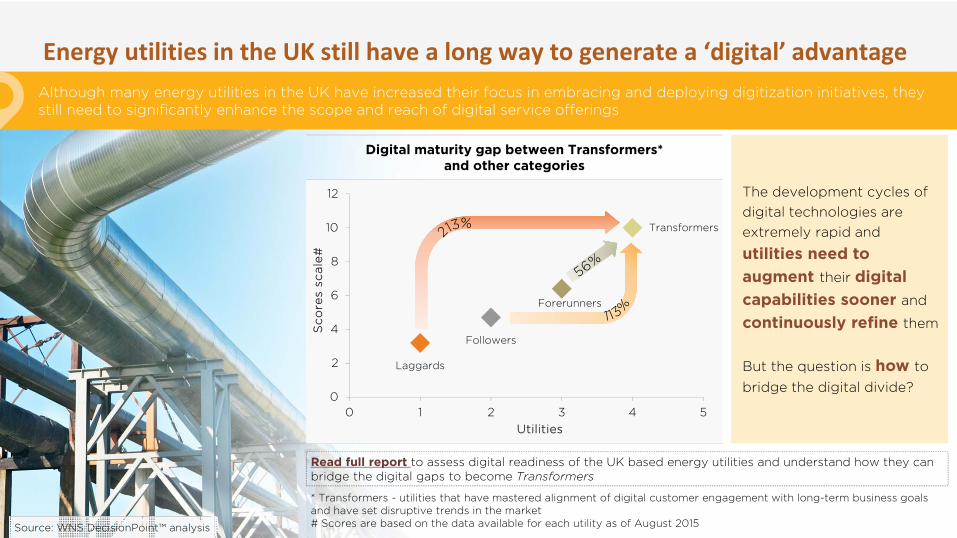
Energy utilities in the UK still have a long way to generate a ‘digital’ advantage
* Transformers - utilities that have mastered alignment of digital customer engagement with long-term business goals and have set disruptive trends in the market# Scores are based on the data available for each utility as of August 2015
The development cycles of digital technologies are extremely rapid and
utilities need to augment their digital capabilities sooner and
continuously refine them
But the question is how to bridge the digital divide?
Read full report to assess digital readiness of the UK based energy utilities and understand how they can bridge the digital gaps to become Transformers
Although many energy utilities in the UK have increased their focus in embracing and deploying digitization initiatives, theystill need to significantly enhance the scope and reach of digital service offerings
Laggards
Followers
Forerunners
Transformers
0
2
4
6
8
10
12
0 1 2 3 4 5
Source: WNS DecisionPoint™ analysis
Digital maturity gap between Transformers* and other categories
Utilities
Sco
res
scal
e#

55 Wnsdecisionpoint.com
A credible insights hub for companies looking to transform their strategies and operations by aligning with todays realities and tomorrow’s disruptions.
Email: [email protected]: wnsdecisionpoint.com
@WNSDecisionPt
WNS DecisionPoint
WNS DecisionPoint