Embed Size (px)
Citation preview

WHERE TEXT ANALYTICS MEETS GEOSCIENCE
Paul H Cleverley, Robert Gordon University Email: [email protected]
I presented some text analytics work at a recent GeoScienceWorld (GSW) meeting in New Mexico,
USA. GSW is a not-for-profit cooperation of Geological Societies, Associations & Institutes to
disseminate geoscience information. First, some information on the trip, then the analytics!
FIELD TRIP
The Geological Field Trip was to Santa Fe and Abiquiu areas approx. 7,000 Ft above sea level. To the
west across the Rio Grande Rift Basin are the Jemez Mountains (a super volcano) and the town of Los
Alamos (home of the Manhattan project). To the North is the Colorado Plateau and Ghost Ranch
where over 100 articulated skeletons of the Triassic Theropod Dinosaur Coelophysis have been found
(the state fossil of New Mexico). These would have stood about one metre tall at the hips and up to
three metres long.
The red cliffs at Chimney Rock contain Triassic deposits overlain unconformably by cross bedded
Jurassic desert sandstones topped with white limestone and gypsum in places. The beautiful scenery
of Chimney Rock can be seen in photo below:
The view from the top of Chimney Rock is even more breath-taking in the photo below.
ANALYTICS
There has been a continuing shift from just Information Retrieval (IR) systems - a search box and ten
blue links, to the search for patterns, through what is increasingly called ‘insight engines’ within the
cognitive computing paradigm. After all, big data is about small patterns.
All of the work below is approximately five days work and shows what is possible using some of the
techniques available today in a short space of time. I wrote scripts using Python and used OpenSource
utilities, these included some new techniques not published before. For the analytic content, I used
the Society of Economic Geology (SEG) text corpus (1905-2017) as an example focused on mining,
mainly of heavy metals. This consists of over 6,800 articles, 4.3 million lines of text and 35 million
words. Several examples of analytics techniques are shown below increasing in their sophistication.
1. Statistical Word Co-occurrence
The results of counting the frequency of terms and their adjacent associations are called n-grams. The
image below is a graph of nodes (unigrams) and edges (bigram associations) automatically generated
from the SEG text corpus of journals.
Click here to view a video showing how the text graph can be explored

Terms that have high authority (many links) can clearly be seen, along with rarer terms with few
associative links. This is one way to explore text in an easy and visual way which can be linked to
queries to the documents or contexts in which those words or associations occur.
These displays can be complemented by word clouds, with the most frequent associations stripped
down to reveal the ‘more interesting’. Previous research I performed with geoscientists indicated that
more frequent associations were ‘relevant but not interesting’. So stripping away the most frequent
may be desirable, hyperlinking every word so scientists can drill down into the articles and sentences
in which the associations are mentioned. The example below is for the search query ‘precambrian’.
Just as the Google n-gram viewer allows someone to explore word usage through time, similar
approaches can be taken with journals. The image below shows the trends of some common words in

the SEG text corpus over the past twenty years. The y-axis is normalized relative word frequency
(compared to total number of words used in that journal in that year).
For example, from the image above it is plain to see that the popularity of the terms ‘gold’ and
‘hydrothermal’ (frequency of occurrence) have increased over the past twenty years, whilst the terms
‘manganese’ and ‘metamorphic’ have decreased. The increase in popularity of ‘gold’ has been
theorized as possibly related to gold price which has also been plotted on this chart!
2. Simple Entity Extraction
Extracting entities from text and associating them to a spatial context and geological time period has
been of increasing interest to both academia and practice. The NSF EarthCube GeoDeepDive Cyber
Infrastructure is one such example with some fascinating findings related to stromatolite distribution
and sea water chemistry for example driven by patterns in text.
The example below shows the frequency of mentions (histogram in green) in SEG journal articles of
geological periods (including their constituent sub-divisions). A knowledge representation (taxonomy)
has been applied to the text in order to surface a pattern. This would appear to support a proposition
that over more than a hundred years, the focus for mining geologists has been the Pre-Cambrian and
Tertiary (Neogene and Paleocene) periods (denoted by the acronyms ‘PC’ and ‘T’ respectively) on the
y-axis. The Silurian period appears to have been of least interest.
Plotting the world-wide distribution of copper ore by Geological age (orange line) as a form of
‘control’, supports the theory that patterns in journal text may surface ‘real’ trends and phenomena
of interest.

3. Numerical Data Extraction
Another relatively common technique is to extract numerical integer and float data. The chart below
shows the results of automatically extracting integer and float data in association with the mnemonic
‘ppm’ (parts per million), plotting where it can be associated to a chemical element. The ppm data is
on the y-axis (logarithmic), with mentions on the x-axis (1,709 were found in total). This could be
turned into a hyper-linkable user interface, taking the user to the sentence/paragraph in question for
each data point. This type of extraction is quite trivial although potentially under-used by
organizations despite much of these data not necessarily being stored in structured databases.
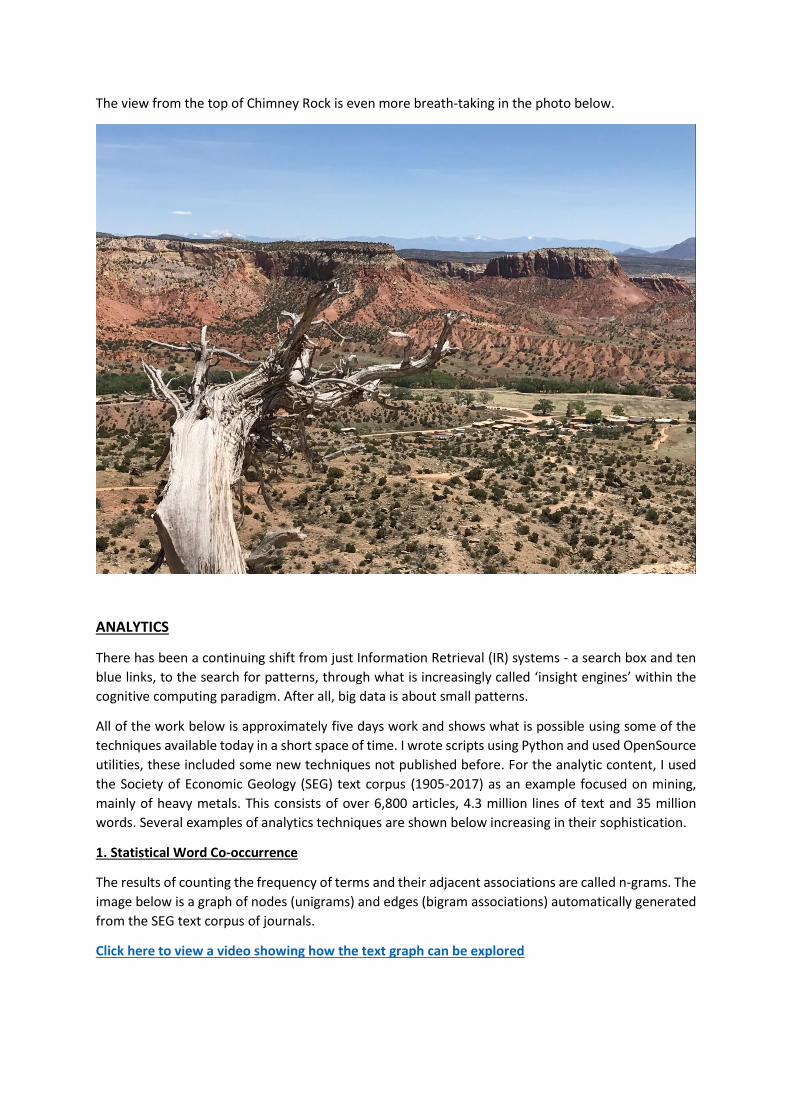
Another common technique is entity-entity matrices, showing how common two entities occur
together in the same sentence or equivalent semantic text unit. The example below shows lithology
and minerals for the SEG corpus.
The associations are clustered using least squares to group similar lithology and mineral associations.
You may just be able to pick out ‘Diamond’ on the middle right and its strongest association to Breccia
and Conglomerate. These displays may reveal surprising associations worth of further exploration and
are used extensively in biomedical for tasks such as gene discovery.
4. Geo-Sentiment
Looking at individual geological formation names as they appear in text, it may be possible to derive
‘sentiment’ and ‘subjectivity’ of the formation. Using Part of Speech (POS) tagging, nouns that occur
before the phrase ‘Formation’ or ‘Fm’ for example, can be extracted.
The cross-plot below shows some Formation names that appear around the search query term
‘leaching’. Polarity is on the x-axis, denoting how the Formation is perceived, negative (-1) versus a
positive (+1) light. This is achieved by analysing the words (using Bayesian Statistical algorithms) that
co-occur with the geological Formation mentions in text. Simplifying, terms such as ‘good’, ‘surprising’
and ‘abundance’ area deemed as ‘positive’ whereas terms such as ‘poor’, ‘error’ and ‘problem’ are
deemed as negative. On the y-axis is subjectivity, from objective (0) to subjective (1). Terms such as
‘strongly suggest’ and ‘by far’ being indicative of subjective views. Standard sentiment algorithms
cannot be used with accuracy on geoscience content, as the everyday terms ‘old’, ‘fault’ and ‘thick’
for example, which can be used in social media to denote negative views, are not negative in a
geoscience sense!

From these data, the Citronelle Formation appears in a negative light that may stimulate the scientist
to investigate the sentences (context) which may lead to a learning event. Conversely, the high
‘subjectivity’ of the Popovich Formation may also trigger curiosity to understand the context which
may lead to a re-interpretation.
5. Automatic Geo-coding
Geo-referencing journal articles is not a new technique. However, in many cases it is the entire journal
article (or just images within the article) that is referenced. In essence it is a summary of ‘aboutness’.
The map below shows ‘mentions’ of the search query term concept ‘precambrian’ in the full text (body
text) of all articles in the SEG corpus where they can be automatically geo-located. Comparing to
techniques that only use keywords and/or abstracts of the journal article (the ‘information container’),
there is a 200% enhancement (increase) of geo-locations. Clicking on the locations to show the
‘mentions’, the sentence or paragraphs in which the query term concept is mentioned, may yield
insights that simply geo-locating entire journal articles cannot.

Instead of colour coding the frequency of occurrence by colour, bubble plots can be used, where the
size of the bubble relates to the frequency of mention. This can also be combined with external data
to the text corpus. An example is shown below integrating with the surface geology on the United
States using US Geological Survey (USGS) WMS GIS spatial data.
More granular geo-coding is simply a case of adding in more specific lookup lists for latitude and
longitude of any entity.
6. Topics
Another common technique to ‘summarize’ the essence of what ‘lies beneath’ in text, relies on a range
of techniques from complex word co-occurrence patterns, Principal Component Analysis (PCA) to
Eigen Values and Vectors. The image below shows the clusters of topics for the search query ‘leaching’
in the SEG text corpus. These techniques can be applied at any level of granularity, on an abstract, a
single article, a whole corpus or as a delta between journals or corpora. Topic modelling is typically
applied longitudinally (through time) to surface changes in the intent behind text.

7. Mathematical Word Vectors and Hypothesis Testing
The word co-occurrence patterns of any entity can be converted into a mathematical vector and the
similarity compared with one another. From literature reviews, these techniques have been applied
more sparsely/largely non-existent within the geoscience discipline compared to simple entity
extraction and association.
The cross-plot below shows geological periods in the SEG corpus plotted to their similarity to the word
vector of ‘volcanics’ on the x-axis and ‘limestone’ on the y-axis. In the bottom right, the Pre-Cambrian
Archean period (2-4 Billion years ago largely before life on earth) is very similar to ‘volcanics’ and not
‘limestone’ which is what you would expect. Conversely, the Mississippian (top middle) is very similar
to ‘limestone’ and not ‘volcanics’ which is what you would expect as sea level was very high with warm
shallow seas. So again, this supports the theory that word vectors from text can surface real word
patterns that make sense. Perhaps they can also reveal what we don’t yet know.

A variation of this technique which it is believed may have never been tried before in the Geosciences,
is combining data from a database, with word vector information. In the cross-plot below, US states
(e.g. Florida, Wyoming, Oregon) are plotted by their annual rainfall on the y-axis (from the National
Oceanic and Atmospheric Administration (NOAA) database) and their similarity to the word vector
‘Arsenic’ in the SEG corpus on the x-axis. A weak correlation (R2=0.26) is found, implying more
similarity to the word vector ‘Arsenic’ with decreasing rainfall. Simplistically, this could be due to more
arid environments (less rainfall) leading to higher Ph conditions with Arsenic more likely to mobilise
from the underlying geology into groundwater and aquifers.
This could point to the potential value of combining word vector similarities from text with traditional
measured data stored in structured databases. The whole may be greater than the sum of the parts.
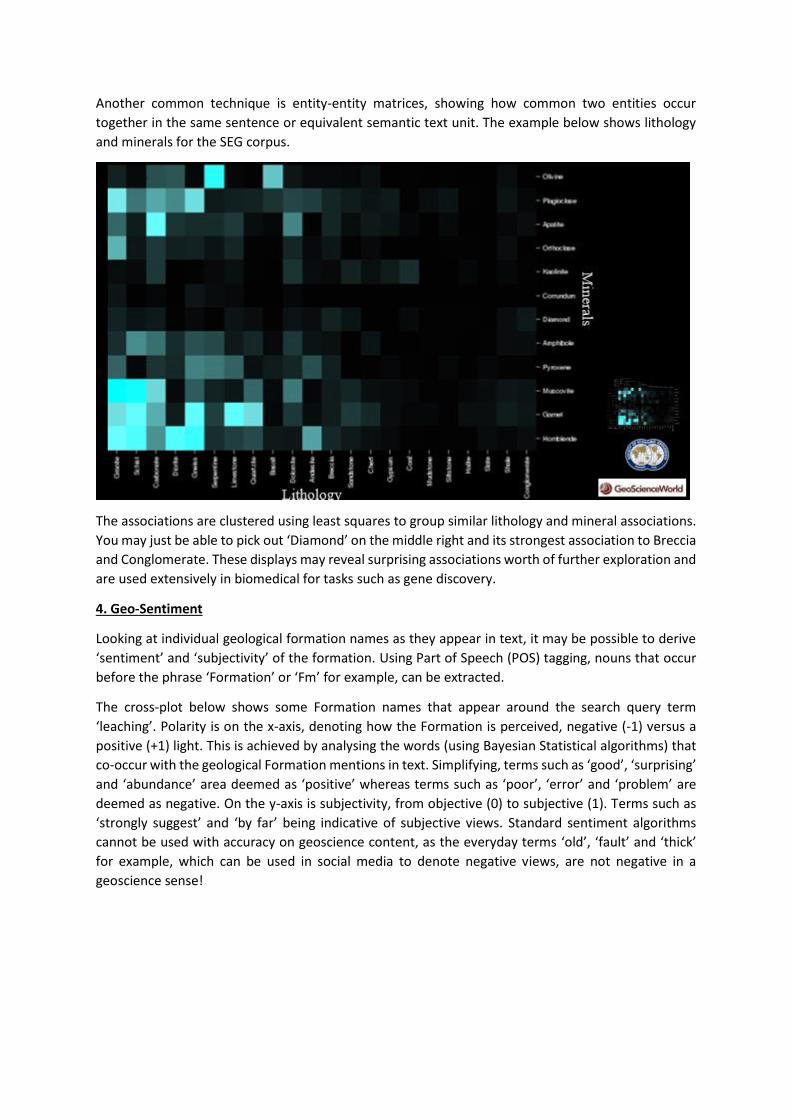
A final example integrates data from the US National Cancer Database (CNC), Alzheimer’s Association
and again, text vectors from the SEG corpus. The average cancer mortality rate per US state (per
100,000 people) is plotted on the x-axis, the average Alzheimer’s mortality rate per US state is plotted
on the y-axis. The similarity of US state word vectors to the heavy metal ‘Cadmium’ word vector is
shown by the colour and size of marker. The more similar, the larger the circle. Those above average
similarity in the sample are coloured orange, below average are coloured blue. There is no statistically
significant correlation and even if there was, correlation is of course not causation. There are many
demographic and socio-economic factors at play in a complex system. However, these techniques may
be useful in surfacing patterns that warrant further investigation or hypothesis testing.
8. Automated Discovery
The final example compares the linkage between the word vector of every concept in the corpus, with
the word vector of every other concept in the corpus and their similarity to the word vectors of a
hypothesized theme. In the example below, the theme are elements typically associated with
geogenesis (natural) contamination in groundwater (e.g. Aluminium, Iron, Copper, Mercury, Lead).
A new simple ratio has been developed (Cleverley 2017) by combining linear regression with a scaling
factor to represent the individual similarity of the concept(s) to the theme, to surface potentially the
‘unusual’ associations which may warrant further discovery. In the run below, over 150Million word
vector combinations were tested by an automated algorithm. This took four hours on a standard
laptop.

For example, ‘Argon dating’ and ‘Feldspar Chlorite’ as individual concepts, do not have high similarity
to the theme. However, as an association, they have a disproportionately higher correlation than one
would expect, which may warrant further exploration to identify a causal mechanism.
Just as Swanson (1988) manually identified (inferred) a link between magnesium deficiency and
migranes, that was not present in any single article, but they shared similar concepts, these automated
techniques could highlight new associations. This could lead to new knowledge and ultimately, new
scientific discoveries that are hidden amongst our text in plain sight.
Knowledge is socially constructed and different text copora will likely lead to different word vectors
for the same concepts depending on the sub-discipline and nature of the text. These differences may
also surface clues to new phenomena of interest.
Based on literature reviews, the use of word vector similarities of entities with external data is
potentially under-utilized in the geosciences. Future work will most likely expand the research to apply
to much larger quantities of journals and further develop automated approaches. Questions,
comments and ideas are always welcome, feel free to contact me on the email below.
Paul Cleverley PhD
Researcher
Robert Gordon University
Email: [email protected]
Blog: www.paulhcleverley.com
References