Embed Size (px)
Citation preview

RETURN INTERVAL DISTRIBUTION OF
EXTREME EVENTS IN LONG MEMORY TIME
SERIES WITH TWO DIFFERENT SCALING
EXPONENTS
A thesis submitted towards partial fulfillment of
BS-MS dual degree program
by
Smrati Kumar Katiyar
(20061015)
Under the guidance of
Dr. M S Santhanam
(Assistant Professor,IISER pune)
to the
DEPARTMENT OF MATHEMATICS
INDIAN INSTITUTE OF
SCIENCE EDUCATION AND RESEARCH
PUNE - 411008
APRIL 2011

CERTIFICATE
This is to certify that this dissertation entitled “RETURN INTERVAL
DISTRIBUTION OF EXTREME EVENTS IN LONG MEMORY
TIME SERIESWITH TWODIFFERENT SCALING EXPONENTS
towards the partial fulfillment of the BS-MS dual degree programme at the
Indian Institute of Science Education and Research Pune, represents origi-
nal research carried out by Smrati Kumar Katiyar(20061015), at IISER,
pune under the supervision of Dr. M S Santhanam(Assistant Professor)
during the academic year 2010-2011.
Name and signature of the student
Supervisor.........................................
(Dr. M S Santhanam)
Head (Mathematical sciences)........................
(Dr. Rama Mishra)
Date:
place:
1

Acknowledgement
I would like to thank my project guide Dr. M S Santhanam for his con-
tinuous help in my project He always listened to me and gave his continuous
advice to clarify my doubts.
2

Abstract
Many processes in nature and society show long memory. In recent years
research towards the return intervals of extreme events has picked a signif-
icant pace due to its practical application in several different fields ranging
from geophysics,medical sciences,computer science to finance and economics.
Earlier results on the return interval distribution of extreme events for long
memory process with single scaling exponent have shown that the distribu-
tion is a product of power law and stretched exponential function. In this
report, we have obtained an analytical expression for the return interval dis-
tribution of long memory processes with two different scaling exponents. We
also provide numerical simulations to support our analytical results.
3

Contents
1 Introduction 5
2 Long memory process 9
3 Return interval distribution of long memory process with
two scaling exponents 13
4 Simulation results 20
5 Long memory probability process with two scaling expo-
nents 27
6 Conclusion 32
4

Chapter 1
Introduction
Study of extreme events is an active area of research presently for its inher-
ent scientific value and its practical application to diverse fields ranging from
medical sciences, geophysics, computer science to economics and finance[1][2].
The consequences of extreme events such as earth quakes or cyclones are
generally catastrophic to human society. Hence the study of extreme events
assume special significance. For instance, in the field of geoscience it could
help us in the prediction of next earthquake. In the field of finance these
kind of studies can help us to make better prediction about market crashes.
Several natural and socio-economic phenomenon such as atmospheric pres-
sure, temperature, volatility etc. show long term memory and hence it is
relevant to study the return interval distribution of extreme events for long
memory processes. Time series which show power law type autocorrelation
function1[3] with very slow decay in correlation for large lags, as compared
to other uncorrelated processes, generally represent long memory processes.
1Autocorrelation function(ρk) for a given time series x(t) at lag k is defined as
ρk =∑
n
t=k+1(xt−x)(xt−k−x)
∑n
t=1(xt−x)2 for k = 1, 2, ..
5

Let x(t) be a given time series such that 〈x〉 = 0, all those events for which
x(t) > q will be called extreme events. q is the threshold value.
0 20 40 60 80 100t
-4
-3
-2
-1
0
1
2
3
x(t)
threshold
r1 r2 r3
Figure 1.1: a schematic diagram shows the return intervals for a threshold
value q=1.5 as a function of time t
The return interval r is defined as the time interval between the consec-
utive extreme events. So we will get a series of return intervals rk , k =
1, 2, 3, ....., N
For uncorrelated processes the return interval distribution is[1]
P (R) = e−R. (1.1)
For long memory process autocorrelation function is ρk ∼ k−γ, where 0 <
γ < 1 and return interval distribution of extreme events is [8]
P (r) = ar−(1−γ)e−(aγ)rγ . (1.2)
6

In this a is a constant to be determined from normalisation condition. The
result in Eq. 1.2 is obtained for a long memory time series with one scaling
exponent. What happens to time series with more than one scaling exponent
(one of the example for such time series is high frequency financial data) ?
Figure 1.2 shows one of such case.
Figure 1.2: Log log plot of fluctuation function F (τ) of log returns for the
high-frequency data of the S and P 500 stock index, circles represent actual
data, line represents linear fitting. (figure taken from Podobnik et al [10])
Figure 1.3(a) and 1.3(b) shows a comparison between time series with one
scaling exponent and two scaling exponents based on fluctuation analysis (Ex.
DFA, R/S analysis)[4][5].In these figures x-axis represents time scale n and
y-axis F (n) represents averaged fluctuation function. The core of this report
will address this problem and provide analytical and numerical solutions to
it. In chapter 2, we will present a detailed study of a model for long memory
7

0 0.2 0.4 0.6 0.8 1ln n
0
0.2
0.4
0.6
0.8
1
ln F
(n)
(a) One scaling exponent
0 0.2 0.4 0.6 0.8 1ln n
0
0.2
0.4
0.6
0.8
1
ln F
(n)
(b) Two scaling exponent
Figure 1.3: Fluctuation analysis of time series
process. Using a variant of this model, we generate time series with long
memory and two time scales. Chapter 3 will be dedicated to the analytical
solution for return interval distribution while in chapter 4 we will present a
numerical solution. In chapter 5 we will present long memory probability
process whose return intervals are uncorrelated and compare the analytical
results with the numerically simulated data. In chapter 6 we will discuss our
analytical and numerical results and also discuss some practical limitations
of our results.
8

Chapter 2
Long memory process
The plot of sample autocorrelation function (ACF) (ρk) against lag k is one
of the most useful tool to analyse a given time series. If the ACF tends to
zero after some lag k, then the traditional stationary ARMA process[3] are
good enough to describe the time series. However if the ACF decays slowly,
it means that even after very large lags the value of ACF is sufficiently large
and describing the time series with traditional ARMA models will result in
excessive number of parameters.
So how we can describe these kind of processes ?
The answer is “long memory process ”. Formally, “a stationary process will
have long memory, if its autocorrelation function can be represented as
ρk → Cρk−γ as k → ∞ (2.1)
where Cρ > 0 and γ ∈ (0, 1)
ARFIMA process introduced by Granger and Joyex in 1980 are known
to be capable of modelling long memory processes. The general form of
9

0 10 20 30 40 50 60
0.0
0.2
0.4
0.6
0.8
1.0
Lag
AC
FSeries a
Figure 2.1: Autocorrelation function for a long memory process
ARFIMA model of order (p, d, q) is [7]
φ(B)(1−B)dxt = θ(b)at. (2.2)
This equation can also be written as
(1− B)dxt =θ(B)atφ(B)
.
In equation(2.2), d is the differencing parameter and it is a fraction, xt is
the original time series, B is the backshift operator defined as Bxt = xt−1 ,
B2xt = xt−2 and so on..
In this, φ(B) is the autoregressive operator
φ(B) = 1− φ1B − φ2B2 − ................φpB
p,
θ(B) is the moving average operator
θ(B) = 1 + θ1B + θ2B2 + ................θqB
q,
10

and at is the white noise with zero mean and variance σ2.
at ∼WN(0, σ2).
Now for further discussion of ARFIMA process we will consider that p
and q are both zero. So the Eq. (2.2) will become
(1− B)dxt = at, (2.3)
which is known as fractionally differenced white noise (FDWN). Equation(2.3)
can also be written as
xt = (1−B)−dat. (2.4)
We will discuss both Eqs. (2.3) and (2.4) later. First we start with equation
(2.3)
(1− B)dxt = at.
We can represent fractionally differenced white noise (FDWN) as an infinite
order autoregressive process
xt =
∞∑
k=0
πkxt−k + at.
Using the binomial expansion we can write
(1−B)d = {1− dB +d(d− 1)B2
2!−d(d− 1)(d− 2)B3
3!+ ...............}. (2.5)
Equation(2.5) can also be represented in terms of Hypergeometric function
(1− B)d =
∞∑
k=0
Γ(k − d)Bk
Γ(k + 1)Γ(−d). (2.6)
Using equation(2.6) we can calculate the value of πk
πk =Γ(k − d)
Γ(−d)Γ(k + 1). (2.7)
11

Similarly we can also represent FDWN as an infinite order moving average
process (2.4).
xt = (1− B)−dat (2.8)
=∞∑
k=0
ψkat−k
(1−B)−d = {1+dB+d(d− 1)B2
2!+d(d− 1)(d− 2)B3
3!+ .................} (2.9)
(1− B)−d =
∞∑
k=0
Γ(k + d)
Γ(d)Γ(k + 1)Bk (2.10)
Using above equation we can calculate the value of ψk
ψk =Γ(k + d)
Γ(d)Γ(k + 1). (2.11)
Based on the results derived by Granger(1980) the autocorrelation function
of Fractional white noise is
ρk =Γ(k + d)Γ(1− d)
Γ(k − d+ 1)Γ(d). (2.12)
For large value of k, this can be approximated as
ρk =Γ(1− d)
Γ(d)k2d−1. (2.13)
As we have already mentioned the main characteristic of Long memory pro-
cess is that autocorrelations ρk at very long lags are nonzero and hence∞∑
k=−∞
|ρk| = ∞ (2.14)
Now using equation(2.13) and (2.14) we obtain
−1 < 2d− 1 < 0 =⇒ d ∈ (0, 0.5).
In this section we have seen the formal definition of long memory time se-
ries, mathematical model to represent the long memory time series and their
properties.
12

Chapter 3
Return interval distribution of
long memory process with two
scaling exponents
We consider long memory time series with two different scaling exponents.
Detrended fluctuation analysis [5][4] is one of the most widely used techniques
to identify the presence of long memory in a given time series. In Figure 3.1,
we show the fluctuation function. It displays two different slopes α1 and α2.
These slopes are known as DFA exponent. DFA exponent α is related to
autocorrelation exponent γ (used in equation(2.1)) according to the relation
given in equation (3.1).[9]
γ = 2− 2α (3.1)
In Figure(3.1), the x−axis represents time scale n and y−axis F (n) rep-
resents averaged fluctuation function. We can also see a crossover location
where scaling exponent changes. Our probability model is the statment that
13

0 1 2 3 4 5 6log (n)
0
1
2
3
4lo
g F(
n)
DFA analysis of time series
crossover r
egion
Figure 3.1: DFA figure for time series with two scaling exponent
for a stationary gaussian process with long memory, given an extreme evant
at time t = 0, the probability to find an extreme event at t = r is given by
Pex(r) =
a1r−(2α1−1) = a1r
−(1−γ1) for 0 < r < nx
a2r−(2α2−1) = a2r
−(1−γ2) for nx < r <∞
(3.2)
where 0.5 < α1, α2 < 1 are DFA exponents and 0 < γ1, γ2 < 1 , a1, a2 are
normalization constant which we will fix later. According to Equation(3.2)
after an extreme event it is highly probable to expect the next event to be
an extreme one too; and this is a resonable result for long memory persis-
tent time series. After every extreme event one resets the time to zero and
process starts again, independent of previous return interval(actually it is
an assumption as we will further see during our numerical simulations that
even return intervals have long memory).The range of γ is such that after a
finite return intervals the process will stop. Next we will calculate, given an
14

extreme event at t = 0, what will be the probability such that there is no
extreme event in the interval (0, r). To calculate this, we will first divide the
interval r into m subintervals indexed by j = 0, 1, 2, 3, .....(m− 1) and then
we calculate the probability in each subinterval. We have two cases, case(1)
is that when r ∈ (0, nx) and in case(2) r ∈ (nx,∞)
For case(1): 0 < r < nx
Here for the jth subinterval,the probability of extreme event is given by
(using Trapezoidal rule for integration[12])
h1(j) =a1r
m((j + 1)r
m)−(1−γ1) +
a1r
2m[(jr
m)−(1−γ1) − (
(j + 1)r
m)−(1−γ1)] (3.3)
after simplying this expression,the probability that no extreme event occurs
in the jth subinterval is given by
1− h1(j) = 1−a1r
2m(r
m)−(1−γ1)[(j + 1)−(1−γ1) + j−(1−γ1)] (3.4)
so probability of no extreme event in (0, r)
Pnoex(r) = limm→∞
m−1∏
j=0
(1− h1(j)) (3.5)
we require the probability P (r)dr that given an extreme event at t = 0, no
extreme event occurs in (0, r) and an extreme event occur in the infinitismal
interval r + dr. This will be simply the product of Pnoex(r) with the proba-
bility Pex(r). This can be wirtten as
P (r)dr = Pnoex(r)Pex(r)dr (3.6)
= limm→∞
[1− φ1][1 − φ1(2−(1−γ1) + 1)]
15

×[1 − φ1(3−(1−γ1) + 2−(1−γ1))]..........
×[1 − φ1(m−(1−γ1) + (m− 1)−(1−γ1))]a1r
−(1−γ1)dr (3.7)
where φ1 =a12[r
m]γ1
The value of m can be extremely large and equation(3.7) can be written in
a simplified form as
P (r)dr = limm→∞
exp[−a12(r
m)γ1{2Hγ1−1
m−1 +m−(1−γ1)}]a1r−(1−γ1)dr (3.8)
Where H(γ1−1)m−1 is the generalized Harmonic number[11]. When we take the
limit m→ ∞, we get
limm→∞
Hγ1−1m−1
mγ1=
1
γ1, 0 < γ1 < 1. (3.9)
Using equation (3.8) and (3.9) we obtain the following results for return
interval distribution
P (r)dr = a1r−(1−γ1)e−(a1/γ1)rγ1dr (3.10)
For case(2) : nx < r <∞
Now in case(2) we will again follow the same kind of procedure that we
have followed earlier to solve our problem in case (1) but the difference will
start coming into the picture from equation (3.5) onwards. As we recall
equation(3.5) is:
Pnoex(r) = limm→∞
m−1∏
j=0
(1− h1(j)).
16

But now r is of length greater than nx. Hence in place of equation(3.5) we
have to use a new equation which reflects the problem that we are trying to
solve in case(2). Now, the correct equation will be
Pnoex(r) = limm→∞
[
λ∏
j=0
(1− h1(j))
m−1∏
j=λ+1
(1− h2(j))] (3.11)
where,
1− h1(j) = 1−a1r
2m(r
m)−(1−γ1)[(j + 1)−(1−γ1) + j−(1−γ1)]
and
1− h2(j) = 1−a2r
2m(r
m)−(1−γ2)[(j + 1)−(1−γ2) + j−(1−γ2)]
We require the probability P (r)dr that given an extreme event at t = 0,no
extreme event occurs in (0, r) and an extreme event occur in the infinitismal
interval r+dr. this will be simply the product of Pnoex(r) with the probability
Pex(r). This can be written as
P (r)dr = Pnoex(r)Pex(r)dr (3.12)
now use equation(3.11) and equation(3.2) we can write equation(3.12) as
P (r)dr = limm→∞
[(1− h1(0))(1− h1(1))....(1− h1(λ))
×(1 − h2(λ+ 1))(1− h2(λ+ 2))....(1− h2(m− 1))]
×(a2r−(1−γ2))dr (3.13)
equation(3.13) can also be written as:
P (r)dr = limm→∞
[[(1− h1(0))(1− h1(1)).....(1− h1(λ))]
17

×[(1 − h2(0))(1− h2(1))....(1− h2(λ))....(1− h2(m− 1))]
[(1− h2(0))(1− h2(1))....(1− h2(λ))]
×a2r−(1−γ2)dr
which is equivalent to writing:
P (r)dr = C limm→∞
[m−1∏
j=0
(1− h2(j))]a2r−(1−γ2)dr (3.14)
where C is:
C = limm→∞
[(1− h1(0))(1− h1(1))....(1− h1(λ))]
[(1− h2(0))(1− h2(1))....(1− h2(λ))](3.15)
repeating the same kind of calculations that we have done for case(1) we can
write:
P (r)dr = C limm→∞
exp[
−a22(r
m)γ2{2Hγ2−1
m−1 +m−(1−γ2)}]
a2r−(1−γ2)dr (3.16)
again using equation(3.9) we can show that:
P (r)dr = Ca2r−(1−γ2)e−(a2/γ2)rγ2dr (3.17)
So final results for return interval distribution for extreme events are
P (r) =
(a1r−(1−γ1)e−(a1/γ1)rγ1 ) for 0 < r < nx
Ca2r−(1−γ2)e−(a2/γ2)rγ2 for nx < r <∞
(3.18)
In equation(3.18) there are three unknowns a1,a2 and C. To solve for these
values we can use three equations. First of this is the normalization equation:
∫
∞
0
P (r)dr = 1. (3.19)
We will get second equation by normalizing 〈r〉 to unity
∫
∞
0
rP (r)dr = 1 (3.20)
18

and the third equation will be obtained using continuity condition for equation(3.2)
a1r−(1−γ1) = a2r
−(1−γ2) at r = nx
a1n−(1−γ1)x = a2n
−(1−γ2)x
(3.21)
now using all three equations given above, we can find values of a1,a2 and C
in terms of γ1,γ2 and nx
using equation(3.19):∫
∞
0
P (r)dr =
∫ nx
0
a1r−(1−γ1)e−(a1/γ1)rγ1dr+
∫
∞
nx
Ca2r−(1−γ2)e−(a2/γ2)rγ2dr = 1
This integral can be done by substituting t = e−(a1/γ1)rγ1 . This leads to a
simple equation
Ce−(a2/γ2)nγ2x = e−(a1/γ1)n
γ1x . (3.22)
using equation(3.20):∫
∞
0
rP (r)dr =
∫ nx
0
ra1r−(1−γ1)e−(a1/γ1)rγ1dr+C
∫
∞
nx
ra2r−(1−γ2)e−(a2/γ2)rγ2dr = 1
to solve the above integral we should use integration by parts, after a very
lengthy solving we will end up with not so pretty equation given below:
C(γ2/a2)1/γ2
nxE γ2−1
γ2
(nγ2x )
γ2− (γ1/a1)
1/γ1nxE γ1−1
γ1
(nγ1x )
γ1= 1 (3.23)
Here En(x) =∫
∞
1e−xt
tndt =
∫ 1
0e−x/ηη(n−2)dη
En(x) is known as exponential integral function.
Now using equation(3.21), (3.22) and (3.23), we can solve for values of
a1 ,a2 and C. Since there are three variables and three equations we can get
analytical solutions, but the form of equations is very complex. Hence, we
prefer to solve them numerically. Hence with the known values of γ1, γ2 and
nx, we can obtain the corresponding values of a1,a2 and C.
19

Chapter 4
Simulation results
In previous chapter, we have solved our problem of return interval distri-
bution analytically. To support those analytical results we would like to
mention a model which will artificially generate a time series with different
scaling exponents. The main idea behind this model is based on the discus-
sions presented in in chapter(2)
Before describing our model we would like to mention that there are variety
of models proposed to generate time series with two different exponents [10].
Quite similar to these other models, we also use use fractional differencing
concept.
What we needed in our project work was the return interval distribution of
time series, so our main focus is on return intervals, not on the time series.
So we compromise just a bit with the model to generate time series within
our specific needs.
Model described by Boris Podobnik[10] was taking almost sixteen hours to
complete one simulation and if we want to generate an ensemble of hundred
time series, it will take a really long time and hence it will be computationally
20

very expensive. Hence we will use a different model which takes significantly
less time and also generates time series with two different scaling exponents.
Next we will discuss the model that we have used to generate the time series.
Step 1:
set the length of time series, say, l = 105.
Step 2:
generate a series of random numbers yi i = 0......(l−1) which follow gaussian
distribution with mean 0 and variance 1
Step 3:
generate a series of coefficients defined as:
Cαi =
Γ(i− α)
Γ(−α)Γ(i+ 1)= −
α
Γ(1− α)
Γ(i− α)
Γ(i+ 1)
α =
α1 for 0 < r < nx
α2 for nx < r <∞
(4.1)
Both α1 and α2 belong to the interval (−0.5, 0)
The asymptotic behaviour of Cαi for large i can be written as
Cαi ≃ −
α
Γ(1 − α)i−(1+α) for i≫ 1
Step 4:
Now, get a series yαi using yi and Cαi according to the relation
yαi =
i∑
j=0
yi−jCαj i = 0.....(l − 1) (4.2)
When we do DFA on the series yαi , we will obtain the figure given below
which shows that the generated time series has two DFA exponent (two
21

different scaling exponent). This was the desired characteristic for the time
series that we want to generate. So for the model described above according
to equation(4.2) if we put nx = 30 and use two different values of α let
say α1 (for 0 ≤ i ≤ nx) and α2 (for nx ≤ i ≤ (l − 1)), we can generate
a time series with two different scaling exponents. After getting the time
series we will apply DFA analysis on the time series. If we look at the DFA
figure given below we will find that there are two different slopes and the
crossover location of slope is consistent with the crossover location that we
have supplied to generate the time series (crossover location is 2nx)[10] Now
0 1 2 3 4 5 6log (n)
0
1
2
3
4
log
F(n)
DFA analysis of time series
crossover r
egion
Figure 4.1: DFA of time series with nx = 30,α1 = 0.61 and α2 = 0.78
since we have the time series in hand and we also know the autocorrelation
exponents γ1 = 0.78 and γ2 = 0.44(use relation γ = 2−2α,here α is the DFA
exponent...also cite the paper for this relation), we can move on to calculate
the return interval distribution of extreme events for this time series. In
22

chapter(1) we have already described how we are going to calculate the return
interval distribution for the time series. We will use the same approach here
as well. If we notice the Figure(4.2) we see that there is a breakpoint in
-5 -4 -3 -2 -1 0 1 2ln (R)
-8
-7
-6
-5
-4
-3
ln P
(R)
segment 1
segment 2
break point
Figure 4.2: return interval distribution of time series with nx = 30 and
q = 2.2 and R is the scaled return interval defined as r/〈r〉. Points represent
numerical data, line represents fitting of Equation(4.3)
the figure at R = nx/〈r〉 (for the specfic example shown above the value of
〈r〉 is 65 units) So we can see that there are two segments in return interval
distribution figure; first segment contains all those return intervals for which
r < nx and the second segment contains the return intervals for which r > nx.
The return interval distribution figure that we have shown above is the result
of our analysis on an ensemble of hundread time series. This is done to avoid
the excessive fluctuation for the return interval distribution calculation. Next
we have tried to fit both the segments of return interval distribution with a
23

curve of the form,
P (r) = ar−(1−γ)e−(c/γ)rγ . (4.3)
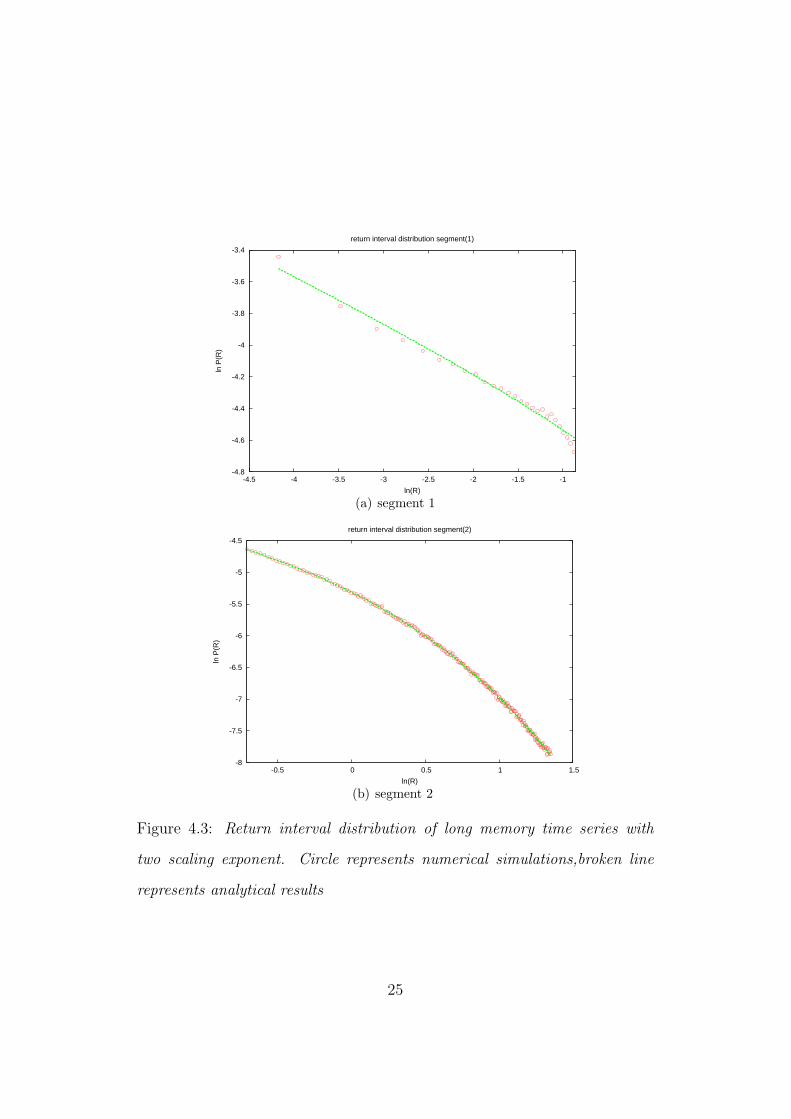
These fits are shown in Figure(4.3(a)) and Figure(4.3(b)). One can raise a
quesition about equation(4.3) that why should two different values a and c
be used, why not one single value a or c ? The explanation for the ques-
tion is that since return interval distribution also follow long memory and we
have taken the assumption that return intervals are completely uncorrelated.
Hence, a significant difference will arise between our numerical and analytical
results. Considering the long memory dependence of return intervals will be
a problem in itself and we are not going to solve that issue in this report. So
in our results, we assume that return intervals are completely uncorrelated.
One more problem with the equation(4.3) is that the γ values are not com-
pletely consistent with the γ values based on the DFA exponents of the time
series. There are two possible cause for this inconsistency:
(1) There is a transition region for the crossover, ideally the transition should
be sharp enough to get better results. We can’t control the adverse effect of
this problem on our results.
(2)We are not able to understand what is the effect of different threshold
values(q) on the curve described by equation(4.3).
So the main conclusion that we can derive from this section is that both the
return interval segments follow a distribution which is of the form equation(4.3).
We can say that return interval distributions still follow a form which con-
tains product of power law and a stretched exponential. These results are
kind of same as results shown in Santhanam et,al(cite his reference here),
the only difference is the apperance of a break point which is consistent with
24
-4.8
-4.6
-4.4
-4.2
-4
-3.8
-3.6
-3.4
-4.5 -4 -3.5 -3 -2.5 -2 -1.5 -1
ln P
(R)
ln(R)
return interval distribution segment(1)
(a) segment 1
-8
-7.5
-7
-6.5
-6
-5.5
-5
-4.5
-0.5 0 0.5 1 1.5
ln P
(R)
ln(R)
return interval distribution segment(2)
(b) segment 2
Figure 4.3: Return interval distribution of long memory time series with
two scaling exponent. Circle represents numerical simulations,broken line
represents analytical results
25

the crossover in DFA figure. In next section we will generate a long memory
probability process with two scaling exponents. This closely follows the the-
oretical assumptions and hence we can expect a better agreement with the
analytical results.
26

Chapter 5
Long memory probability
process with two scaling
exponents
In previous section, we have seen that our numerical results are deviate to
some extent from our analytical results. One of the reason that we have sug-
gested for this discrepancy is the presence of long memory in return intervals.
So if we somehow manage to get rid of this problem our analytical results
should be consistent with the numerical results. Now we will try to numer-
ically simulate the probability process in equation(3.2), we first determine
the constants a1 and a2 by normalizing it in the region kmin = 1 and kmax.
Using equation(3.2) we can set the normalization condition,
∫ kmax
1
Pex(r)dr =
∫ nx
1
a1r−(1−γ1)dr +
∫ kmax
nx
a2r−(1−γ2)dr = 1 (5.1)
except this normalization condition we will also use the continuity condition
3.21 to calculate the values of a1 and a2.
27

After solving equation(3.21) and (5.1) the values of a1 and a2 are given below.
a1 =1
[nγ1x
γ1− 1
γ1+ k
γ2maxn
γ1−γ2x
γ2− n
γ1x
γ2]
(5.2)
a2 =1
[nγ2x
γ1− n
γ2−γ1x
γ1+ k
γ2max
γ2− n
γ2x
γ2]
(5.3)
So now we have the values of a1 and a2,we can use the probability distribution
given below.
Pex(r) =
a1r−(2α1−1) = a1r
−(1−γ1) for 1 < r < nx
a2r−(2α2−1) = a2r
−(1−γ2) for nx < r < kmax
(5.4)
where r = 1, 2, 3...... Now generate a random number ξr from a uniform
distribution at every r and compare it with the value of P (r). A random
number is accepted as an extreme event if ξr < P (r) at any given value of r.
If ξr ≥ P (r), then it is not an extreme event. Using this procedure we can
generate a series of extreme events which follow equation(5.4). Now we will
calculate the return interval distribution after scaling it by average return
interval.
In the Figure(5.1) we have two segments for return interval distribution.
According to the result shown in equation(3.18), we can fit both of these
segments. In equation(3.18) we have three constants a1, a2 and C, we have
already solved for the values of a1 and a2 in equation(5.2) and equation(5.3).
To calculate the value of C, we will use the normalization condition for total
probability,∫ kmax
1
P (r)dr =
∫ nx
1
P (r)dr +
∫ kmax
nx
P (r)dr = 1
=
∫ nx
1
a1r−(1−γ1)e−(a1/γ1)rγ1dr +
∫ kmax
nx
Ca2r−(1−γ2)e−(a2/γ2)rγ2
28

-6 -4 -2 0 2ln (R)
-9
-8
-7
-6
-5
-4
-3
-2ln
P(R
)
segment 2
segment 1
break point
Figure 5.1: return interval distribution of long memory probability process
for γ1 = 0.1,γ2 = 0.5,nx = 50 and kmax = 1000, points represent numerical
resuts, line represents analytical results given in Equation(3.18)
On solving the integrals given above we will get an equation containing a1,
a2 and C.
[e−(a1/γ1) − e−(a1/γ1)nγ1x ] + C[e−(a2/γ2)n
γ2x − e−(a2/γ2)k
γ2max ] = 1 (5.5)
If we use equation(5.2), (5.3) and substitute the values of a1 and a2 in
equation(5.5), we will get C in terms of nx, γ1 and γ2. Since the equa-
tions describing C, a1 and a2 are of very complex form, it will be better to
solve them numerically using the values of γ1, γ2 and nx. As we have seen
in the Figure(5.2(a)) and Figure(5.2(b)), we are able to fit both of these seg-
ments according to results shown in equation(3.18). But if we inspect these
figures closely we will find that for first segment the the actual fitting is not
a1r−(1−γ1)e−(a1/γ1)rγ1 , instead the fiting is something like ar−(1−γ1)e−(b/γ1)rγ1 .
29

-6.5
-6
-5.5
-5
-4.5
-4
-3.5
-3
-2.5
-2
-5.5 -5 -4.5 -4 -3.5 -3 -2.5 -2 -1.5
ln P
(R)
ln(R)
return interval distribution of segment 1
(a) segment 1 for γ1 = 0.1
-8.5
-8
-7.5
-7
-6.5
-6
-1 -0.5 0 0.5 1 1.5 2
ln P
(R)
ln(R)
return interval distribution of segment 2
(b) segment 2 for γ2 = 0.5
Figure 5.2: return interval distribution of long memory probability process (+
represents numerical results, broken line represents analytical results)
30

So for this probability process we need to explain,why the return interval
distribution expression of segment(1) have two different constants a and
b(inplace of one single constant a1 according to equation(3.18)). Accord-
ing to equation(5.4), the minimum size of return interval possible is 1 unit.
If we do scaling on this by the average return interval 〈r〉 then the scaled
minimum return interval will be 1/〈r〉. So in equation(3.19) and (3.20), we
should replace the lower limit of integral by 1/〈r〉 in place of 0. It also reflects
the general idea that all power laws in practice have a lower bound. So the
replacement of lower limit in the integrals will lead to different constants a
and b instead of a single constant a1.
31

Chapter 6
Conclusion
We have studied the distribution of return intervals for long memory process
with two different scaling exponents. We have obtained an analytical ex-
pression for the return interval distribution and verified it with simulations.
We have shown that for a long memory time series with two different scaling
exponent there will be a crossover point in the return interval distribution.
We have shown that if a time series has different scaling exponents, then this
is also reflected in the return interval distribution. For each scaling exponent
there will be a corresponding segment in the return interval distribution and
the common thing about all the segments is that all of them still follow a
distribution which is the product of a power law and stretched exponential.
The only difference is the scaling exponent that is going to appear for dif-
ferent segments. The previous studies in the field of extreme events mainly
focus on time series with single scaling exponent although many of the time
series observed in nature contain more than one scaling exponent. So the
results that we have shown in this report could help us deal with real life
series more accurately. Although the results shown in this report are quite
32

encouraging, there are a many issues which are needed to be resolved for
much better analysis; (a) the model that we have used to generate time se-
ries with more than one scaling exponent need a fine tuning so that we can
test our analytical results more accurately, (b) we should also think of the
effects of long memory in return intervals itself. Future research in this field
should address some of these issues.
33

Bibliography
[1] Rosario N. Mantegna, H. Eugene Stanley. An introduction to econo-
physics:correlations and complexity in finance. Cambridge university
press
[2] G. Rangarajan, M. Ding. Processes with long range correlations:Theory
and application Springer
[3] Jonathan D. Cryer, Kung-Sik Chan. Time series analysis, with applica-
tion in R. Springer
[4] Peng C-K, Havlin S, Stanley HE, Goldberger AL. Quantification of scal-
ing exponents and crossover phenomena in nonstationary heartbeat time
series. Chaos 1995;5:82-87.
[5] Peng C-K, Buldyrev SV, Havlin S, Simons M, Stanley HE, Goldberger
AL. Mosaic organization of DNA nucleotides. Phys Rev E 1994;49:1685-
1689.
[6] Roman H. E and Porto M, Fractional derivatives of random walks:Time
series with long time memory arXiv:0806.3171v1
34

[7] Richard T. Baillie,1996.Long memory process and fractional integration
in econometrics. Journal of econometrics 73 (1996) 5 59
[8] M. S Santhanam, Holger Kantz. Return interval distribution of extreme
events and long-term memory. Phys Rev E 78, 051113 (2008)
[9] Govindan Rangarajan, Mingzhou Ding. Integrated approach to the as-
sessment of long range correlation in time series data Phys Rev E 61,
5, 4991-5001, (2000)
[10] Boris Podobnik, Ivo Grosse, H. Eugene Stanley. Stochastic processes with
power-law stability and a crossover in power-law correlations Physica A
316 (2002) 153 – 159
[11] Ronald L. Graham, Donald E. Knuth, Oren Patashnik. Concrete Math-
ematics Addison-Wesley publishing company
[12] William H. press, Saul A. Teukolsky, William T. Veterling, Brian P.
Flannery. Numerical recipes in c++: The art of scientific computing.
Cambridge university press
35