Embed Size (px)
Citation preview

©2015 Waters Corporation 1
Adding Mass Detection to Routine
Peptide Level Biotherapeutic Analysis

©2015 Waters Corporation 2
Presentation Outline
The unmet need
The ACQUITY® QDa® Detector – a brief overview
Demonstrating broad utility for peptide monitoring
A clear path to increased productivity
©2015 Waters Corporation 3
What we’ve been hearing…
“We’re doing a lot of routine MS monitoring in support of pilot
operations, manufacturing and QC, and foresee doing more in the
future.”
“Relying on our core MS resources and high end equipment for
this testing is expensive and creates a bottleneck.”
“We’d like to empower traditional LC analytical support labs to
generate this data, thus reducing the burden on core MS resources
and improving our overall workflow and productivity.”
The bottom line: Biopharmaceutical laboratories want to better utilize analytical resources and improve productivity.
©2015 Waters Corporation 4
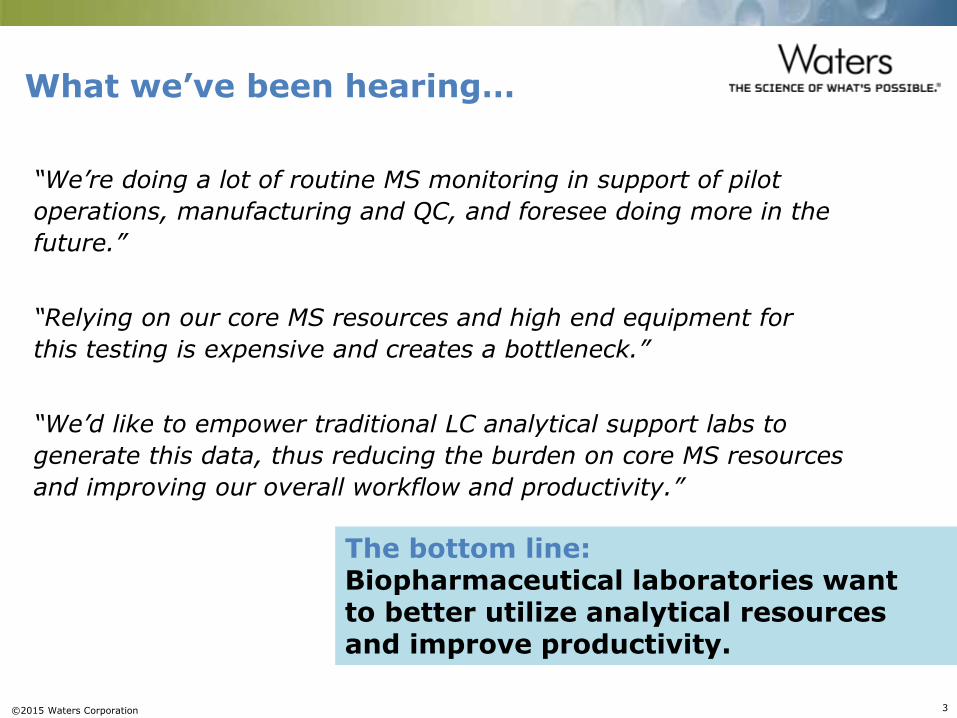
The ACQUITY® QDa® Mass Detector A pioneering product with mass appeal
Innovative design focused on
ease-of-use for chromatographers
Empowering analytical chemists
everywhere with orthogonal mass
detection – added information with
every sample
Compact, robust and affordable:
Built for constant use with a wide
variety of chromatographic
conditions
Seamlessly integrates with HPLC &
UPLC® systems that use Empower ®
Chromatography Data Software
www.waters.com/qda
©2015 Waters Corporation 5
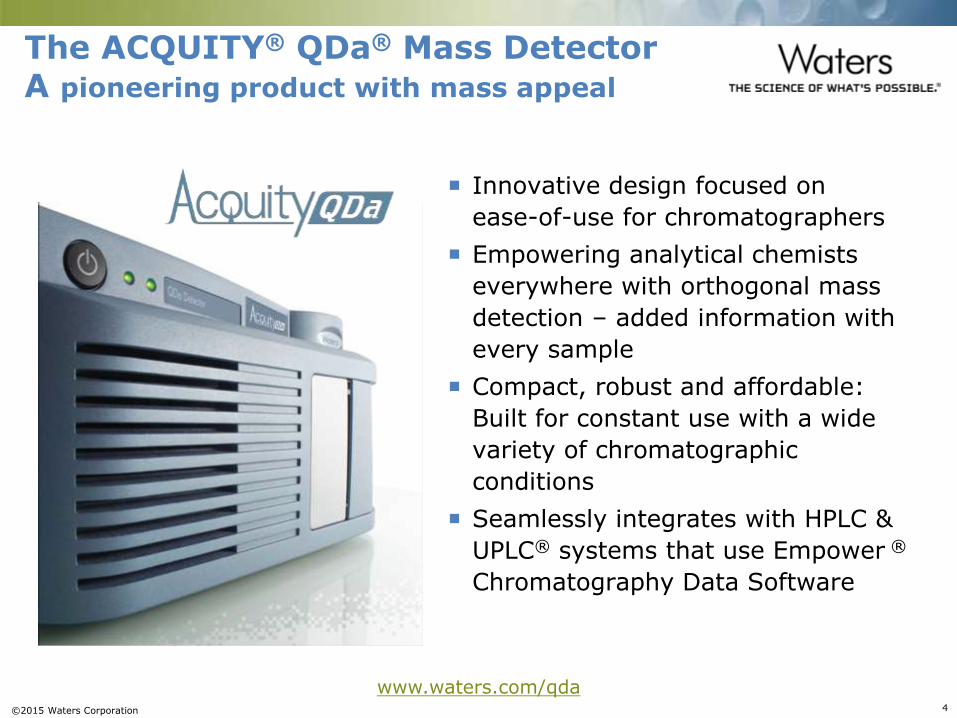
Easily Add to Existing LC Systems
Existing stack
Easy to deploy
Fully integrated with Empower® CDS Software
Minimal training required
Qualification documents / procedures ready-to-go
110/220V operation
Minimal maintenance
ACQUITY QDa
Existing stack +1upgrade
©2015 Waters Corporation 6
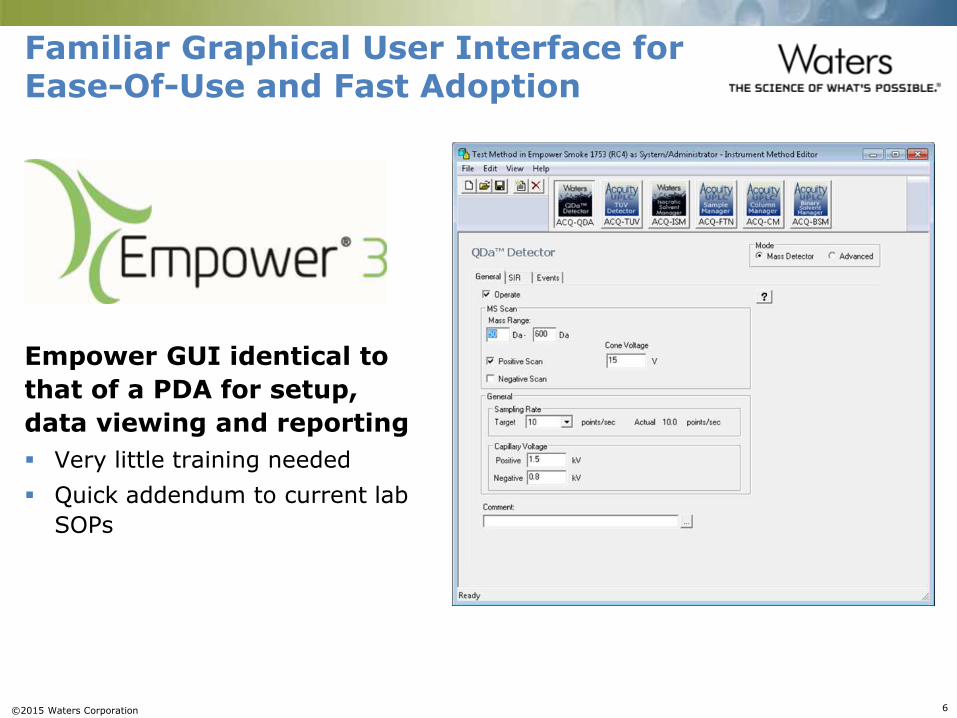
Familiar Graphical User Interface for Ease-Of-Use and Fast Adoption
Empower GUI identical to
that of a PDA for setup,
data viewing and reporting
Very little training needed
Quick addendum to current lab
SOPs

©2015 Waters Corporation 7
Automated Start Up ProvidesRobust, Reproducible Performance
Automated resolution and calibration occurs with each
start-up, ensuring mass information is accurate and precise
ESI interface optimized for UPLC performance to ensure
chromatographic resolution, sensitivity and throughput is
preserved
The Graphic ACQUITY QDamonitor display enables easy viewing and adjustment of system parameters

©2015 Waters Corporation 8
Disposable Sample Aperture and Capillary for Easy Maintenance
Sample Aperture:
As simple as replacing a detector lamp
Capillary:
No cutting or assembly required
©2015 Waters Corporation 9
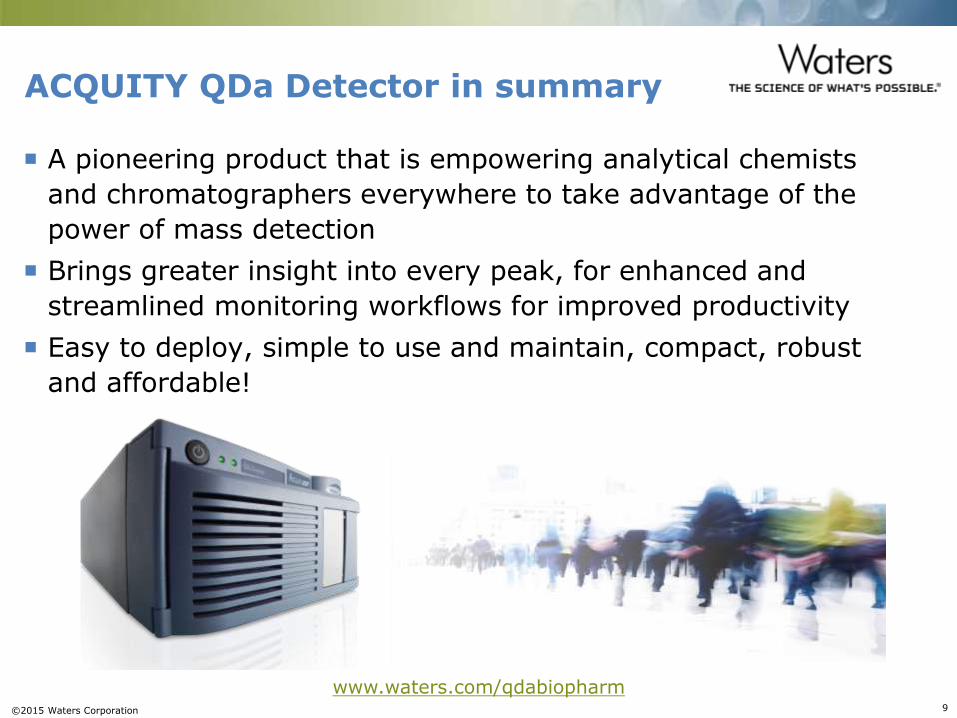
ACQUITY QDa Detector in summary
A pioneering product that is empowering analytical chemists
and chromatographers everywhere to take advantage of the
power of mass detection
Brings greater insight into every peak, for enhanced and
streamlined monitoring workflows for improved productivity
Easy to deploy, simple to use and maintain, compact, robust
and affordable!
www.waters.com/qdabiopharm

©2015 Waters Corporation 10
ACQUITY QDa for Peptides
The following data demonstrates that this easy-to-sue
mass detector can:
Detect and monitor peptides over a wide molecular weight range
Quantify peptide variants with enhanced specificity
Monitor components below optical detector sensitivity
Selectively detect and monitor coeluting components
Work with both TFA and Formic Acid based separations

©2015 Waters Corporation 11
Extracted spectrum
ACQUITY QDa
ACQUITY QDa Detects Peptides Over a Wide Mass Range
3 µg injection
Peak Peptideaverage
mass [M+] M+2] [M+3] [M+4] [M+5]
1 Angiotensin frag. 1-7 899.0 900.0 450.5 300.6 225.7 180.8
2 Bradykinin 1060.2 1061.2 531.1 354.4 266.0 213.0
3 Angiotensin II 1046.2 1047.1 524.1 349.7 262.5 210.2
4 Angiotensin I 1296.5 1297.4 649.2 433.1 325.1 260.3
5 Renin substrate 1759.0 1760.0 880.5 587.3 440.7 352.8
6 Enolase T35 1873.2 1874.2 937.6 625.4 469.3 375.6
7 Melittin 2847.5 2848.4 1424.7 950.1 712.8 570.5
Charge State
1 2
3
4
5
67
[M+4]
[M+3]
712.7
949.9
[M+5]
570.4

©2015 Waters Corporation 12
ACQUITY QDa Mass Chromatograms of Trastuzumab Digest
ACQUITY UPLC BEH Column 0.1% TFA, 4-µg injection
ACQUITY UPLC BEH Column 0.1% FA, 4-µg injection
Digest 5BEH 130Å 100mmGradient: 97-65% A
Digest 1BEH 300Å 150mmGradient: 97-65% A

©2015 Waters Corporation 13
Trastuzumab – Heavy Chain Peptideswith TFA vs. FA as Acid Modifier
Fragment
Average
Mass [CH+1H]+1 [CH+2H]+2 [CH+3H]+3 [CH+4H]+4 [CH+5H]+5 [CH+6H]+6 [CH+7H]+7 [CH+8H]+8 [CH+9H]+9 [CH+10H]+10
T39 574.3 575.3 288.2 192.4 144.6 115.9 96.7 83.0 72.8 64.8 58.4
T7 681.3 682.3 341.7 228.1 171.3 137.3 114.6 98.3 86.2 76.7 69.1
T5 830.0 831.0 416.0 277.7 208.5 167.0 139.3 119.6 104.7 93.2 84.0
T21 835.0 836.0 418.5 279.3 209.7 168.0 140.2 120.3 105.4 93.8 84.5
T30 838.0 839.0 420.0 280.3 210.5 168.6 140.7 120.7 105.8 94.1 84.8
T9 969.1 970.1 485.5 324.0 243.3 194.8 162.5 139.4 122.1 108.7 97.9
T6 1084.2 1085.2 543.1 362.4 272.1 217.8 181.7 155.9 136.5 121.5 109.4
T3 1089.2 1090.2 545.6 364.1 273.3 218.8 182.5 156.6 137.2 122.0 109.9
T36* 1161.4 1162.4 581.7 388.1 291.3 233.3 194.6 166.9 146.2 130.0 117.1
T2* 1167.4 1168.4 584.7 390.1 292.8 234.5 195.6 167.8 146.9 130.7 117.7
T8-9 1182.3 1183.3 592.2 395.1 296.6 237.5 198.1 169.9 148.8 132.4 119.2
T13 1186.4 1187.4 594.2 396.5 297.6 238.3 198.7 170.5 149.3 132.8 119.6
T10 1310.5 1311.5 656.3 437.8 328.6 263.1 219.4 188.2 164.8 146.6 132.1
T4-5 1311.5 1312.5 656.8 438.2 328.9 263.3 219.6 188.4 164.9 146.7 132.2
T14* 1321.5 1322.5 661.8 441.5 331.4 265.3 221.3 189.8 166.2 147.8 133.2
T11* 1334.4 1335.4 668.2 445.8 334.6 267.9 223.4 191.6 167.8 149.3 134.4
T23 1677.8 1678.8 839.9 560.3 420.5 336.6 280.6 240.7 210.7 187.4 168.8
T33-34 1724.9 1725.9 863.5 576.0 432.2 346.0 288.5 247.4 216.6 192.7 173.5
T26 1808.1 1809.1 905.1 603.7 453.0 362.6 302.4 259.3 227.0 201.9 181.8
T38 1874.1 1875.1 938.0 625.7 469.5 375.8 313.3 268.7 235.3 209.2 188.4
T1 1882.1 1883.1 942.1 628.4 471.5 377.4 314.7 269.9 236.3 210.1 189.2
T22* 2139.4 2140.4 1070.7 714.1 535.8 428.9 357.6 306.6 268.4 238.7 214.9
T26-27 2228.6 2229.6 1115.3 743.9 558.1 446.7 372.4 319.4 279.6 248.6 223.9
T2-3* 2238.6 2239.6 1120.3 747.2 560.6 448.7 374.1 320.8 280.8 249.7 224.9
T37 2544.7 2545.7 1273.3 849.2 637.2 509.9 425.1 364.5 319.1 283.7 255.5
T12 2785.0 2786.0 1393.5 929.3 697.3 558.0 465.2 398.9 349.1 310.4 279.5
T41* 2802.1 2803.1 1402.1 935.0 701.5 561.4 468.0 401.3 351.3 312.3 281.2
T19-20* 3335.9 3336.9 1669.0 1113.0 835.0 668.2 557.0 477.6 418.0 371.7 334.6
T15* 6716.5 6717.5 3359.2 2239.8 1680.1 1344.3 1120.4 960.5 840.6 747.3 672.6
T15-16* 7058.9 7059.9 3530.4 2354.0 1765.7 1412.8 1177.5 1009.4 883.4 785.3 706.9
T15-17* 7187.0 7188.0 3594.5 2396.7 1797.8 1438.4 1198.8 1027.7 899.4 799.6 719.7
Trifluoroaceticacid
Formic acid
= not observed
Legend:
90 % Coverage
©2015 Waters Corporation 14
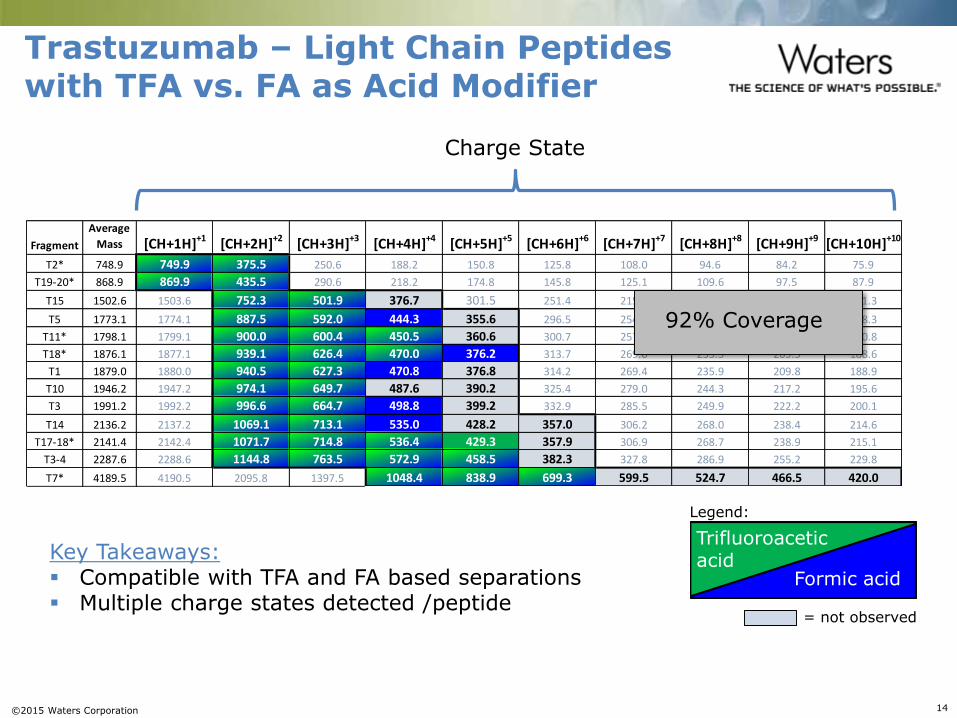
Trastuzumab – Light Chain Peptideswith TFA vs. FA as Acid Modifier
Fragment
Average
Mass [CH+1H]+1 [CH+2H]+2 [CH+3H]+3 [CH+4H]+4 [CH+5H]+5 [CH+6H]+6 [CH+7H]+7 [CH+8H]+8 [CH+9H]+9 [CH+10H]+10
T2* 748.9 749.9 375.5 250.6 188.2 150.8 125.8 108.0 94.6 84.2 75.9
T19-20* 868.9 869.9 435.5 290.6 218.2 174.8 145.8 125.1 109.6 97.5 87.9
T15 1502.6 1503.6 752.3 501.9 376.7 301.5 251.4 215.7 188.8 168.0 151.3
T5 1773.1 1774.1 887.5 592.0 444.3 355.6 296.5 254.3 222.6 198.0 178.3
T11* 1798.1 1799.1 900.0 600.4 450.5 360.6 300.7 257.9 225.8 200.8 180.8
T18* 1876.1 1877.1 939.1 626.4 470.0 376.2 313.7 269.0 235.5 209.5 188.6
T1 1879.0 1880.0 940.5 627.3 470.8 376.8 314.2 269.4 235.9 209.8 188.9
T10 1946.2 1947.2 974.1 649.7 487.6 390.2 325.4 279.0 244.3 217.2 195.6
T3 1991.2 1992.2 996.6 664.7 498.8 399.2 332.9 285.5 249.9 222.2 200.1
T14 2136.2 2137.2 1069.1 713.1 535.0 428.2 357.0 306.2 268.0 238.4 214.6
T17-18* 2141.4 2142.4 1071.7 714.8 536.4 429.3 357.9 306.9 268.7 238.9 215.1
T3-4 2287.6 2288.6 1144.8 763.5 572.9 458.5 382.3 327.8 286.9 255.2 229.8
T7* 4189.5 4190.5 2095.8 1397.5 1048.4 838.9 699.3 599.5 524.7 466.5 420.0
Charge State
Trifluoroaceticacid
Formic acid
= not observed
Legend:
Key Takeaways: Compatible with TFA and FA based separations Multiple charge states detected /peptide
92% Coverage
©2015 Waters Corporation 15
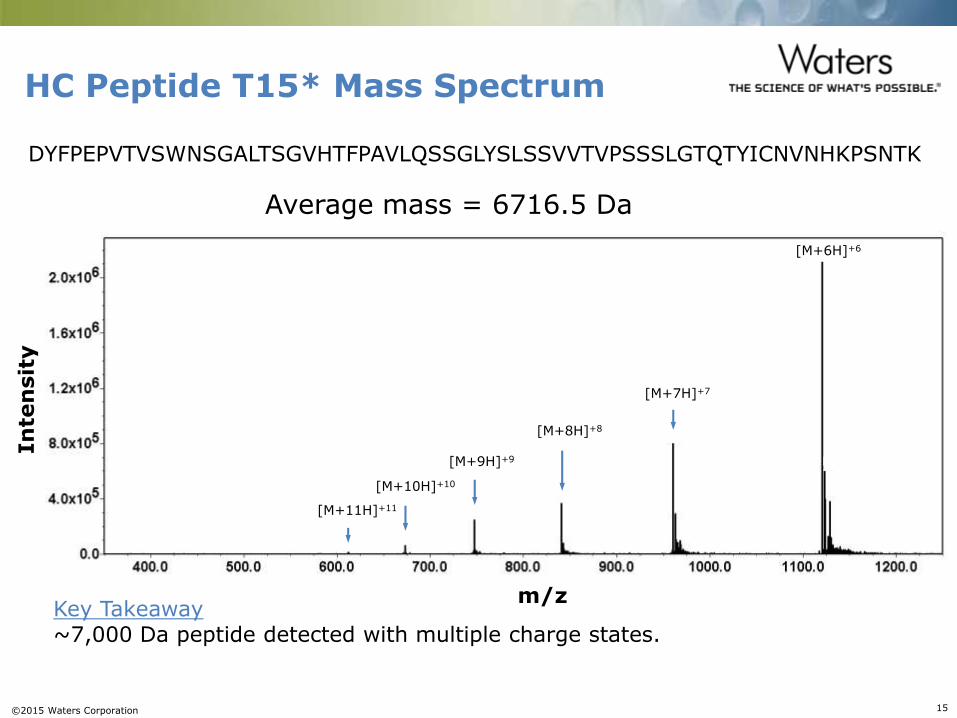
HC Peptide T15* Mass Spectrum
DYFPEPVTVSWNSGALTSGVHTFPAVLQSSGLYSLSSVVTVPSSSLGTQTYICNVNHKPSNTK
Average mass = 6716.5 Da
[M+6H]+6
[M+7H]+7
[M+8H]+8
[M+9H]+9
[M+10H]+10
[M+11H]+11
m/z
In
ten
sit
y
Key Takeaway~7,000 Da peptide detected with multiple charge states.

©2015 Waters Corporation 16
Mass Measurement Accuracy
0.00
20.00
40.00
60.00
80.00
100.00
0.00 0.05 0.10 0.15 0.20
Cu
mu
lati
ve
Erro
r (
%)
Absolute Mass Error
Cumulative Error Distribution Plot
-0.30
-0.20
-0.10
0.00
0.10
0.20
0.30
0 1,000 2,000 3,000 4,000 5,000 6,000 7,000
Mass D
iffe
ren
ce
Theoretical Average Molecular Weight (Da)
Mass Error Vs. Molecular Weight
Instru
ment S
pec.
Key TakeawayMass measurement accuracy of all reported peptides within instrument specification (+/- 0.2 Da).

©2015 Waters Corporation 17
Specificity:Accurate Peak Area Determinations
T10
T26
T26: Area 9.1105 (59%)T10: Area 6.3105 (41%)
T26: Area 1.6108 (62%)T10: Area 9.9107 (38%)
TUV
XIC
T10
T26
Key TakeawayMS detection reduces variability when integrating closely eluting components.

©2015 Waters Corporation 18
Specificity: Resolving Coelutions
XIC
SIR
Peak 2
Peak 2
Peak 1
Peak 1&2
Peak 1 [M+4H]+4
536.3 m/z
Peak 2 [M+2H]+2
426.5 m/z
TUV
Peak 2426.5 m/z
Key Takeaway MS reveals coelutions and enables you to independently monitor both species.
©2015 Waters Corporation 19
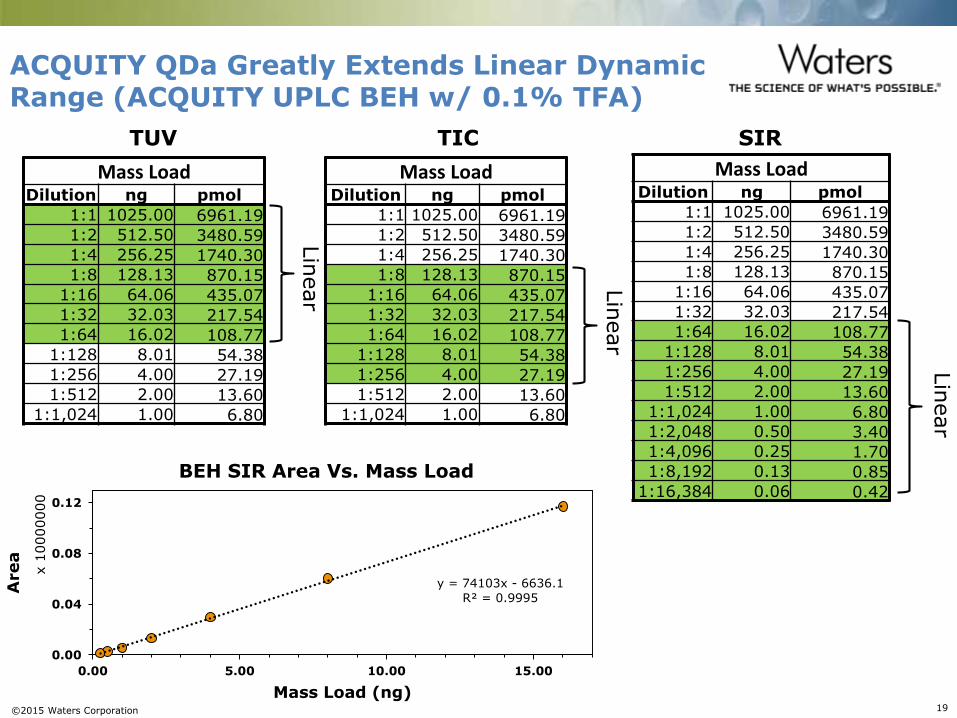
ACQUITY QDa Greatly Extends Linear Dynamic Range (ACQUITY UPLC BEH w/ 0.1% TFA)
Mass LoadDilution ng pmol
1:1 1025.00 6961.19
1:2 512.50 3480.59
1:4 256.25 1740.30
1:8 128.13 870.15
1:16 64.06 435.07
1:32 32.03 217.54
1:64 16.02 108.77
1:128 8.01 54.38
1:256 4.00 27.19
1:512 2.00 13.60
1:1,024 1.00 6.80
y = 74103x - 6636.1
R² = 0.9995
0.00
0.04
0.08
0.12
0.00 5.00 10.00 15.00
Area
x 1
0000000
Mass Load (ng)
BEH SIR Area Vs. Mass Load
SIRTUV
Mass LoadDilution ng pmol
1:1 1025.00 6961.19
1:2 512.50 3480.59
1:4 256.25 1740.30
1:8 128.13 870.15
1:16 64.06 435.07
1:32 32.03 217.54
1:64 16.02 108.77
1:128 8.01 54.38
1:256 4.00 27.19
1:512 2.00 13.60
1:1,024 1.00 6.80
Mass LoadDilution ng pmol
1:1 1025.00 6961.19
1:2 512.50 3480.59
1:4 256.25 1740.30
1:8 128.13 870.15
1:16 64.06 435.07
1:32 32.03 217.54
1:64 16.02 108.77
1:128 8.01 54.38
1:256 4.00 27.19
1:512 2.00 13.60
1:1,024 1.00 6.80
1:2,048 0.50 3.40
1:4,096 0.25 1.70
1:8,192 0.13 0.85
1:16,384 0.06 0.42
TIC
Lin
ear
Lin
ear
Lin
ear

©2015 Waters Corporation 20
Extend the Linear Dynamic Range Farther Using ACQUITY UPLC CSH w/ 0.1% FA
SIR
Mass LoadDilution ng pmol
1:64 16 109
1:128 8 54.4
1:256 4 27.2
1:512 2 13.6
1:1024 1 6.80
1:2,048 0.50 3.40
1:4,096 0.25 1.70
1:8,192 0.12 0.849
1:16,384 0.063 0.425
1:32,768 0.031 0.212
1:65,536 0.016 0.106
1:131,072 0.0078 0.0531
1:262,144 0.0039 0.0266
1:524,288 0.0020 0.0133
Lin
ear
R² = 0.9993
0
4
8
12
16
20
0.00 2.00 4.00 6.00 8.00 10.00
Area M
illions
Mass Load (ng)
CSH 0.1% FA SIR Area Vs. Mass Load
2.0 pg (13fmol)
7.8 pg (53fmol)
16 pg (106fmol)
31 pg (212fmol)
SIR
1:32,768
1:65,536
1:131,0721:524,288
S/N 171
S/N 88
S/N 28
S/N 15
dilution
©2015 Waters Corporation 21
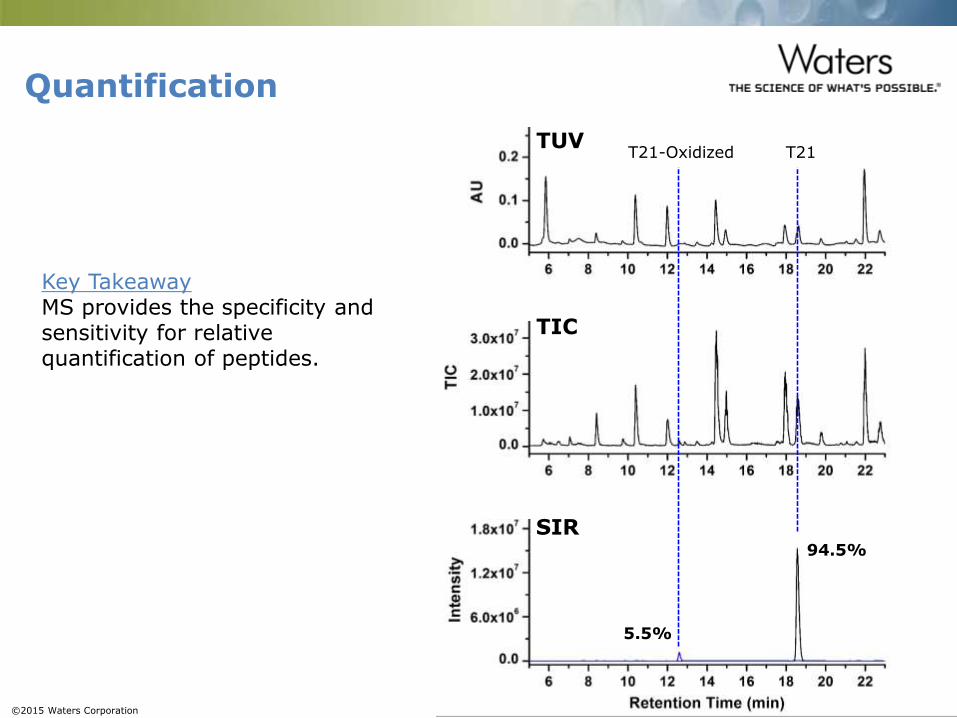
Quantification
T21-Oxidized T21
5.5%
94.5%
SIR
TUV
TIC
Key TakeawayMS provides the specificity and sensitivity for relative quantification of peptides.
©2015 Waters Corporation 22
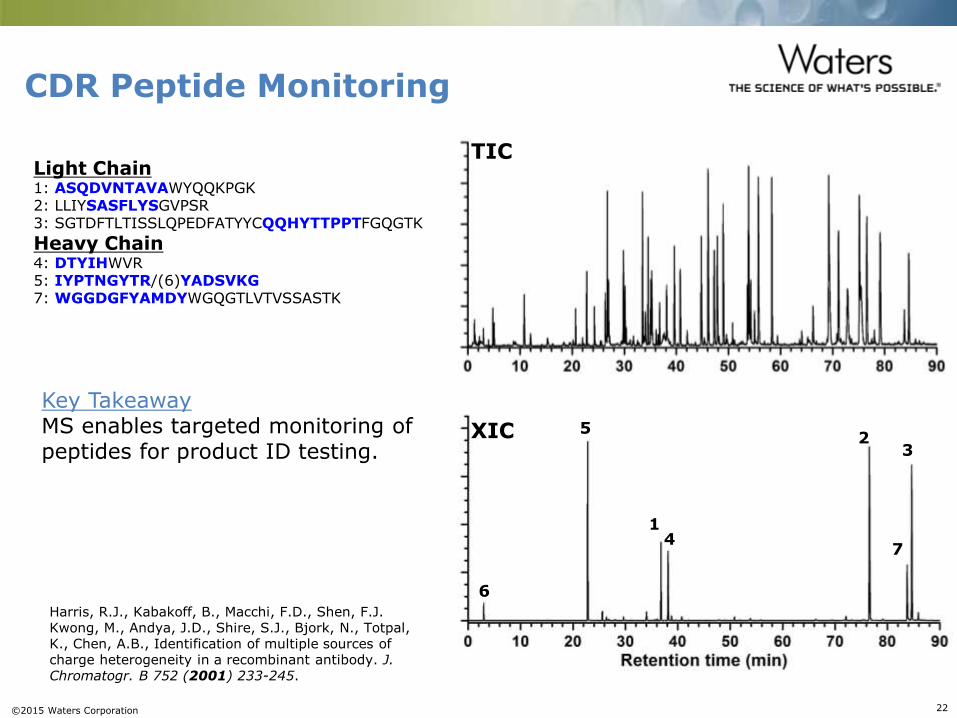
CDR Peptide Monitoring
TIC
XIC
1
23
4
5
6
7
Key TakeawayMS enables targeted monitoring of peptides for product ID testing.
Light Chain1: ASQDVNTAVAWYQQKPGK2: LLIYSASFLYSGVPSR3: SGTDFTLTISSLQPEDFATYYCQQHYTTPPTFGQGTK
Heavy Chain4: DTYIHWVR5: IYPTNGYTR/(6)YADSVKG7: WGGDGFYAMDYWGQGTLVTVSSASTK
Harris, R.J., Kabakoff, B., Macchi, F.D., Shen, F.J. Kwong, M., Andya, J.D., Shire, S.J., Bjork, N., Totpal, K., Chen, A.B., Identification of multiple sources of charge heterogeneity in a recombinant antibody. J. Chromatogr. B 752 (2001) 233-245.

©2015 Waters Corporation 23
Deamidation Monitoring (CDR peptide)
TIC
XIC
572.8 m/z
PeptideAverage
MassXICm/z
T3-4 2,287.5 572.8
T18* 1,876.1 626.3
T2* 1,167.3 584.6
T5 8,29.9 415.9
T3-4* 2,288.5 573.1
T5
T3-4
T2*
T18*
T3-4: ASQDVNTAVAWYQQKPGKAPK
Deamidated
XICT3-4
573.1 m/zT3-4*(D)
Key TakeawayWhen chromatographically resolved, deamidated species can be monitored.
Harris, R.J., Kabakoff, B., Macchi, F.D., Shen, F.J. Kwong, M., Andya, J.D., Shire, S.J., Bjork, N., Totpal, K., Chen, A.B., Identification of multiple sources of charge heterogeneity in a recombinant antibody. J. Chromatogr. B 752 (2001) 233-245.
T3-4*(iso)573.1 m/z

©2015 Waters Corporation 24
Detect and monitor peptides
over a wide molecular weight
range
Quantify peptide variants with
enhanced specificity
Monitor components below
optical detector sensitivity
Selectively detect and monitor
coeluting components
Compatible with both TFA and
Formic Acid based separations
ACQUITY QDa – Fit for Purpose
When incorporated into Empower-based chromatographic workflows, the ACQUITY QDa Detector provides enhanced specificity, selectivity,
and quantification for greater productivity in biotherapeutic development, production and QC.
www.waters.com/qdabiopharm

©2015 Waters Corporation 25
Addendum: User Case Study
Customer X – a large biopharmaceutical developer and
manufacturer – wanted to further explore the potential of the
QDa to meet their analytical needs.
We were supplied with a range of samples unknown to us at the
time and were requested to analyze these samples so they
could compare to their own internal results.
The following slides show ACQUITY QDa data we generated
from these samples and how the data compared to customer
generated results shared with us afterwards.

©2015 Waters Corporation 26
ACQUITY QDa Detector
LysC digest of mAb* (120 min run)
ACQUITY UPLC TUV DetectorMethod Summary** ACQUITY UPLC H-Class
with TUV and ACQUITY QDa detectors run with Empower 3, SR2
ACQUITY UPLC CSH C18 130Å 1.7-µm column, 2.1x100 mm
Acid Modifier: FA
Notes:* Later revealed to be Humira®
** See speaker notes for gradient info and LC-MS settings
Comments:Good agreement between UV trace and TIC trace

©2015 Waters Corporation 27
Zoom-in comparison:0-30 min
LysC digest of mAb (0-30 minutes)
TUV
Mass
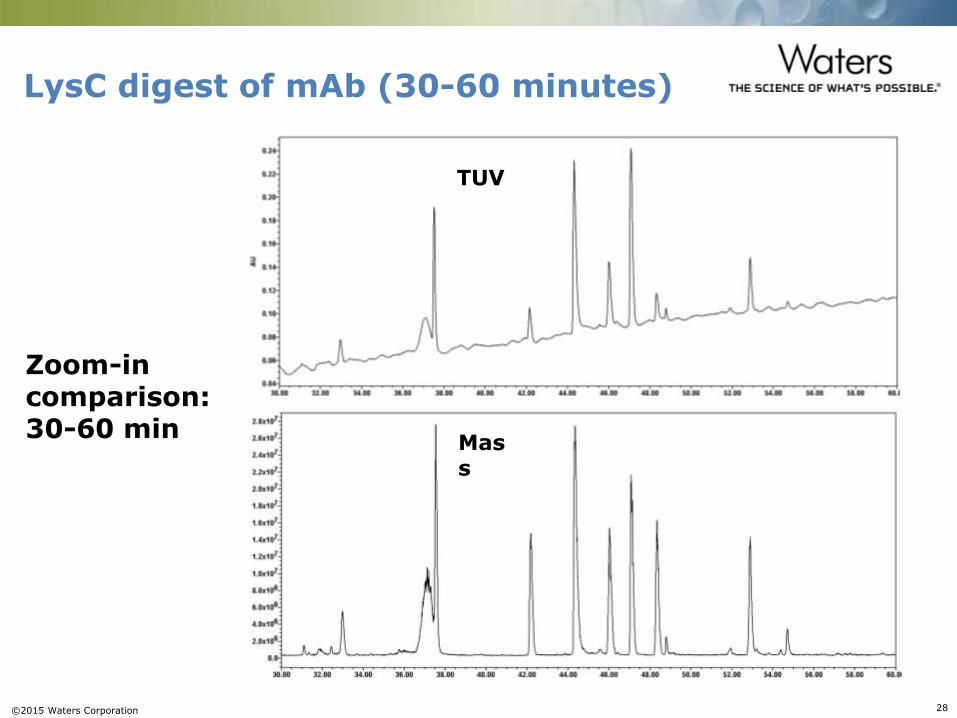
©2015 Waters Corporation 28
Zoom-in comparison:30-60 min
LysC digest of mAb (30-60 minutes)
TUV
Mass

©2015 Waters Corporation 29
Zoom-in comparison: 60-90 min
LysC digest of mAb (60-90 minutes)
TUV
Mass

©2015 Waters Corporation 30
Zoom-in comparison: 90-120 min
LysC digest of mAb (90-120 minutes)
TUV
Mass

©2015 Waters Corporation 31
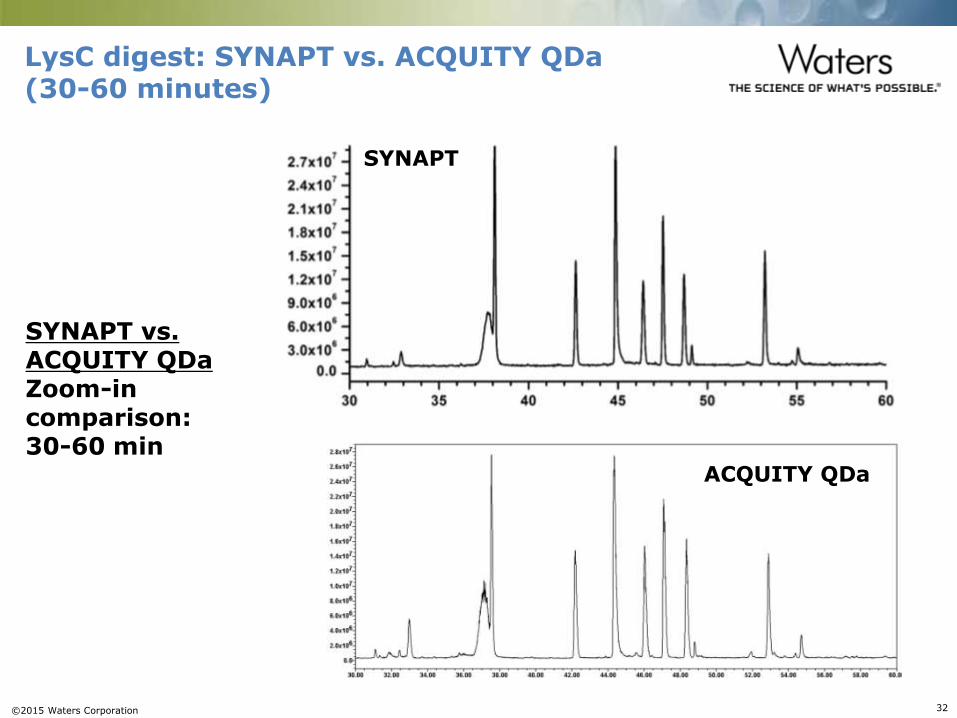
LysC digest: SYNAPT vs. ACQUITY QDa(0-30 minutes)
ACQUITY QDa
SYNAPT (data offset by 2.4 min for comparison)
SYNAPT vs. ACQUITY QDaZoom-in comparison:0-30 min
©2015 Waters Corporation 32
LysC digest: SYNAPT vs. ACQUITY QDa(30-60 minutes)
ACQUITY QDa
SYNAPT
SYNAPT vs. ACQUITY QDaZoom-in comparison:30-60 min
©2015 Waters Corporation 33
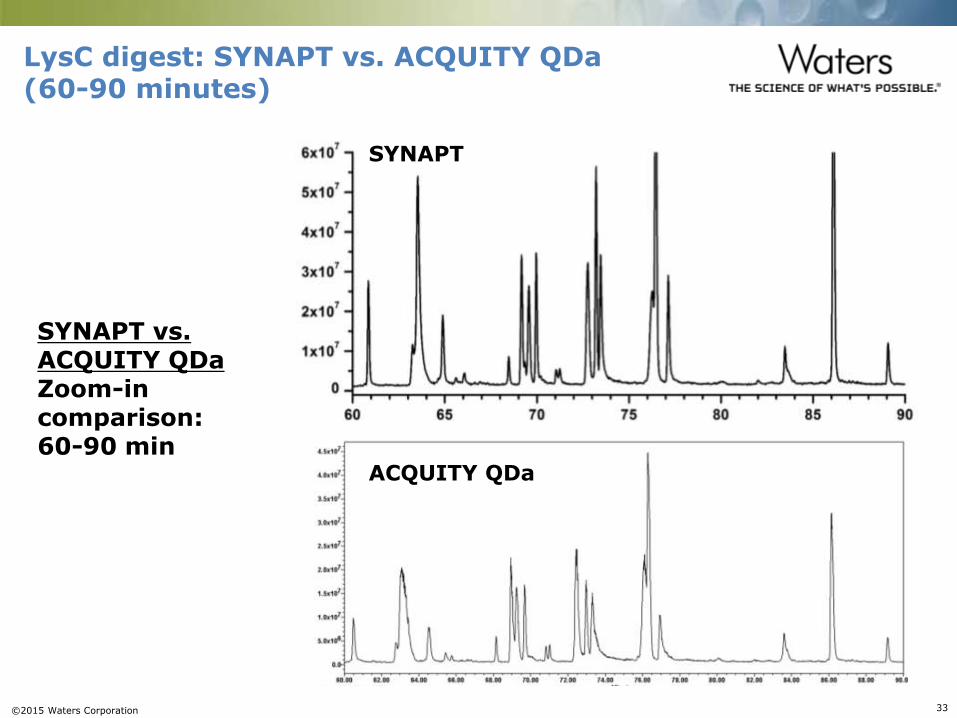
LysC digest: SYNAPT vs. ACQUITY QDa(60-90 minutes)
ACQUITY QDa
SYNAPT
SYNAPT vs. ACQUITY QDaZoom-in comparison:60-90 min

©2015 Waters Corporation 34
LysC digest: SYNAPT vs. ACQUITY QDa(90-120 minutes)
ACQUITY QDa
SYNAPT K7 Peptide (6,714 kDa)
+6
+7+8
+9
+10
SYANPT vs. ACQUITY QDaZoom in comparison:90-120min
Raw spectrum
©2015 Waters Corporation 35
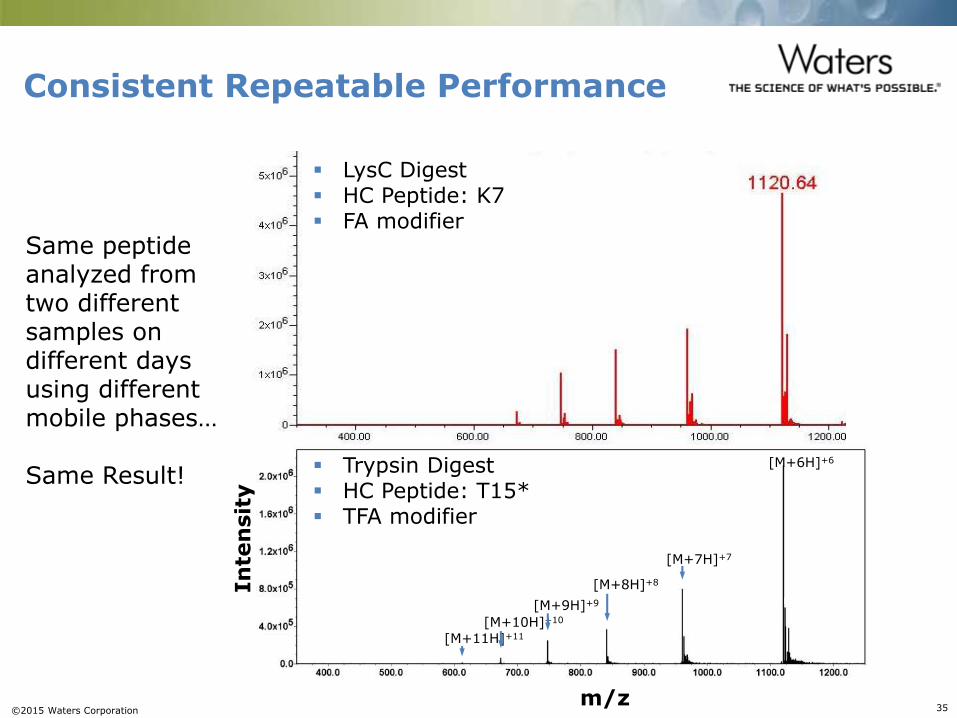
Consistent Repeatable Performance
[M+6H]+6
[M+7H]+7
[M+8H]+8
[M+9H]+9
[M+10H]+10
[M+11H]+11
m/z
In
ten
sit
ySame peptide analyzed from two different samples on different days using different mobile phases…
Same Result!
LysC Digest HC Peptide: K7 FA modifier
Trypsin Digest HC Peptide: T15* TFA modifier
©2015 Waters Corporation 36
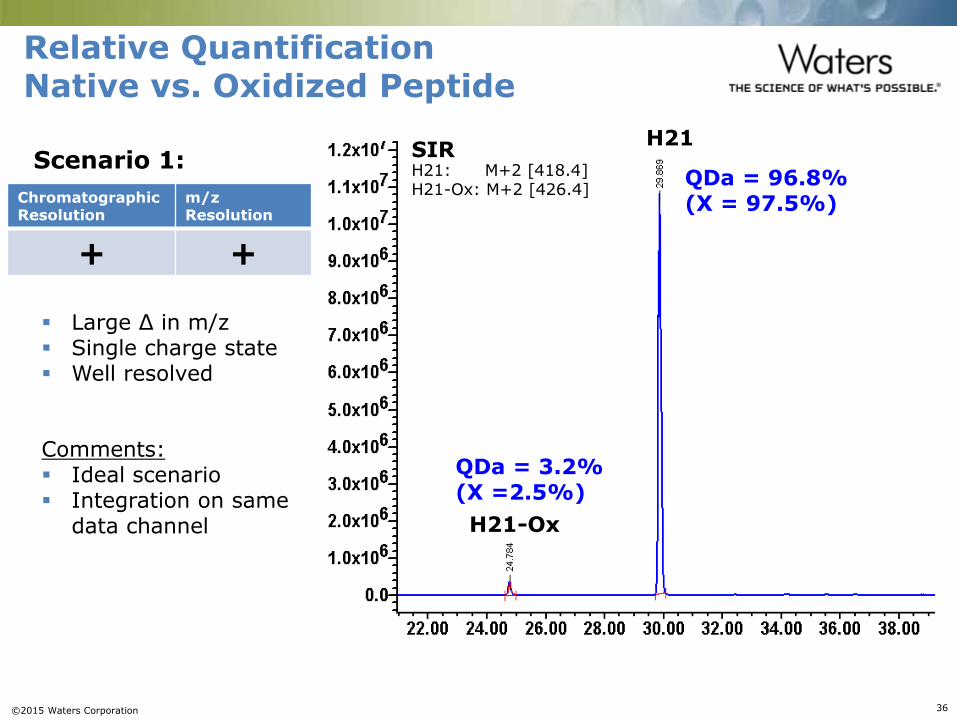
QDa = 96.8% (X = 97.5%)
QDa = 3.2%(X =2.5%)
H21
H21-Ox
SIRH21: M+2 [418.4]H21-Ox: M+2 [426.4]
Relative Quantification Native vs. Oxidized Peptide
Chromatographic Resolution
m/z Resolution
+ +
Scenario 1:
Large Δ in m/z Single charge state Well resolved
Comments: Ideal scenario Integration on same
data channel
©2015 Waters Corporation 37
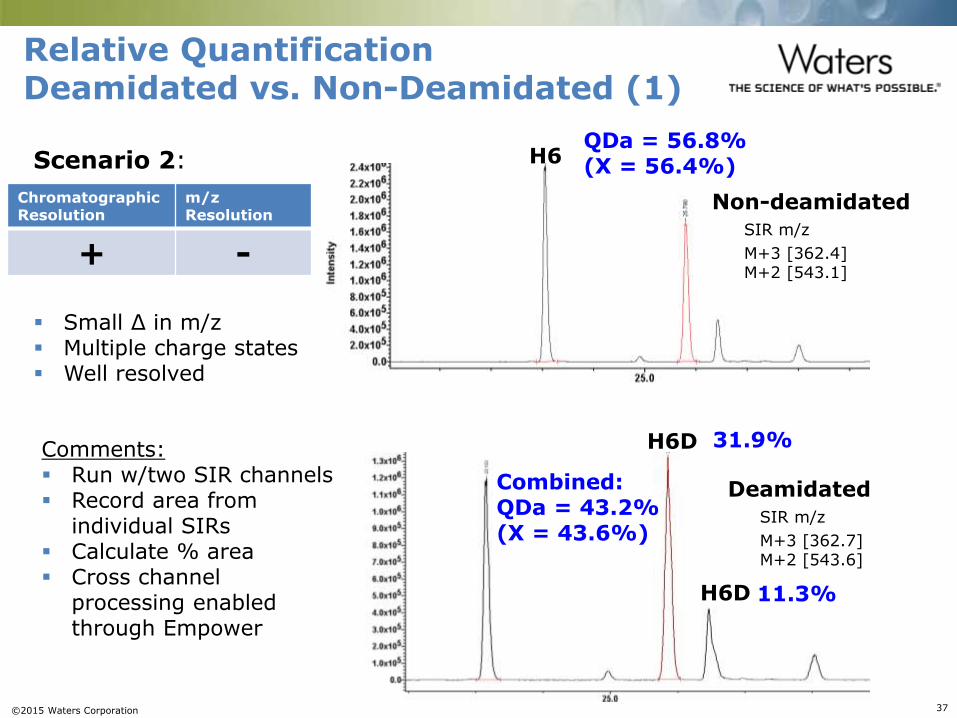
H6
Relative QuantificationDeamidated vs. Non-Deamidated (1)
H6D
H6D
SIR m/z
M+3 [362.4]M+2 [543.1]
Non-deamidated
SIR m/z
M+3 [362.7]M+2 [543.6]
DeamidatedCombined:QDa = 43.2% (X = 43.6%)
31.9%
QDa = 56.8% (X = 56.4%)
11.3%
Chromatographic Resolution
m/z Resolution
+ -
Scenario 2:
Small Δ in m/z Multiple charge states Well resolved
Comments: Run w/two SIR channels Record area from
individual SIRs Calculate % area Cross channel
processing enabled through Empower
©2015 Waters Corporation 38
Relative QuantificationDeamidated vs. Non-Deamidated (2)
Chromatographic Resolution
m/z Resolution
+ -
Scenario 2(B):
Small Δ in m/z Single charge state Well resolved
Comments: Run single SIR channel,
but with time dependant windows
Record area from individual SIRs
Calculate % area
H37
0-65 minNon-deamidated SIR: [849.2]
65-140 minDeamidated SIR: [849.6]
QDa = 89.1%(X = 89.2%)
QDa = 10.9%(X = 10.8%)H37D

©2015 Waters Corporation 39
IdeS Digest: Humira (adalimumab)
TimeFlow
(mL/min)% A % B %C % D
Initial 0.200 0 0 95 5
3.00 0.200 0 0 77 23
5.00 0.200 0 0 77 23
35.00 0.200 0 0 67 33
38.00 0.200 0 0 20 80
40.00 0.200 0 0 20 80
43.00 0.200 0 0 95 5
46.00 0.200 0 0 95 5
Mobile phase:
A: H2O, 0.1 % TFA
B: Acetonitrile, 0.1 % TFA
C: H2O, 0.1 % FA
D: Acetonitrile, 0.1 % FA
TUV
Mass
FC
Fab
FC
Fab
Notes:See speaker notes for LC-MS settings

©2015 Waters Corporation 40
IdeS Digest: Humira (2)
Focused gradient on FC fragment
1
2
3
4 5
1
2
3
4
5
©2015 Waters Corporation 41
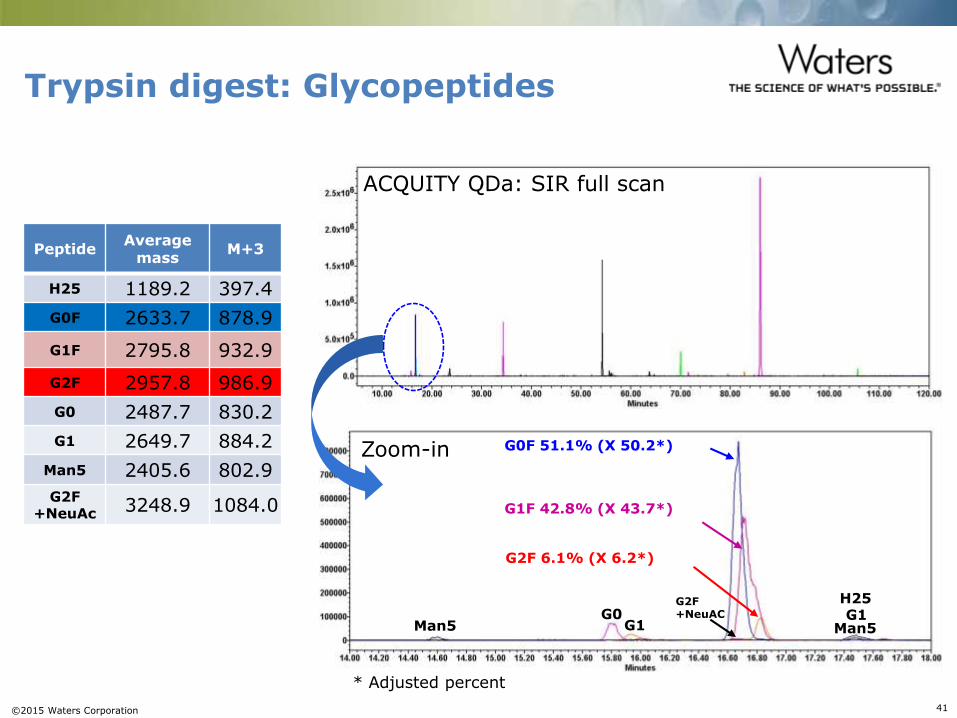
Trypsin digest: Glycopeptides
PeptideAverage
massM+3
H25 1189.2 397.4
G0F 2633.7 878.9
G1F 2795.8 932.9
G2F 2957.8 986.9
G0 2487.7 830.2
G1 2649.7 884.2
Man5 2405.6 802.9
G2F +NeuAc 3248.9 1084.0
G0F 51.1% (X 50.2*)
* Adjusted percent
G1F 42.8% (X 43.7*)
G2F 6.1% (X 6.2*)
G0G1
G1Man5 Man5
H25
Zoom-in
ACQUITY QDa: SIR full scan
G2F+NeuAC

©2015 Waters Corporation 42
Detect and monitor peptides
over a wide molecular weight
range
Quantify peptide variants with
enhanced specificity
Monitor components below
optical detector sensitivity
Selectively detect and monitor
coeluting components
Compatible with both TFA and
Formic Acid based separations
ACQUITY QDa – Fit for Purpose
When incorporated into Empower-based chromatographic workflows, the ACQUITY QDa Detector provides enhanced specificity, selectivity,
and quantification for greater productivity in biotherapeutic development, production and QC.
www.waters.com/qdabiopharm

©2015 Waters Corporation 43
More info on the ACQUITY QDA Detector for Biopharm: www.waters.com/qdabiopharm
Details on the ACQUITY QDa Detector: www.waters.com/qda