Embed Size (px)
Citation preview
FY 2006 Results
We work hard to increase the prosperity of our customers by minimizing their expenditure on quality consumer goods, through:
•Efficient use of the Company’s resources•On-going improvements in technology•Adequate compensation for our employees

Important informationThis presentation is strictly confidential to the recipient, may not be distributed to the press or any other person, and may not be reproduced in any form. Failure to comply with this restriction may constitute a violation of applicable securities laws.This presentation does not constitute or form part of and should not be construed as, an offer to sell or issue or the solicitation of an offer to buy or acquire securities of OJSC “Magnit” (the “Company”) or any of its subsidiaries in any jurisdiction or an inducement to enter into investment activity. No part of this presentation, nor the fact of its distribution, should form the basis of, or be relied on in connection with, any contract or commitment or investment decision whatsoever.The information contained in this presentation has not been independently verified. No representation, warranty or undertaking, express or implied, is made as to, and no reliance should be placed on, the fairness, accuracy, completeness or correctness of the information or the opinions contained herein. None of the Company, nor any shareholder of the Company, nor any of its or their affiliates, advisors or representatives shall have any liability whatsoever (in negligence or otherwise) for any loss howsoever arising from any use of this presentation or its contents or otherwise arising in connection with the presentation. This presentation is intended only for persons having professional experience in matters relating to investments being Relevant Persons (as defined below). Solicitations resulting from this presentation will only be responded to if the person concerned is a Relevant Person. Neither the presentation nor any copy of it may be taken or transmitted into the United States of America, its territories or possessions, or distributed, directly or indirectly, in the United States of America, its territories or possessions. Any failure to comply with this restriction may constitute a violation of United States securities laws. The presentation is not an offer of securities for sale in the United States. The Company’s securities have not been and will not be registered under the Securities Act and may not be offered and sold in the United States except in reliance on an exemption from, or in a transaction not subject to, the registration requirements of the Securities Act.Neither this presentation nor any copy of it may be taken or transmitted into Australia, Canada or Japan or to Canadian persons or to any person in any of those jurisdictions. Any failure to comply with this restriction may constitute a violation of Australian, Canadian or Japanese securities law. The distribution of this presentation in other jurisdictions may be restricted by law and persons into whose possession this document comes should inform themselves about, and observe, any such restrictions. The Company has not registered and does not intend to register any portion the Offering under the applicable securities laws of Canada, Australia or Japan and, subject to certain exceptions, the shares may not be offered or sold within Canada, Australia or Japan or to any national, resident or citizen of Canada, Australia or Japan.
2
Australia or Japan or to any national, resident or citizen of Canada, Australia or Japan.This presentation is made to and directed only at persons in the United Kingdom having professional experience in matters relating to investments who fall within the definition of “investment professionals” in Article 19(5) of the Financial Services and Markets Act 2000 (Financial Promotions) Order 2005 (the “Order”), and to those persons to whom it can otherwise lawfully be distributed (such persons being referred to as “Relevant Persons”).Matters discussed in this presentation may constitute forward-looking statements. Forward-looking statements include statements concerning plans, objectives, goals, strategies, future events or performance, and underlying assumptions and other statements, which are other than statements of historical facts. The words “believe,” “expect,” “anticipate,” “intends,” “targets,” “estimate,” “forecast,” “project,” “will,” “may,” “should” and similar expressions identify forward-looking statements. Forward-looking statements include statements regarding: strategies, outlook and growth prospects; future plans and potential for future growth; liquidity, capital resources and capital expenditures; growth in demand for products; economic outlook and industry trends; developments of markets; the impact of regulatory initiatives; and the strength of competitors.The forward-looking statements in this presentation are based upon various assumptions, many of which are based, in turn, upon further assumptions, including without limitation, management's examination of historical operating trends, data contained in our records and other data available from third parties. Although the Company believes that these assumptions were reasonable when made, these assumptions are inherently subject to significant uncertainties and contingencies which are difficult or impossible to predict and are beyond its control and it may not achieve or accomplish these expectations, beliefs or projections. In addition, important factors that, in the view of the Company, could cause actual results to differ materially from those discussed in the forward-looking statements include the achievement of the anticipated levels of profitability, growth, cost and synergy of its recent acquisitions, the timely development and acceptance of new products, the impact of competitive pricing, the ability to obtain necessary regulatory approvals, the condition of the economy and political stability in Russia and the other markets of operations and the impact of general business and global economic conditions.Some of the information in the presentation is still in draft form and has not been legally verified and will only be finalised at the time of the Offering.Neither the Company, nor any of its agents, employees or advisors intend or have any duty or obligation to supplement, amend, update or revise any of the forward-looking statements contained in this presentation or to update or to keep current any other information contained in this presentation.The information and opinions contained in this document are provided as at the date of this presentation and are subject to change without notice.By attending this presentation and/or accepting a copy of this document, you agree to be bound by the foregoing limitations and conditions.
Company & Strategy
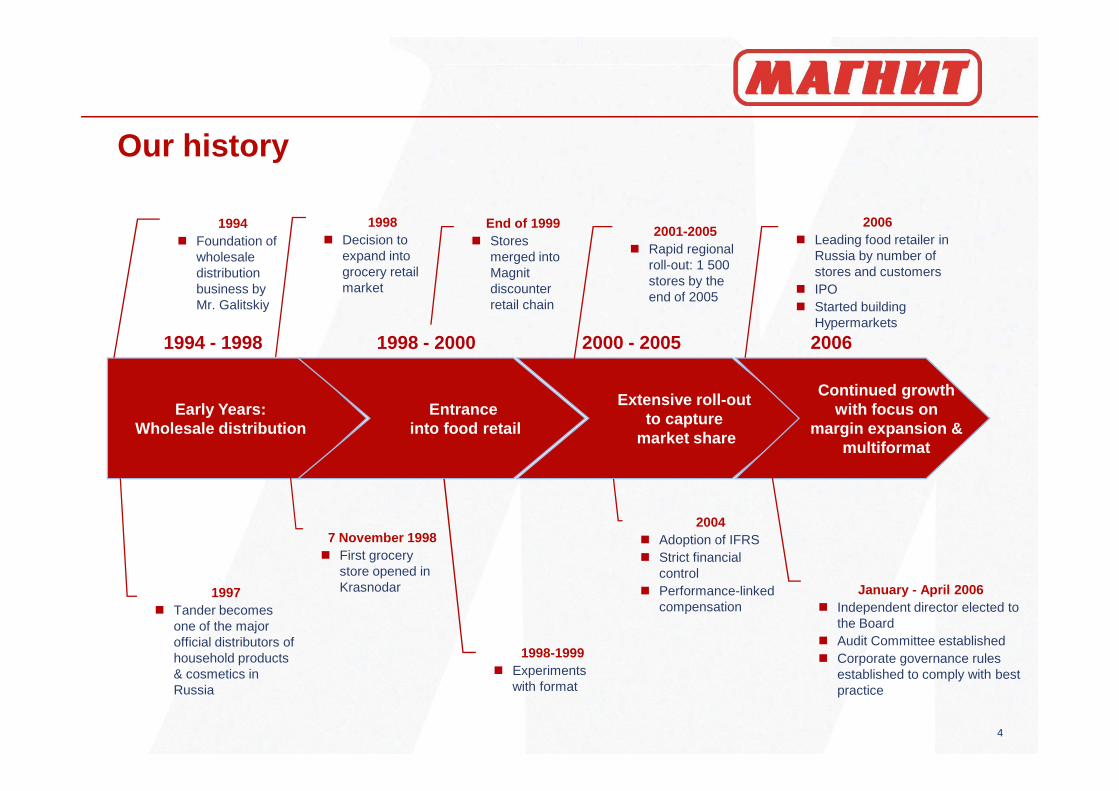
Our history
Extensive roll -outContinued growth
1994 - 1998 1998 - 2000 2000 - 2005 2006
1994� Foundation of
wholesale distribution business by Mr. Galitskiy
1998� Decision to
expand into grocery retail market
End of 1999� Stores
merged into Magnit discounter retail chain
2006� Leading food retailer in
Russia by number of stores and customers
� IPO� Started building
Hypermarkets
2001-2005� Rapid regional
roll-out: 1 500 stores by the end of 2005
4
Early Years:Wholesale distribution
Entrance into food retail
Extensive roll -outto capture
market share
Continued growthwith focus on
margin expansion &multiformat
1997� Tander becomes
one of the major official distributors of household products & cosmetics in Russia
7 November 1998� First grocery
store opened in Krasnodar
1998-1999� Experiments
with format
2004� Adoption of IFRS� Strict financial
control� Performance-linked
compensationJanuary - April 2006
� Independent director elected to the Board
� Audit Committee established� Corporate governance rules
established to comply with best practice
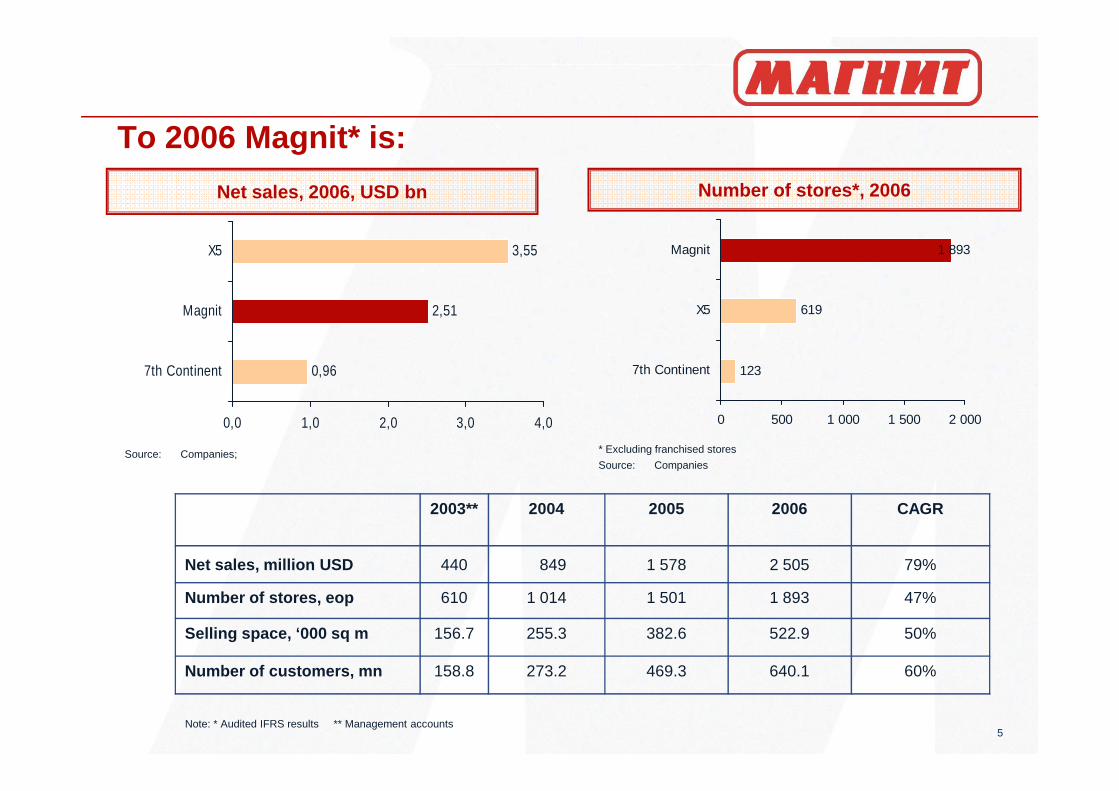
123
619
1 893
7th Continent
X5
Magnit
Number of stores*, 2006 Net sales, 2006, USD bn
0,96
2,51
3,55
7th Continent
Magnit
X5
To 2006 Magnit* is:
5
2003** 2004 2005 2006 CAGR
Net sales, million USD 440 849 1 578 2 505 79%
Number of stores, eop 610 1 014 1 501 1 893 47%
Selling space, ‘000 sq m 156.7 255.3 382.6 522.9 50%
Number of customers, mn 158.8 273.2 469.3 640.1 60%
Note: * Audited IFRS results ** Management accounts
0 500 1 000 1 500 2 000
Source: Companies
* Excluding franchised stores
0,0 1,0 2,0 3,0 4,0
Source: Companies;

Opportunities
� Our considerable experience in food retail, economies of scale, highly sophisticated in-house logistics system and other competitive advantages will help us to succeed in other food retail segments
Further expansion of the core business
� Strengthen our position in the regional markets (mainly in the cities with population of less then 500 000 people) using the advantages of our in-house logistics system
Current format and hypermarket sector
6
� Continue Investment in IT and cost saving equipment� Own Label Products� Further development of in-house logistics system� Closer communication with our customers and immediate response to changes in their tastes, preferences and needs e.g. new or improved products
Total quality management � Apply quality to every aspect of our business
Further product and process innovation
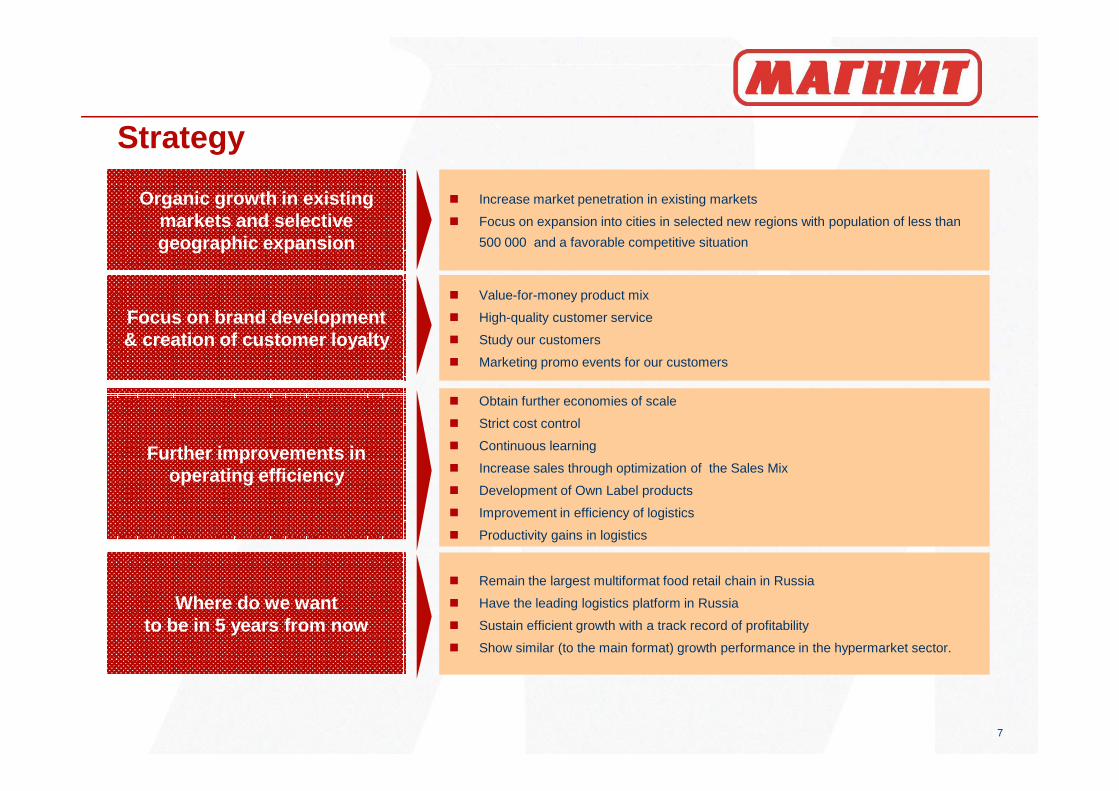
Strategy
� Increase market penetration in existing markets
� Focus on expansion into cities in selected new regions with population of less than
500 000 and a favorable competitive situation
Organic growth in existing markets and selective geographic expansion
� Obtain further economies of scale
Focus on brand development & creation of customer loyalty
� Value-for-money product mix
� High-quality customer service
� Study our customers
� Marketing promo events for our customers
7
� Obtain further economies of scale
� Strict cost control
� Continuous learning
� Increase sales through optimization of the Sales Mix
� Development of Own Label products
� Improvement in efficiency of logistics
� Productivity gains in logistics
Further improvements in operating efficiency
� Remain the largest multiformat food retail chain in Russia
� Have the leading logistics platform in Russia
� Sustain efficient growth with a track record of profitability
� Show similar (to the main format) growth performance in the hypermarket sector.
Where do we want to be in 5 years from now

Business Overview

Main Format features
Typical Magnit storesKey features
� Best prices for 200 indicative SKUs in the local market
� Active price communication by priority shelving of special offers
Outstanding value-for-money
Convenient location
� Convenient location close to customers’ homes
� Freestanding or on the ground floor of apartment blocks
� Open 7 days a week 12 hours a day at convenient times
9
convenient times
Carefully selected
assortment
� SKU selection adjusted for local purchasing power and traditions
� 3 570 SKUs on average to capture larger audience
� Food is about 87% of retail sales� Daily perishables are 30-40% of retail sales� Own Label products
Modern functional
interior
� Functional design makes shopping quick and convenient
� Visual interior and easy navigation� Quality service� Hygienic atmosphere and modern decor
Visible exterior� Standardised design of facade� Clearly visible� Easy access by car
Optimal size� 410 sq. m total space as of FY2006� 276 sq. m. trading space as of FY2006
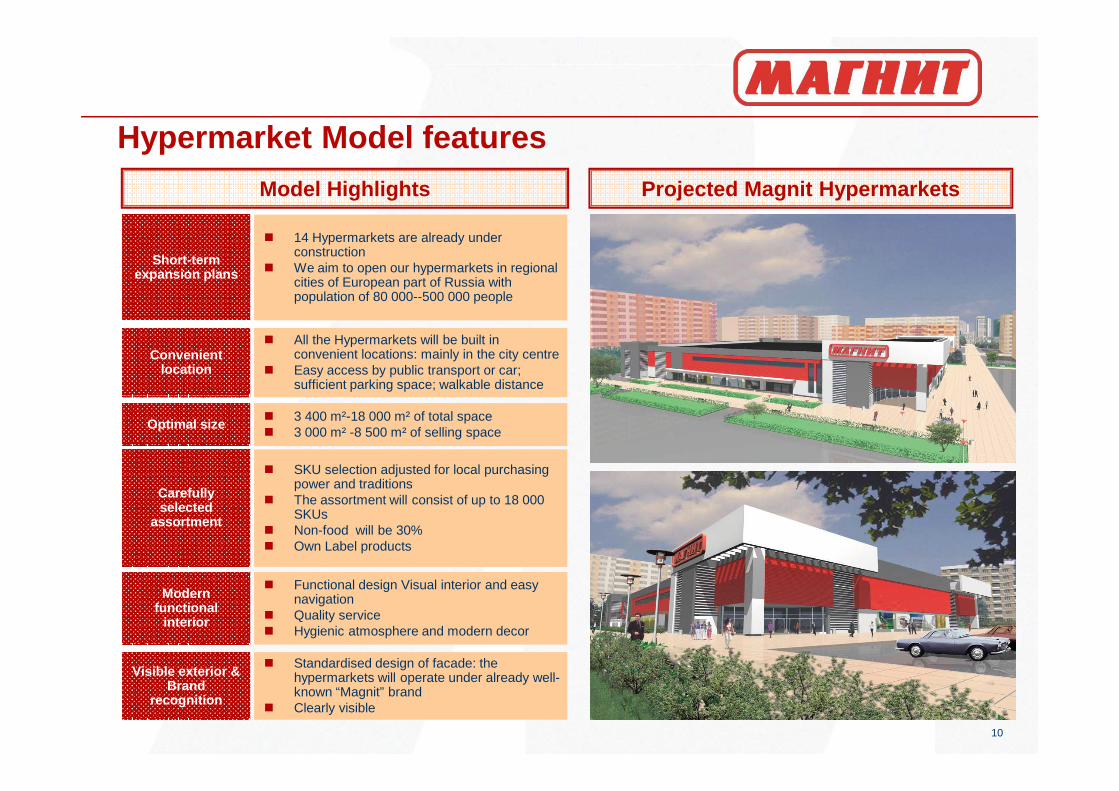
Hypermarket Model features
Projected Magnit HypermarketsModel Highlights
� 14 Hypermarkets are already under construction
� We aim to open our hypermarkets in regional cities of European part of Russia with population of 80 000--500 000 people
Short-term expansion plans
Convenient location
� All the Hypermarkets will be built in convenient locations: mainly in the city centre
� Easy access by public transport or car; sufficient parking space; walkable distance
10
Carefully selected
assortment
� SKU selection adjusted for local purchasing power and traditions
� The assortment will consist of up to 18 000 SKUs
� Non-food will be 30%� Own Label products
Modern functional
interior
� Functional design Visual interior and easy navigation
� Quality service� Hygienic atmosphere and modern decor
Visible exterior & Brand
recognition
� Standardised design of facade: the hypermarkets will operate under already well-known “Magnit” brand
� Clearly visible
Optimal size� 3 400 m²-18 000 m² of total space� 3 000 m² -8 500 m² of selling space
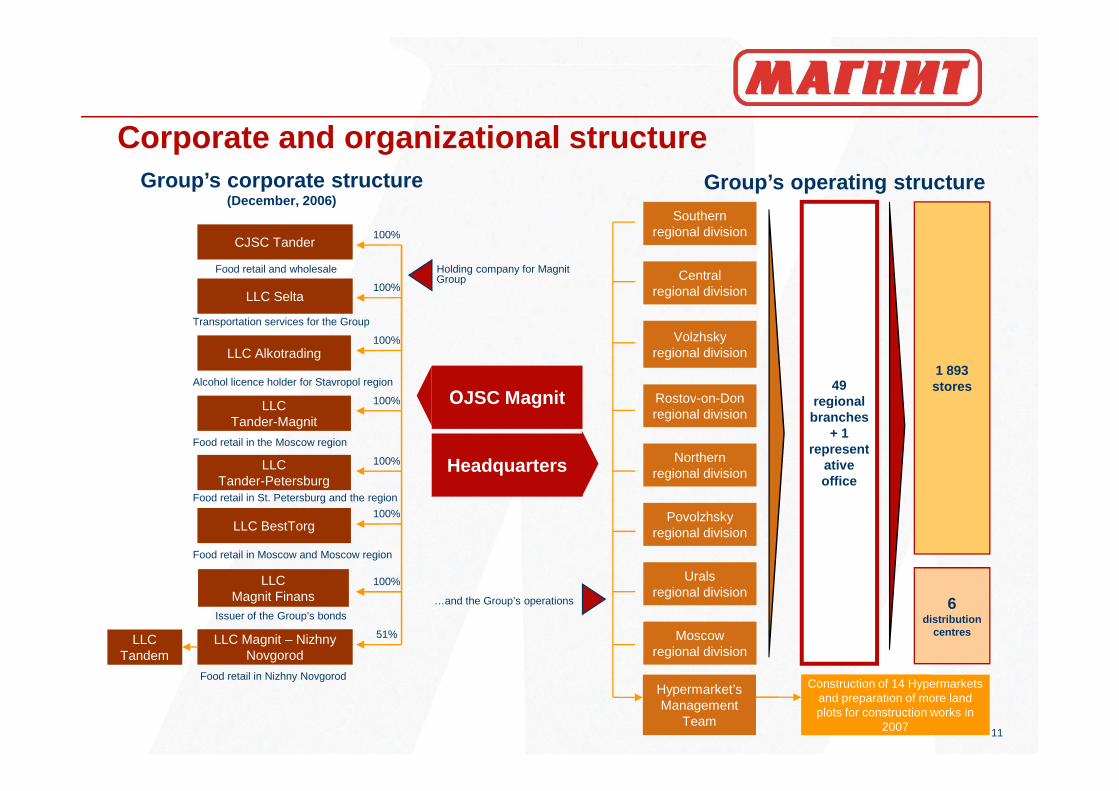
Corporate and organizational structure
ОJSC Magnit
LLC Selta
CJSC Tander
LLC Alkotrading
Food retail and wholesale Holding company for Magnit Group
Transportation services for the Group
Alcohol licence holder for Stavropol region
Volzhsky regional division
Rostov-on-Don
Centralregional division
Southernregional division
49regional
1 893 stores
Group’s corporate structure(December, 2006)
Group’s operating structure
100%
100%
100%
100%
11
ОJSC Magnit
LLCMagnit Finans
LLC Magnit – Nizhny Novgorod
LLCTander-Magnit
LLC BestTorg
LLCTander-Petersburg
LLCTandem
Issuer of the Group’s bonds
Food retail in Moscow and Moscow region
Food retail in the Moscow region
Food retail in St. Petersburg and the region
Food retail in Nizhny Novgorod
…and the Group’s operations
Rostov-on-Don regional division
Northernregional division
Povolzhskyregional division
Uralsregional division
Moscowregional division
regional branches
+ 1 represent
ative office
6 distribution
centres
100%
51%
Hypermarket’sManagement
Team6 Hypermarkets
Construction of 14 Hypermarkets and preparation of more land plots for construction works in
2007
100%
100%
100% Headquarters

Strong regional coverage FY2006
Demographical breakdown of store locations Store portfolio by Federal district
Central; 24.4%
North-Western; 4.4%
Volga; 28.4%Southern ; 41.3%
Urals; 1.5%
1 million + residents;
8.6%
100-500 thousand residents;
500-1000 thousand residents;
21.1%
up to 100 thousand residents;
43.1%
12
Volga Federal district:
538 stores
2 Distribution centres
North-Western Federal district:
84 storesCentral Federal district:
461 stores
3 Distribution centres
Southern Federal district:
782 stores
1 Distribution centre
Urals Federal district:
28 stores
Source: Company data
Source: Company data
Central; 24.4%residents;
27.3%Source: Company data
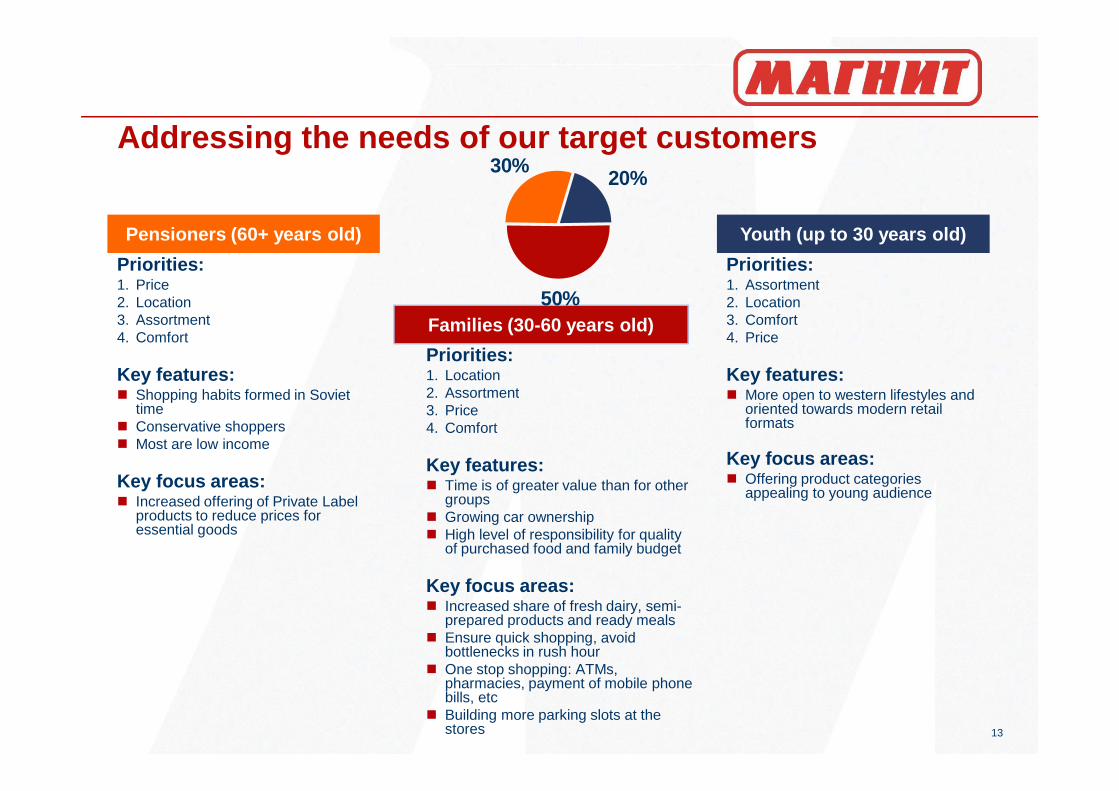
Addressing the needs of our target customers
Youth (up to 30 years old)Pensioners (60+ years old)
Families (30-60 years old)
Priorities:1. Assortment2. Location3. Comfort4. Price
Key features:� More open to western lifestyles and
Priorities:1. Price2. Location3. Assortment4. Comfort
Key features:� Shopping habits formed in Soviet
Priorities:1. Location2. Assortment
20%
50%
30%
13
� More open to western lifestyles and oriented towards modern retail formats
Key focus areas:� Offering product categories
appealing to young audience
� Shopping habits formed in Soviet time
� Conservative shoppers� Most are low income
Key focus areas:� Increased offering of Private Label
products to reduce prices for essential goods
2. Assortment3. Price4. Comfort
Key features:� Time is of greater value than for other
groups� Growing car ownership� High level of responsibility for quality
of purchased food and family budget
Key focus areas:� Increased share of fresh dairy, semi-
prepared products and ready meals� Ensure quick shopping, avoid
bottlenecks in rush hour� One stop shopping: ATMs,
pharmacies, payment of mobile phone bills, etc
� Building more parking slots at the stores

Assortment selection
73,2%
96,8%
96,7%
19,4%
26,7%
16,5%
20,3%
96,9%
0% 20% 40% 60% 80% 100%
Fresh categories
Salads
Chilled chicken
Fish
Grilled chicken and meat
Chilled meat
Bakery
Ready made meals
Assortment structure, FY2006Share of stores offering fresh and
value-added products, FY200624,9%
15,6%15,0%
9,9%6,7%
6,2%5,7%
3,6%3,9%
2,8%2,0%
1,5%1,1%1,1%
Alcohol, soft-drinks and beveragesMeat and meat products
Dairy productsConfectionary
CosmeticsFruit and vegetables
Bread and flourHousehold chemistry
Fish and fish productsFat products
Baby food and instant mealsOther household goods
EggsNon-core products
14
Source: Company data Source: Company data
Assortment correlates with customers’ purchasing p ower
Source: Company data
up to 4000 roubles
4000 - 4500 roubles
4500 - 5000 roubles
5000 + roubles
Mon
thly
hou
seho
ld s
pend
ing
on f
ood
and
beve
rage
s
Dry and frozen products,
vegetables, fruit
Shorter life products , salads, grill, bakery
Shorter life products,salads, grill, bakery
Shorter life products ,
salads, grill, bakeryReady meals, fresh
meatSemi-finished
products, cakes
Semi-finishedproducts, cakes
Dry and frozen products,
vegetables, fruit
Dry and frozen products,
vegetables, fruit
Dry and frozenproducts,
vegetables, fruit
0% 5% 10% 15% 20% 25% 30%
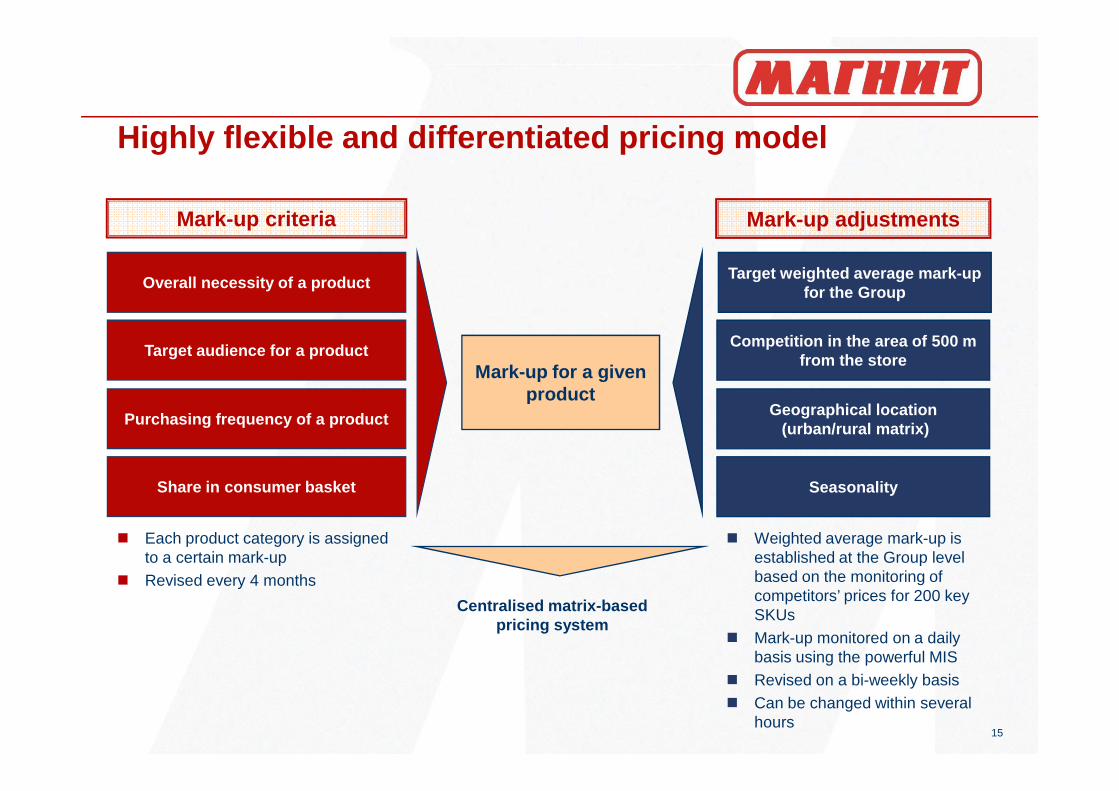
Highly flexible and differentiated pricing model
Mark-up for a given product
Overall necessity of a product
Target audience for a product
Target weighted average mark-up for the Group
Competition in the area of 500 m from the store
Mark-up criteria Mark-up adjustments
15
productPurchasing frequency of a product
Share in consumer basket
Geographical location(urban/rural matrix)
� Each product category is assigned to a certain mark-up
� Revised every 4 months
� Weighted average mark-up is established at the Group level based on the monitoring of competitors’ prices for 200 key SKUs
� Mark-up monitored on a daily basis using the powerful MIS
� Revised on a bi-weekly basis� Can be changed within several
hours
Seasonality
Centralised matrix-basedpricing system
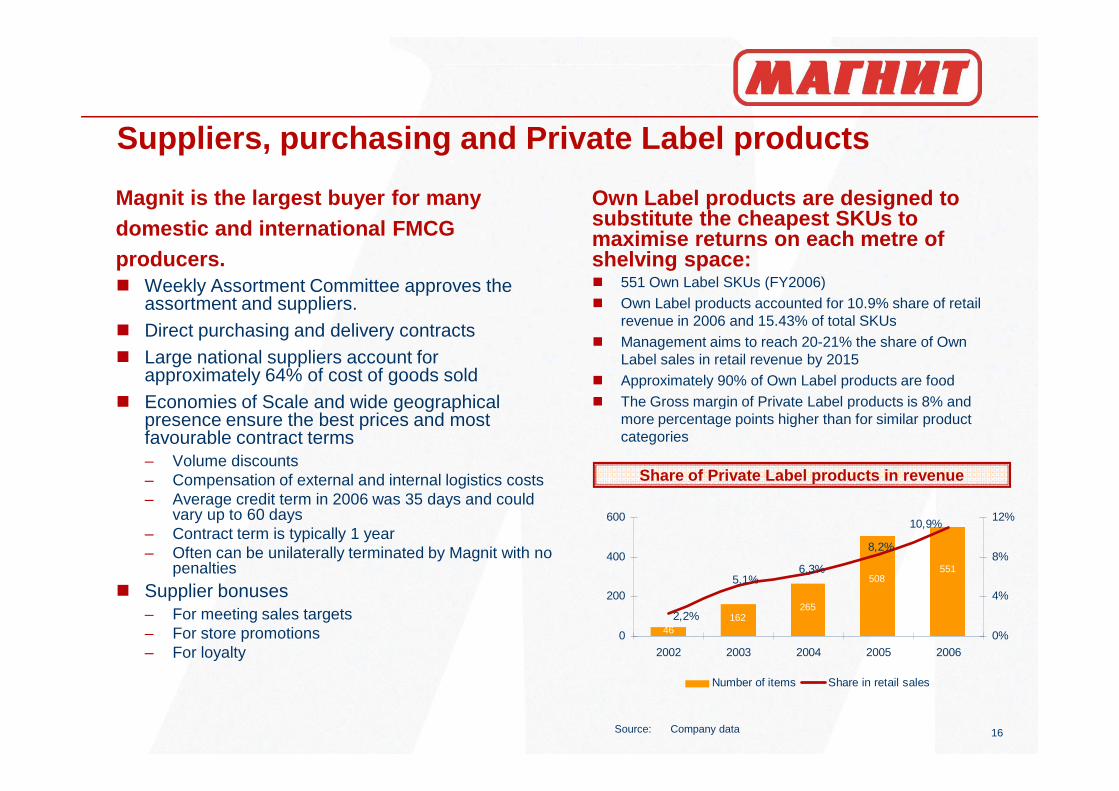
Suppliers, purchasing and Private Label products
Magnit is the largest buyer for many domestic and international FMCG producers.� Weekly Assortment Committee approves the
assortment and suppliers.� Direct purchasing and delivery contracts� Large national suppliers account for
approximately 64% of cost of goods sold� Economies of Scale and wide geographical
Own Label products are designed to substitute the cheapest SKUs to maximise returns on each metre of shelving space:� 551 Own Label SKUs (FY2006)� Own Label products accounted for 10.9% share of retail
revenue in 2006 and 15.43% of total SKUs� Management aims to reach 20-21% the share of Own
Label sales in retail revenue by 2015� Approximately 90% of Own Label products are food � The Gross margin of Private Label products is 8% and
16
� Economies of Scale and wide geographical presence ensure the best prices and most favourable contract terms– Volume discounts– Compensation of external and internal logistics costs– Average credit term in 2006 was 35 days and could
vary up to 60 days– Contract term is typically 1 year– Often can be unilaterally terminated by Magnit with no
penalties
� Supplier bonuses– For meeting sales targets– For store promotions– For loyalty
� The Gross margin of Private Label products is 8% and more percentage points higher than for similar product categories
Share of Private Label products in revenue
Source: Company data
46162
265
508551
5,1%6,3%
8,2%
10,9%
2,2%
0
200
400
600
2002 2003 2004 2005 2006
0%
4%
8%
12%
Number of items Share in retail sales
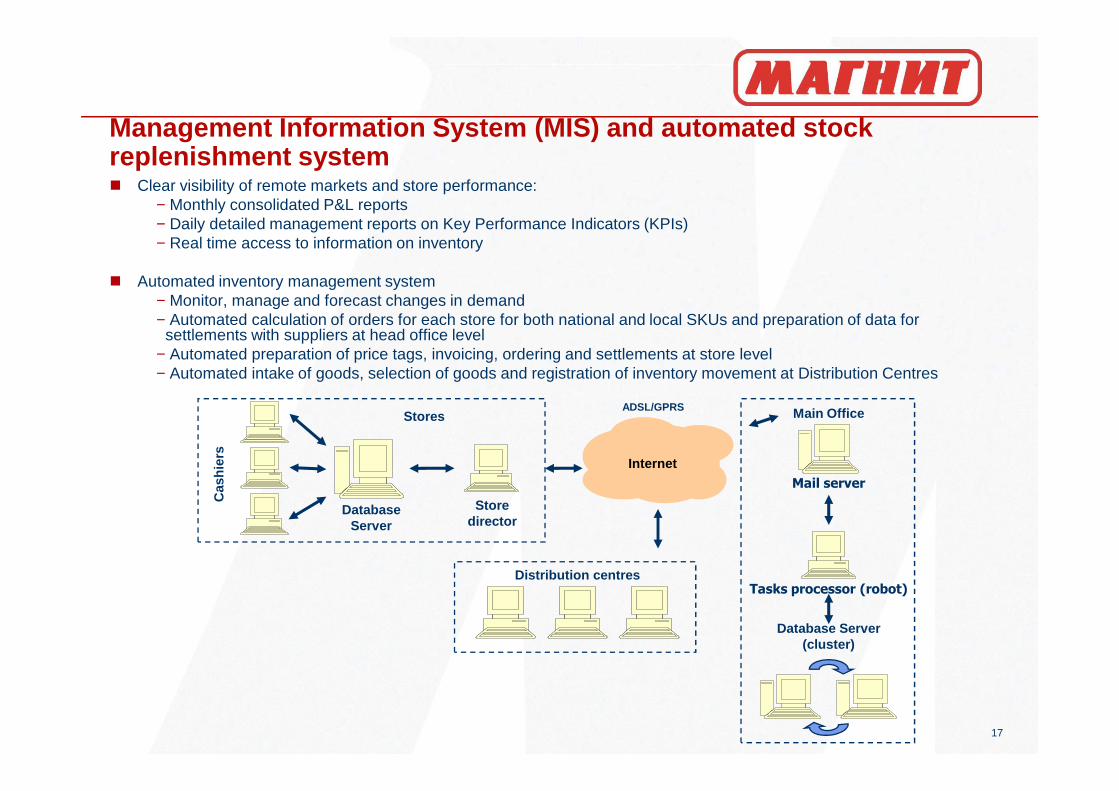
Management Information System (MIS) and automated s tock replenishment system� Clear visibility of remote markets and store performance:
− Monthly consolidated P&L reports− Daily detailed management reports on Key Performance Indicators (KPIs)− Real time access to information on inventory
� Automated inventory management system− Monitor, manage and forecast changes in demand− Automated calculation of orders for each store for both national and local SKUs and preparation of data for
settlements with suppliers at head office level− Automated preparation of price tags, invoicing, ordering and settlements at store level − Automated intake of goods, selection of goods and registration of inventory movement at Distribution Centres
17
Cas
hier
s
Internet
Database Server
Store director
Mail server
ADSL/GPRS
Database Server (cluster)
Distribution centresTasks processor (robot)
Main OfficeStores
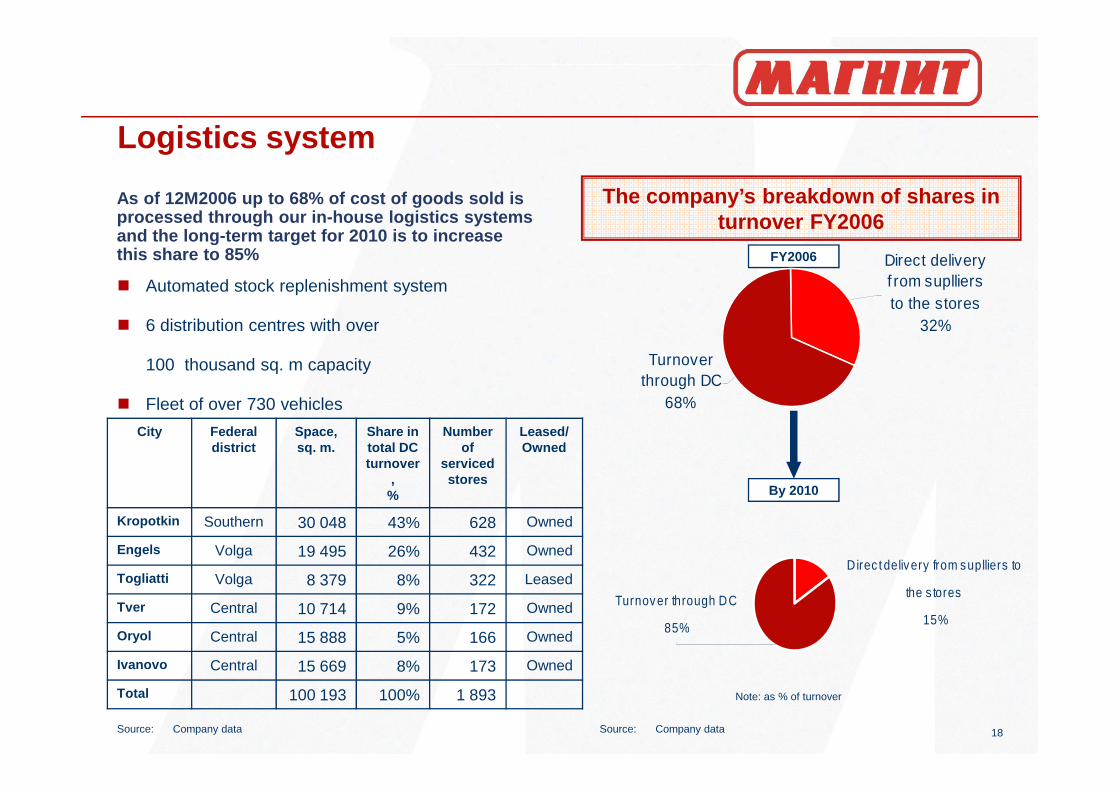
Logistics system
As of 12M2006 up to 68% of cost of goods sold is processed through our in-house logistics systems and the long-term target for 2010 is to increase this share to 85%
� Automated stock replenishment system
� 6 distribution centres with over
100 thousand sq. m capacity
� Fleet of over 730 vehicles
The company’s breakdown of shares in turnover FY2006
FY2006
Turnover through DC
68%
Direct delivery f rom suplliers to the stores
32%
18
City Federal district
Space, sq. m.
Share in total DC turnover
, %
Number of
serviced stores
Leased/Owned
Kropotkin Southern 30 048 43% 628 Owned
Engels Volga 19 495 26% 432 Owned
Togliatti Volga 8 379 8% 322 Leased
Tver Central 10 714 9% 172 Owned
Oryol Central 15 888 5% 166 Owned
Ivanovo Central 15 669 8% 173 Owned
Total 100 193 100% 1 893
� Fleet of over 730 vehicles
Note: as % of turnover
By 2010
68%
Source: Company data Source: Company data
Direc t delivery from suplliers to
the s tores
15%Turnover through DC
85%
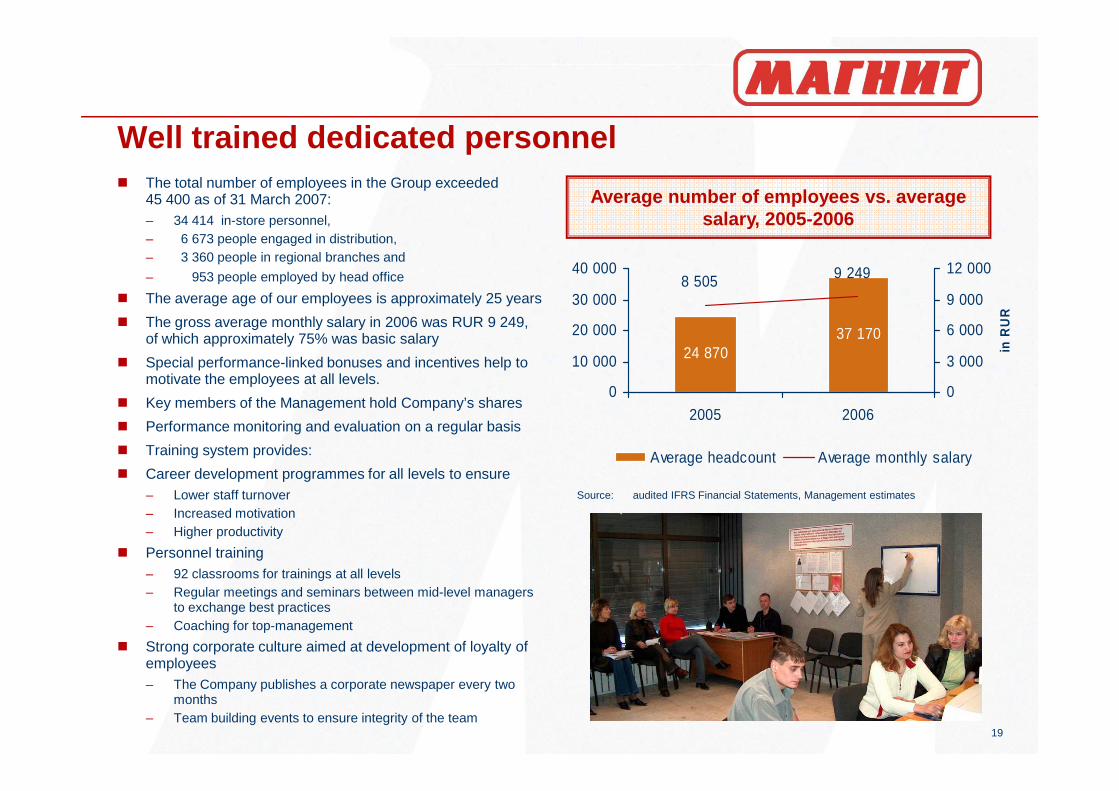
Well trained dedicated personnel� The total number of employees in the Group exceeded
45 400 as of 31 March 2007:– 34 414 in-store personnel, – 6 673 people engaged in distribution, – 3 360 people in regional branches and
– 953 people employed by head office
� The average age of our employees is approximately 25 years
� The gross average monthly salary in 2006 was RUR 9 249, of which approximately 75% was basic salary
� Special performance-linked bonuses and incentives help to motivate the employees at all levels.
� Key members of the Management hold Company’s shares
Average number of employees vs. average salary, 2005-2006
24 87037 170
9 2498 505
0
10 000
20 000
30 000
40 000
0
3 000
6 000
9 000
12 000
in R
UR
19
� Key members of the Management hold Company’s shares
� Performance monitoring and evaluation on a regular basis
� Training system provides:
� Career development programmes for all levels to ensure– Lower staff turnover– Increased motivation– Higher productivity
� Personnel training– 92 classrooms for trainings at all levels– Regular meetings and seminars between mid-level managers
to exchange best practices– Coaching for top-management
� Strong corporate culture aimed at development of loyalty of employees– The Company publishes a corporate newspaper every two
months– Team building events to ensure integrity of the team
0
2005 2006
0
Average headcount Average monthly salary
Source: audited IFRS Financial Statements, Management estimates
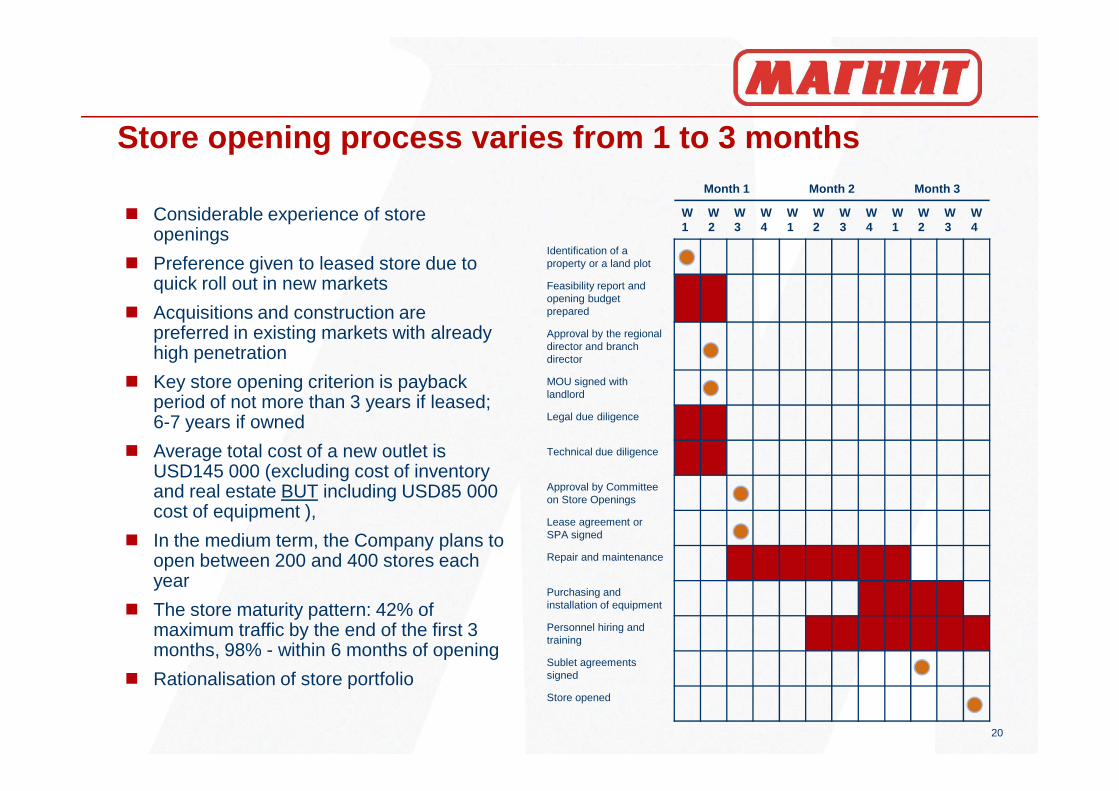
Store opening process varies from 1 to 3 monthsMonth 1 Month 2 Month 3
W1
W2
W3
W4
W1
W2
W3
W4
W1
W2
W3
W4
Identification of a property or a land plot
Feasibility report and opening budget prepared
Approval by the regional director and branch director
MOU signed with landlord
� Considerable experience of store openings
� Preference given to leased store due to quick roll out in new markets
� Acquisitions and construction are preferred in existing markets with already high penetration
� Key store opening criterion is payback period of not more than 3 years if leased;
20
landlord
Legal due diligence
Technical due diligence
Approval by Committee on Store Openings
Lease agreement or SPA signed
Repair and maintenance
Purchasing and installation of equipment
Personnel hiring and training
Sublet agreements signed
Store opened
period of not more than 3 years if leased; 6-7 years if owned
� Average total cost of a new outlet is USD145 000 (excluding cost of inventory and real estate BUT including USD85 000 cost of equipment ),
� In the medium term, the Company plans to open between 200 and 400 stores each year
� The store maturity pattern: 42% of maximum traffic by the end of the first 3 months, 98% - within 6 months of opening
� Rationalisation of store portfolio
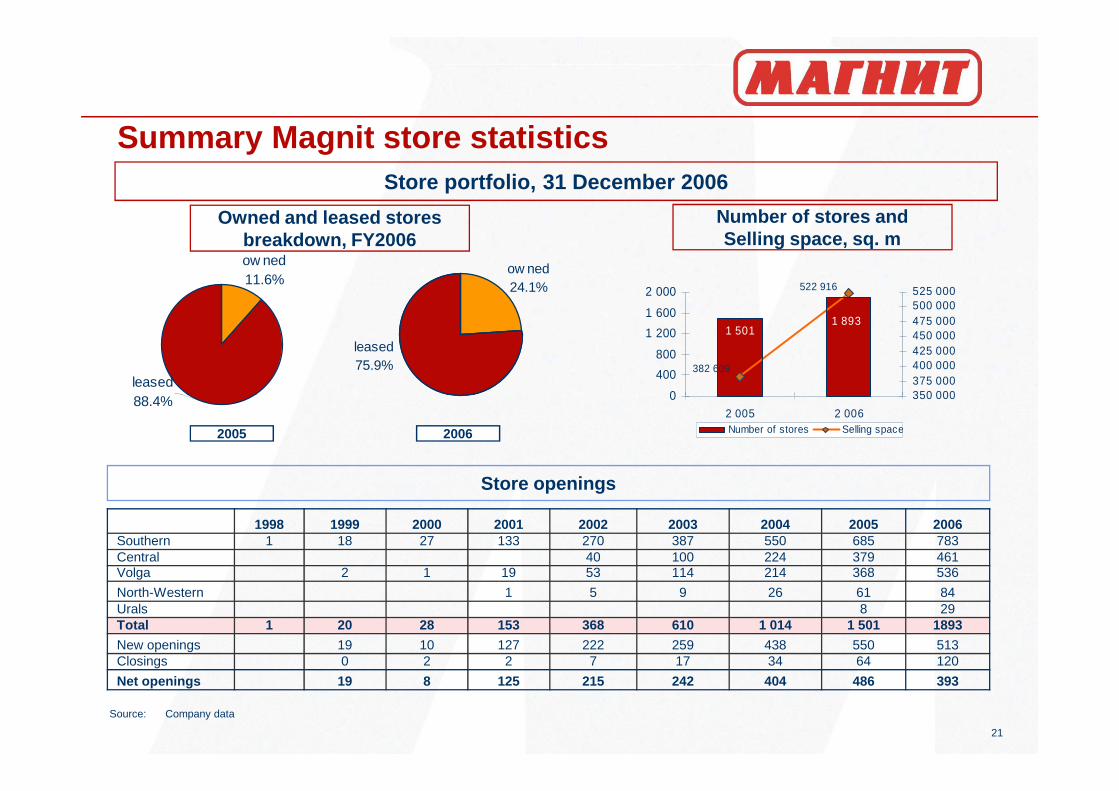
ow ned24.1%
leased75.9%
Summary Magnit store statistics
ow ned11.6%
leased88.4%
Store portfolio, 31 December 2006
Owned and leased stores breakdown, FY2006
Number of stores and Selling space, sq. m
1 8931 501
382 609
522 916
0
400
800
1 200
1 600
2 000
350 000375 000400 000425 000450 000475 000500 000525 000
21
1998 1999 2000 2001 2002 2003 2004 2005 2006Southern 1 18 27 133 270 387 550 685 783Central 40 100 224 379 461Volga 2 1 19 53 114 214 368 536
North-Western 1 5 9 26 61 84Urals 8 29Total 1 20 28 153 368 610 1 014 1 501 1893
New openings 19 10 127 222 259 438 550 513Closings 0 2 2 7 17 34 64 120
Net openings 19 8 125 215 242 404 486 393
88.4%
Store openings
Source: Company data
2005 2006
02 005 2 006
350 000
Number of stores Selling space
Operating and financial results
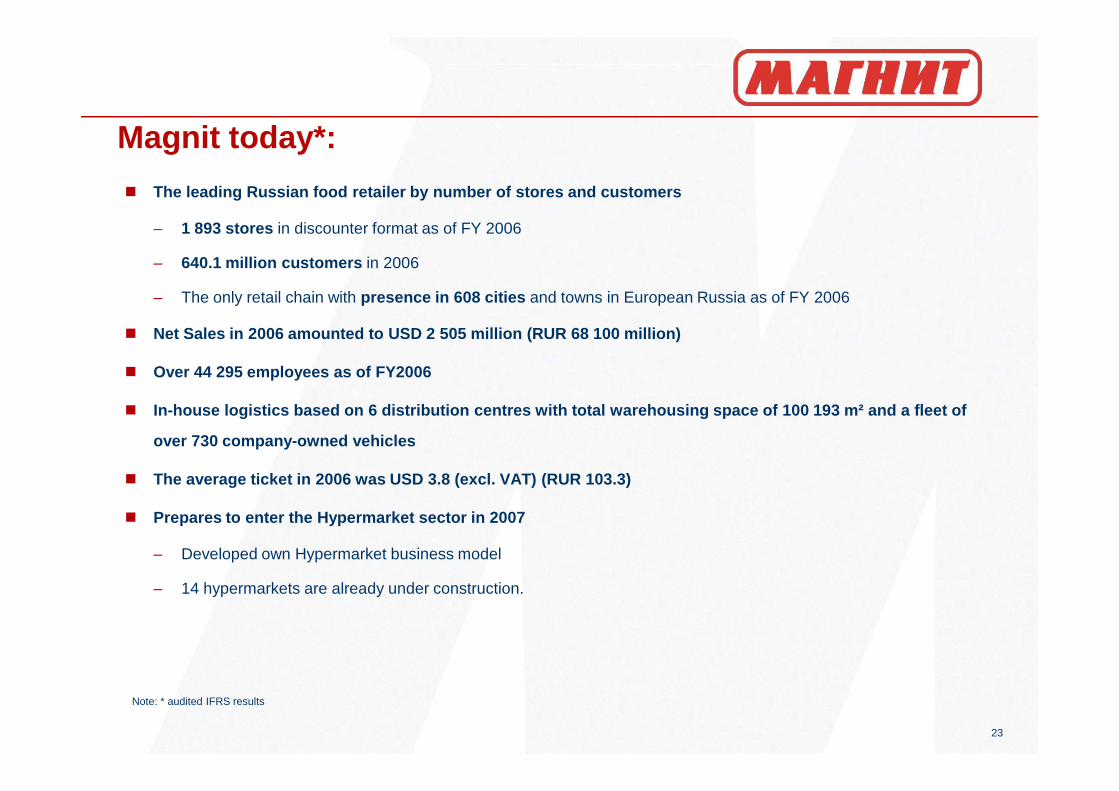
Magnit today*:
� The leading Russian food retailer by number of stor es and customers
– 1 893 stores in discounter format as of FY 2006
– 640.1 million customers in 2006
– The only retail chain with presence in 608 cities and towns in European Russia as of FY 2006
� Net Sales in 2006 amounted to USD 2 505 million (RUR 68 100 million)
� Over 44 295 employees as of FY2006
23
� In-house logistics based on 6 distribution centres with total warehousing space of 100 193 m² and a fle et of
over 730 company-owned vehicles
� The average ticket in 2006 was USD 3.8 (excl. VAT) (RUR 103.3)
� Prepares to enter the Hypermarket sector in 2007
– Developed own Hypermarket business model
– 14 hypermarkets are already under construction.
Note: * audited IFRS results
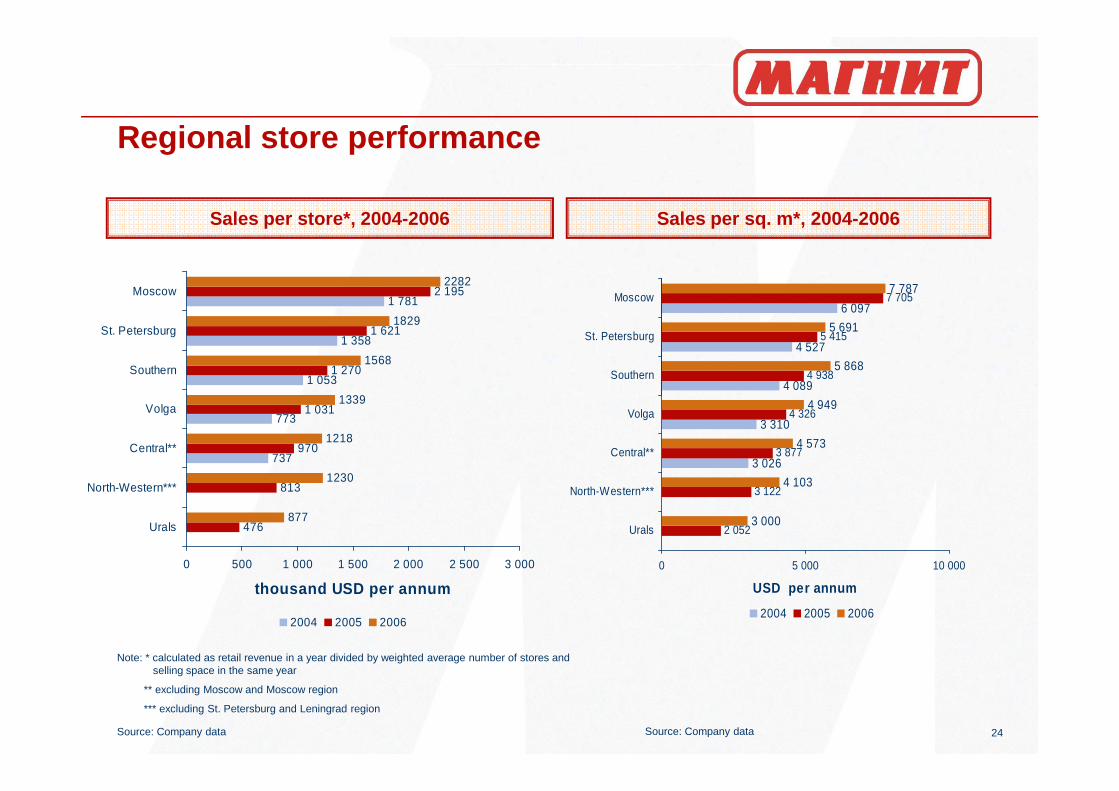
Regional store performance
1 053
1 358
1 781
1 270
1 621
2 195
1568
1339
2282
1829
Southern
St. Petersburg
Moscow
4 089
4 527
6 097
4 938
5 415
7 705
5 868
5 691
7 787
Southern
St. Petersburg
Moscow
Sales per store*, 2004-2006 Sales per sq. m*, 2004-2006
24
737
773
970
1 031
877
1230
1218
476
813
1339
0 500 1 000 1 500 2 000 2 500 3 000
Urals
North-Western***
Central**
Volga
thousand USD per annum
2004 2005 2006
3 026
3 310
3 877
4 326
3 000
4 103
4 573
4 949
3 122
2 052
0 5 000 10 000
Urals
North-Western***
Central**
Volga
USD per annum
2004 2005 2006
Source: Company data
Note: * calculated as retail revenue in a year divided by weighted average number of stores and selling space in the same year
** excluding Moscow and Moscow region
*** excluding St. Petersburg and Leningrad region
Source: Company data
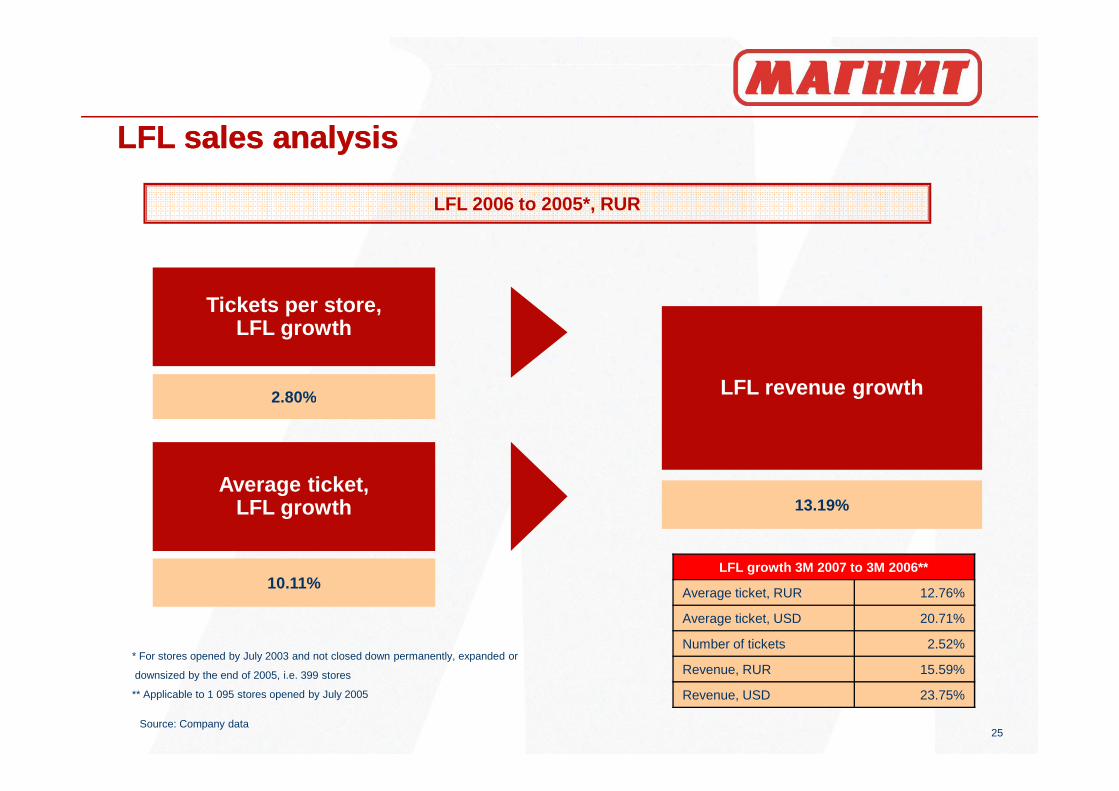
LFL sales analysis
2.80%
Tickets per store, LFL growth
LFL revenue growth
LFL 2006 to 2005*, RUR
LFL sales analysis
25
10.11%
2.80%
Average ticket, LFL growth
LFL revenue growth
13.19%
Source: Company data
* For stores opened by July 2003 and not closed down permanently, expanded or
downsized by the end of 2005, i.e. 399 stores
** Applicable to 1 095 stores opened by July 2005
LFL growth 3M 2007 to 3M 2006**
Average ticket, RUR 12.76%
Average ticket, USD 20.71%
Number of tickets 2.52%
Revenue, RUR 15.59%
Revenue, USD 23.75%

Improved operating efficiency and capital structure
Non-currentNon-current
Current assets; 60,63%
Current assets; 52,30%
20062005
In US$m FY* 2005 FY* 2006 YoY, %
net sales 1 577,7 2 505,0 58,8%
cost of goods sold (1 312,9) (2 046,2) 55,9%
gross profit 264,8 458,9 73,3%
gross margin, % 16,8% 18,3%
SG&A (185,9) (336,3) 80,9%
EBITDA 78,9 122,6 55,4%
EBITDA margin, % 5,0% 4,9%
26
Non-current assets; 39,37%
Non-current assets; 47,70%
Equity;
-12,07%Equity;
-33,80%LT Liabilities; -23,01%
LT Liabilities; -11,76%
ST liabilities; -64,92%
ST liabilities; -54,44%
*Source: audited IFRS Financial Statements
Net debt, 31.12.2006 - 165 mln. USD
Depreciation & Amortization (15,1) (29,1)
EBIT 63,8 93,5 46,5%
Net finance costs (12,9) (13,0)
Other income/(expense) (0,9) (1,0)
Profit before tax 50,0 81,5 62,8%
Taxes (13,2) (24,5)
Effective tax rate 26,4% 30,1%
Net income 36,8 56,9
Net margin, % 2,3% 2,3%
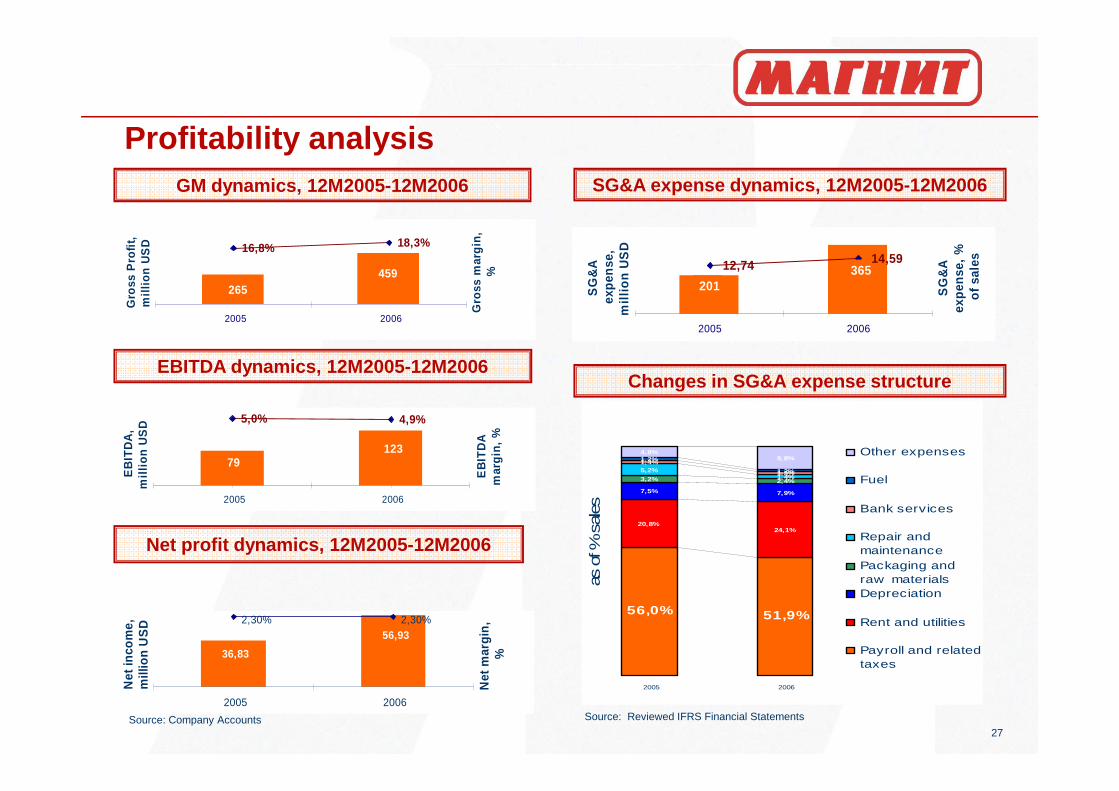
Profitability analysis
Changes in SG&A expense structure
SG&A expense dynamics, 12M2005-12M2006
EBITDA dynamics, 12M2005-12M2006
GM dynamics, 12M2005-12M2006
365 201
12,74 14,59
2005 2006
SG
&A
ex
pen
se,
mil
lio
n U
SD
SG
&A
ex
pen
se,
%
of
sale
s
459265
16,8% 18,3%
2005 2006
Gro
ss P
rofi
t,
mil
lio
n U
SD
Gro
ss m
arg
in,
%
27
Source: Reviewed IFRS Financial Statements
Net profit dynamics, 12M2005-12M2006
Source: Company Accounts
12379
5,0% 4,9%
2005 2006
EB
ITD
A,
mil
lio
n U
SD
EB
ITD
A
mar
gin
, %
36,83
56,932,30% 2,30%
2005 2006
Net
inco
me,
m
illio
n U
SD
Net
mar
gin
, %
56,0% 51,9%
20,8%24,1%
7,5% 7,9%
3,2% 2,4%
5,2%1,4%
1,4%
1,3%1,2%
4,8%9,8%1,2%
2005 2006
as o
f % s
ales
Other expenses
Fuel
Bank services
Repair andmaintenancePackaging andraw materialsDepreciation
Rent and utilities
Payroll and relatedtaxes
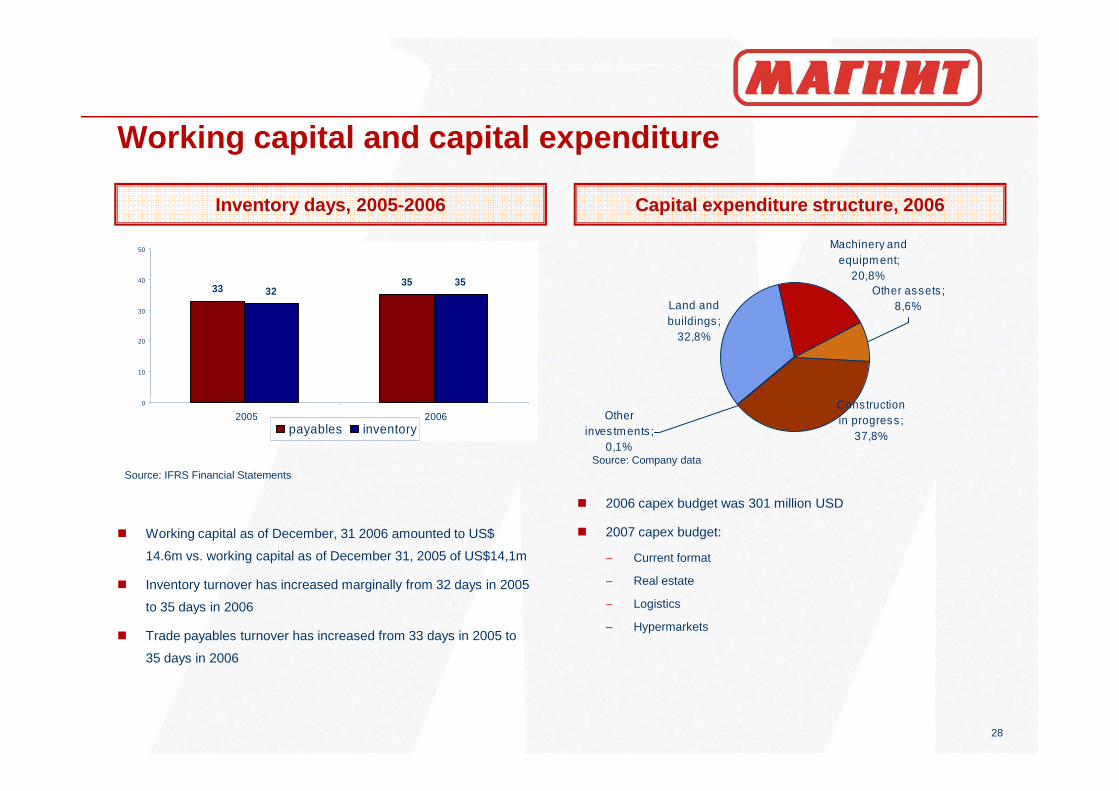
Working capital and capital expenditure
Land and buildings ;
32,8%
Machinery and equipm ent;
20,8%Other assets ;
8,6%
Capital expenditure structure, 2006Inventory days, 2005-2006
3335
3235
10
20
30
40
50
28
Construction in progress ;
37,8%
Other inves tments ;
0,1%
� Working capital as of December, 31 2006 amounted to US$
14.6m vs. working capital as of December 31, 2005 of US$14,1m
� Inventory turnover has increased marginally from 32 days in 2005
to 35 days in 2006
� Trade payables turnover has increased from 33 days in 2005 to
35 days in 2006
� 2006 capex budget was 301 million USD
� 2007 capex budget:
– Current format
– Real estate
– Logistics
– Hypermarkets
Source: Company dataSource: IFRS Financial Statements
0
2005 2006payables inventory
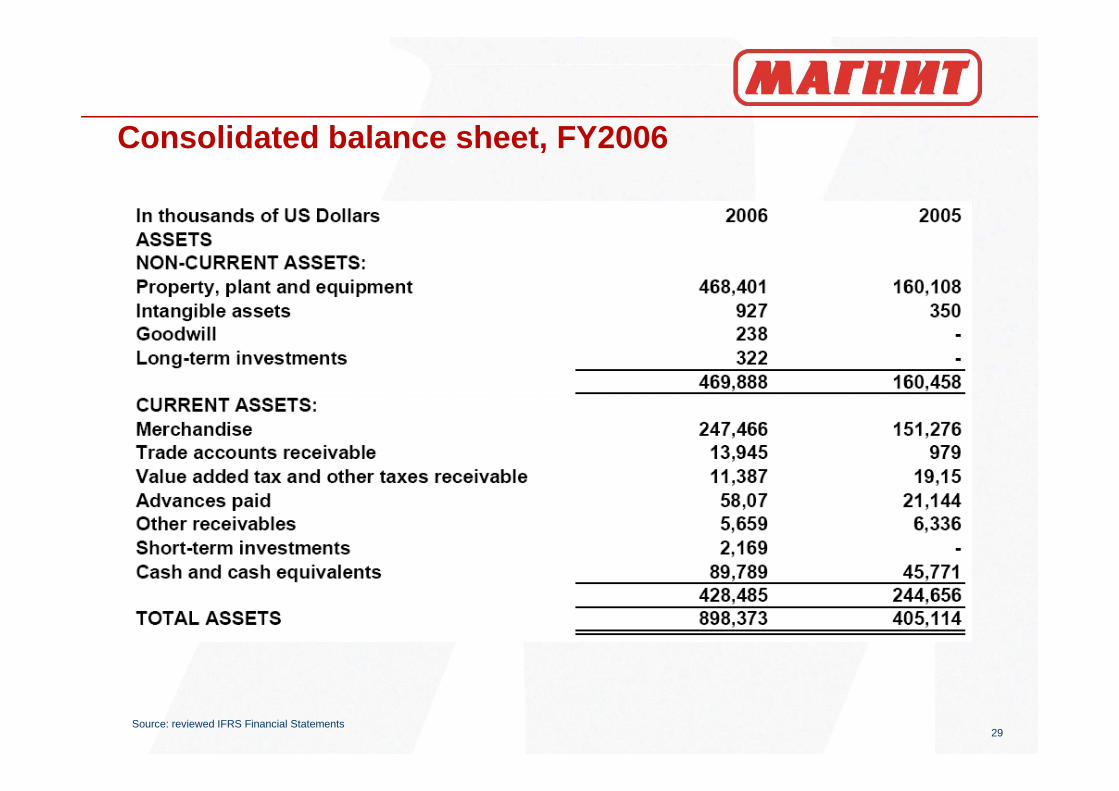
Consolidated balance sheet, FY2006
29Source: reviewed IFRS Financial Statements
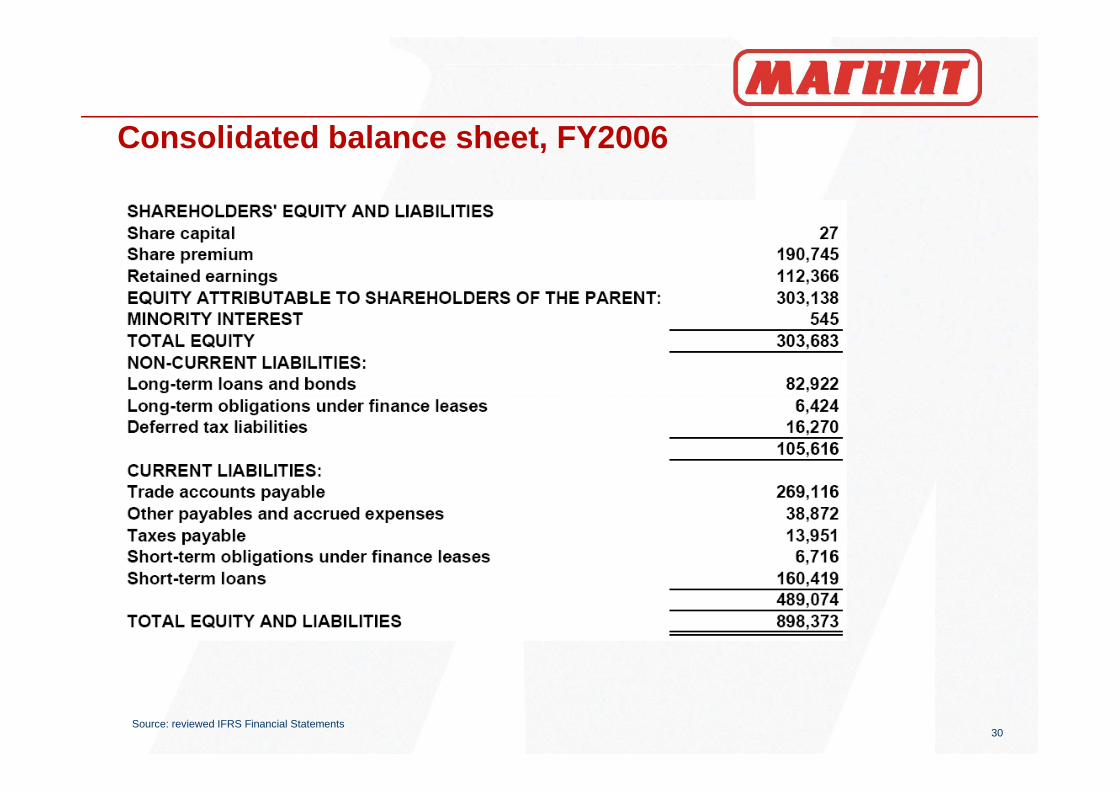
Consolidated balance sheet, FY2006
30Source: reviewed IFRS Financial Statements
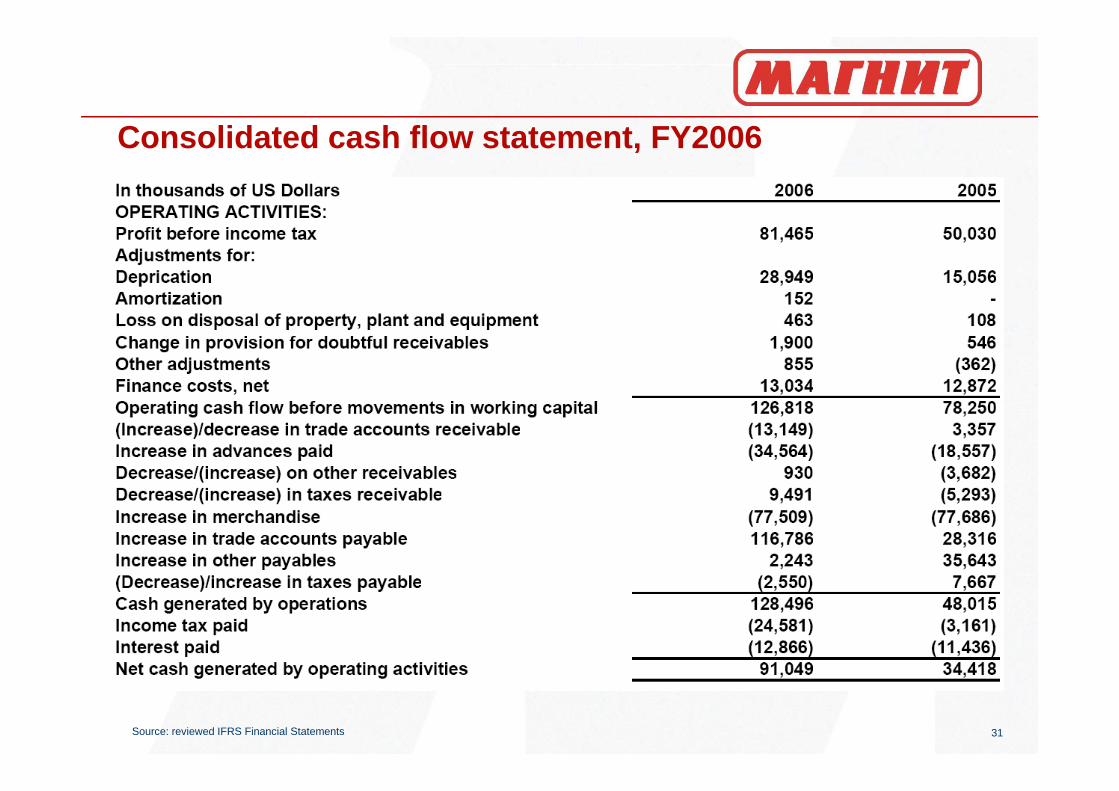
Consolidated cash flow statement, FY2006
31Source: reviewed IFRS Financial Statements
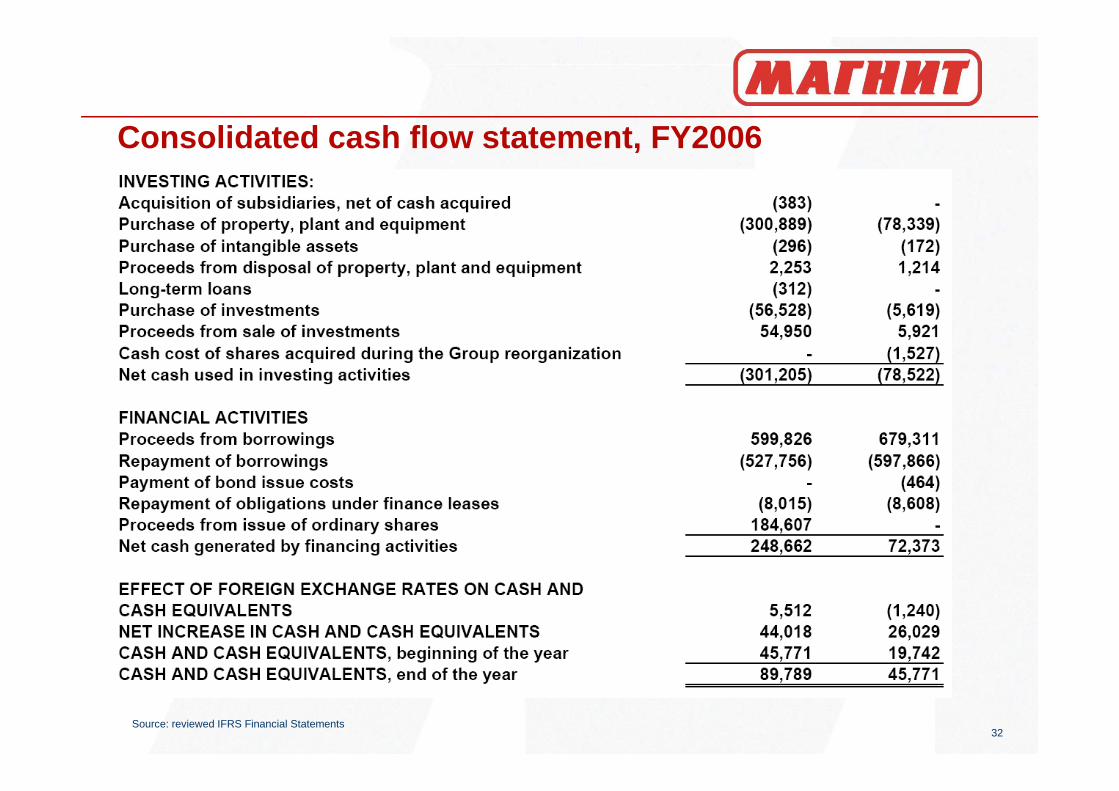
Consolidated cash flow statement, FY2006
32Source: reviewed IFRS Financial Statements


![3Q FY2006 실적보고서 070117 - Mirae Asset Daewoo · 2012-01-28 · - 2 - fy2006 3분기 실적보고서 fy2006 3q (2006년10월 ~ 2006년12월) 재무 및 영업 현황 [표2]](https://img.dokumen.tips/doc/110x75/5e417350edfce95bc3092578/3q-fy2006-eeoe-070117-mirae-asset-daewoo-2012-01-28-2-fy2006.jpg)