Embed Size (px)
Citation preview
Aniruddha LimayeRazeyeh JalaliDivya Martyn
Research report by Great Place to Work® Institute Presented to you by Edenred
Building a High Performance Workforce : A Study on Rewards and Recognition practices in India
AcknowledgementsWe would like to thank all the participating organizations for giving us an opportunity to study their practices on Rewards and Recognition. We are also grateful to the winning organizations for allowing us to share their practices, knowledge and wisdom developed with great effort over a period of time.
Authored by:Aniruddha LimayeRazeyeh JalaliDivya Martyn
Supported by: Joyoti BanerjiYuvika GulatiRajkumar Gupta
India’s Best Companies for Rewards and Recognition anchored by: Madhavi Katre
01
Sandeep Banerjee, CEO, Edenred India, “The growing economy has presented an avenue of robust opportunities for the ever demanding workforce. The evolving dimensions of the work environment have triggered Indian organizations to relook at their rewards and recognition programs in a strategic and structured fashion. Apart from higher pay packages and a host of tangible benefits, companies are differentiating in their offerings with elements that can contribute to the overall employee experience, personal growth and development within the organization. Edenred and Great Place to Work® Institute continue this association for the 2nd year in a row to applaud such organizations with exceptional rewards and recognition practices that have evolved themselves in order to maximize the performance of the most valuable asset of the organization – The Human Capital. The outcome of the study - India’s Best Companies for Rewards and Recognition 2013, will help organizations benchmark their rewards and recognition initiatives with some of the best in the country. We were thrilled with the response and participation in the 1st year and this year over 105 companies from across industry verticals have shown their enthusiasm and participated in the study ascertaining our belief in “India’s Best Companies for Rewards and Recognition” and our endeavour to take this association to the next level in the years to come”
Prasenjit Bhattacharya, CEO, Great Place to Work® Institute, India and Sri Lanka, - “The best workplaces in India have demonstrated a significant shift in mind set when it comes to rewards and recognition. Not only are they talking about total rewards encompassing aspects of financial, intellectual, physical, social and psychological rewards, but they are also recognising that talented employees are worth far more than an average employee. There is growing realisation that winning in the talent market is as important as winning in the market for customers. We are grateful to Edenred who has partnered us for the 2nd year in a row in bringing this pioneering study to you all. The Top 15 companies featured in this study demonstrate that rewards and recognition can go far beyond conventional definitions and be a key driver of emotional engagement with the employees.”
FOREWORD
Sandeep Banerjee. MD & CEO, Edenred India
Prasenjit Bhattacharya. CEO, Great Place to Work® Institute, India
02
Companies Featured in this report
Eli Lilly & Company (India) Pvt. Ltd.Industry: Biotechnology and Pharmaceuticals
Number of Employees: 435
Years of Operation in India: 19
Year founded: 1993
Ownership: Privately held
Accor Hotels, IndiaIndustry: Hospitality
Number of Employees: 2548
Years of Operation in India: 7
Year founded: 2003
Ownership: Privately held
American Express India Pvt. Ltd.Industry: Financial Services & Insurance
Number of Employees: 6065
Years of Operation in India: 90
Year founded: 1921
Ownership: Subsidiary division majority
Forbes Marshall Pvt. Ltd.Industry: Manufacturing and Production
Number of Employees: 1236
Years of Operation in India: 88
Year founded: 1928
Ownership: Privately held
InterGlobe Enterprises Ltd.Industry: Transportation
Number of Employees: 7100
Years of Operation in India: 22
Year founded: 1989
Ownership: Privately held
Mahindra Intertrade LimitedIndustry: Manufacturing and Production
Number of Employees: 120
Years of Operation in India: 12
Year founded: 1999
Ownership: Privately held
Intel Technology India Private LimitedIndustry: Information Technology
Number of Employees: 3452
Years of Operation in India: 13
Year founded: 1988
Ownership: Subsidiary division majority
Intuit IndiaIndustry: Information Technology
Number of Employees: 652
Years of Operation in India: 6
Year founded: 2005
Ownership: Publicly held
03
Companies Featured in this report
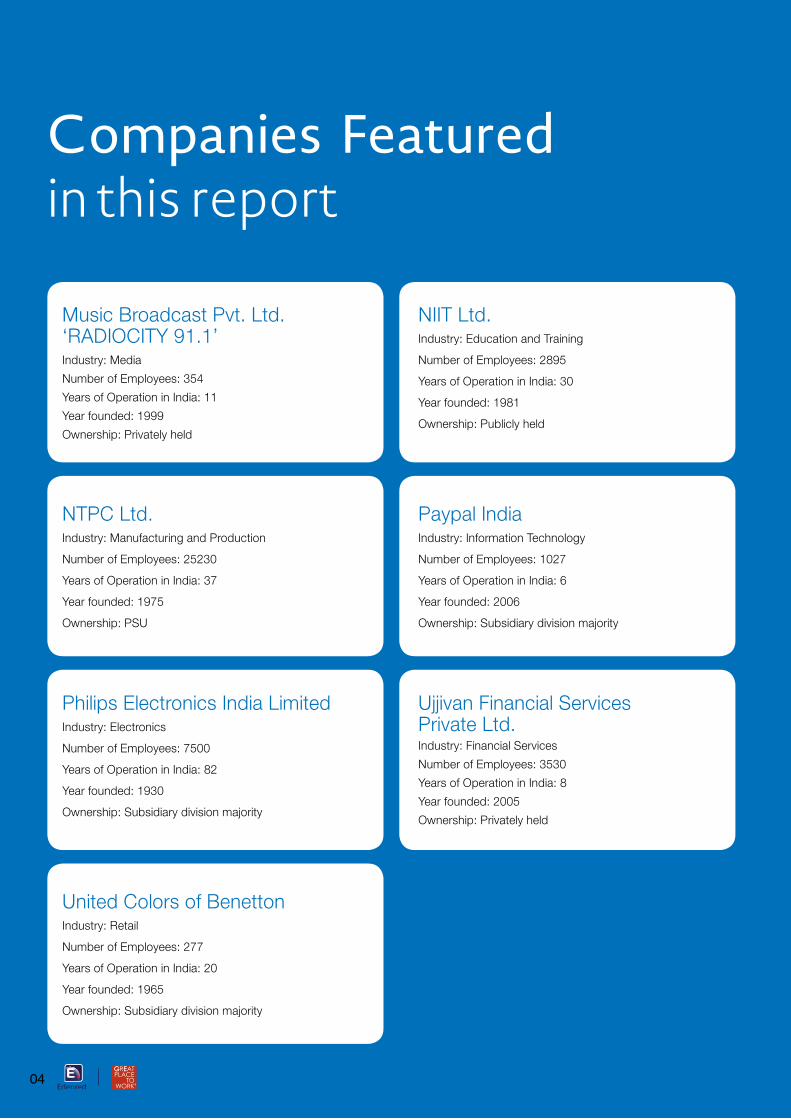
NTPC Ltd.Industry: Manufacturing and Production
Number of Employees: 25230
Years of Operation in India: 37
Year founded: 1975
Ownership: PSU
Music Broadcast Pvt. Ltd. ‘RADIOCITY 91.1’ Industry: Media
Number of Employees: 354
Years of Operation in India: 11
Year founded: 1999
Ownership: Privately held
NIIT Ltd.Industry: Education and Training
Number of Employees: 2895
Years of Operation in India: 30
Year founded: 1981
Ownership: Publicly held
Paypal IndiaIndustry: Information Technology
Number of Employees: 1027
Years of Operation in India: 6
Year founded: 2006
Ownership: Subsidiary division majority
Ujjivan Financial Services Private Ltd.Industry: Financial Services
Number of Employees: 3530
Years of Operation in India: 8
Year founded: 2005
Ownership: Privately held
Philips Electronics India LimitedIndustry: Electronics
Number of Employees: 7500
Years of Operation in India: 82
Year founded: 1930
Ownership: Subsidiary division majority
United Colors of BenettonIndustry: Retail
Number of Employees: 277
Years of Operation in India: 20
Year founded: 1965
Ownership: Subsidiary division majority
04
The need to focus on developing, nurturing and retaining human capital has gained prominence in recent years. Organizations, in order to fulfil this need are turning towards creative, unconventional and intrinsic approaches to formulate their rewards and recognition practices.
Organizations look to a variety of methods that ensure employee engagement, productivity and loyalty. Innovative, viable and sustainable rewards and recognition programmes are now ‘must-have’ tools for an organization and its managers to motivate employees.
Rewarding practices fulfil an employee’s need to be fairly rewarded for their capabilities, efforts and contribution. Organizations implement rewarding practices with an aim to offer competitive salaries, bonus packages, and to share the benefits of peoples’ combined efforts in a fair manner. Incentive plans, profit sharing schemes and other opportunities for wealth and ownership sharing are the various forms of rewards organizations set out to present their employees with.
Recognition practices are those that appreciate employees’ efforts, contribution and results, thus positively recognizing and reinforcing desirable actions and behaviours. Such practices also help to create and maintain a ‘Climate of Appreciation’ in an organization with sincere appreciation of good work and extra effort, regularly and in a wide variety of ways. Such practices are of more intrinsic value to employees as most often, they are carried out with no attached monetary value.
The second edition of India’s Best Companies for Rewards and Recognition saw a total of 107 organization compete in the sphere of rewards and recognition. Sampled employees from these organizations were sent a questionnaire administered over a period of 15 days. Before or during this time, the participating organizations also had to provide information on its workforce strength, compensation strategy, benefits policies, attrition rates, benefits etc. - this formed part of the Culture Audit (2) submission.
In addition to this, organizations were required to share all relevant information about their Rewards and Recognition initiatives that have been implemented. This is done by way of answers to a specific set of questions sent to each of the participating organizations.
The study proposed two hypotheses:1: Once a threshold point is reached in terms of compensation, internal equity and transparency are more important than the actual quantum of the rewards in enhancing the effectiveness of rewards and recognition (particularly rewards) programmes.
2: Higher frequency, genuine experience of appreciation and greater inclusiveness in recognition programmes makes them more effective.
Literature review also indicates that these are relevant issues that organizations are grappling with as they try to enhance performance, innovation and cooperation in organizations and reduce stress and employee burnout.
Both points above were tested by comparing the differences, between what the Top 15 in Rewards and Recognition,
2013 do vis-a-vis the other participating organizations . Overall, on the statements related to rewards and recognition, the Top 15 show significantly higher employee feedback scores (and therefore experience) than the other organizations. A high percentage of the winners of both 2012 and 2013 editions of this study have featured as India’s Best Workplaces of 2012.
The differentiating (between the best and the rest) factors that contribute to internal equity in reward mechanisms are:• Widerdistributionacrosslevelsandroles• Liberalpayoutsandpoliciesformedicalbenefits• Higherdifferentiationbasedonperformancewith lower
fixed and higher variable pay along with higher increment payout at the highest end of the range.
• Higher proportion of employee ownership schemes(especially stock options) and a wider distribution
• More grievance redressal channels contributing to asense of justice
The differentiating (between the best and the rest) factors that contribute to climate of appreciation in an organization are:• Greatervarietyandparametersforrecognitionincluding
greater opportunities for public recognition• Recognitionforforeffortandnotonlyhighperformance,
including potential and skill levels• Inclusivenessinrecognitionandmorefocusoneveryday
recognition by managers than monthly, quarterly or annual forums.
We envisage that these differentiating factors are useful for practitioners and organizations seeking to enhance their practices and could evaluate these for implementation in their organization.
Equally it is also clear that some aspects have become “hygiene” and are especially useful for organizations who are starting this journey. Ensuring non-discrimination of rewards vis-à-vis age, race, gender by ensuring audits, basic medical benefits, long tenure recognition and recognition for results in monthly, quarterly or annual forums are some examples of these.
There are some areas that are still to be clearly implemented by organizations and are practiced only by a few. These are however important subjects of debate and discussion as we prepare our organizations for the future. Employees’ families need to be included not only in medical benefits but in overall recognition as well. recognition for finding new performance levels, personalization of recognition are some of the aspects that have been discussed here. Lastly, an important element to ensure continued success of such interventions is the extent of participation and collaboration in design and modification of policies and programs. These ensure that there is a self-correcting mechanism in the organization and that programs are designed to suit diverse needs of different generations, gender and roles. There is definitely scope for companies to do more in this area.
We trust you will find this report interesting and useful as employees, HR practioners and leaders. We would like to thank all participating companies for their involvement without which this could not have been possible.
Good luck with your journey.
Executive Summary
05
Contents1. Introduction2. The 2012 study – Lessons for 20133. Literature review and Key Hypotheses a. Rewards and recognition explained
b. Defining rewards and recognition
c. Key hypotheses
4. Great Place to Work ® framework and study methodology5. Key findings a. Overall effectiveness
b. Findings on rewards
i. Quantum of compensation and internal equity
ii. Non- discrimination
iii. Distribution of rewards
iv. Fixed pay versus variable pay and differentiation
v. Employee ownership schemes
vi. Grievance redressal and perception of justice
c. Findings on recognition
i. Variety and frequency of programs
ii. Recognition for efforts and not only high performance
iii. Recognition for long tenure is a common trend
iv. Inclusiveness in recognition
v. Forms of recognition
d. Assumptions
6. Conclusion7. References8. Appendices
07
08
09
12
14
25
26
27
The need to focus on developing, nurturing and retaining human capital has gained prominence in recent years. To this end, companies in India are restructuring their rewards and recognition programs, as means to retain and motivate their employees. Organizations today are turning towards creative, unconventional and intrinsic approaches to formulate their rewards and recognition practices. From sophisticated single window employee rewards and recognition platforms, to contextualizing rewards and communication to the specific needs of every employee, or even providing them with learning and development opportunities for personal growth, companies are forging ahead in the new era of rewards and recognition programs which are in line with the needs and aspirations of the Indian workforce. Edenred is adept in the rewards and recognition space, designing structured programs for progressive organizations to help them make their workplace come alive. Great Place to Work® Institute, on the other hand, has extensive experience in research and consulting and benchmarks best people practices at a global level. This alliance drives a lot of synergies for both partners in their areas of proficiency to be able to understand and honor the exceptional rewards and recognition practices of organizations in India to motivate talent and improve their overall performance.
Great Place to Work® Institute is known globally as one of the pioneers in the practice of studying and recognizing the
best workplaces. Over 2.5 million employees from over 7000 organizations in over 40 countries participate in the Best Workplace study each year- making this the largest global study of its kind in the world. The mission of the Institute is to build a better society by helping companies to transform their workplaces. The Best Workplaces Study in India is inspired by the vision of ‘Making India a Great Place to Work’. The institute has been conducting workplace studies and has been recognizing the best companies in India for the past 9 years now. Along with studies the Institute provides advisory and consulting support for companies that wish to enhance their workplace experience. “India’s Best Companies to Work For”, conducted by Great Place to Work® Institute India and The Economic Times, is the largest study of its kind in India.
Edenred is the world leader in prepaid service vouchers with over 50 years of experience in corporate and public benefits. In India, Edenred partners over 3,500 organizations with a wide range of innovative Work-life Benefits, Rewards and Loyalty Solutions. Edenred entered the Indian market in 1997 with Meal Vouchers & Cards, Gift Vouchers and Rewards & Loyalty Solutions; and has become a major player providing services to corporate clients and public institutions.
INTRODUCTION
07
2012 witnessed the first edition of India’s Best Companies for Rewards and Recognition (henceforth, R&R) Awards and White Paper. A total of 76 organizations applied to participate in the study. These 76 organizations represented 11 industries including Information Technology, Financial Services, Media and Telecommunication.
Of the 76 organizations who participated, Great Place to Work® Institute together with Edenred felicitated the Top 10 in Rewards and Recognition. The first edition White Paper highlighted the findings and unique practices from these 10 organizations.
This section outlines the major findings of the 2012 research. The 2013 edition of this study will build on a few findings from last year, and will take a deeper look into a few elements of both rewards and recognition, and the factors contributing to its effectiveness in organizations.
To begin with, the report determined that an organization’s culture (basic values and beliefs) needs to be reflected in its rewards and recognition practices. We have incorporated this learning into this year’s study and we have looked at organizations that recognise employees for displaying behaviours that are true to its values. The report also found that recognition practices have immense potential, many of which are yet to be utilised to their full potential . This recognition can be both public and private, can be non-monetary (no budgetary constraints in implementing), can be provided by all levels in the organization, can be more proximate to the actions and results and can be done frequently. It was also established that most organizations have not been utilising the potential of effective recognition practices effectively. Hence this study aims to understand this in greater detail.
Employee perception of fairness depends on factors such as internal equity, external parity, impartiality in assessment, clarity on desired actions/behaviours and results that will be rewarded, and, the level of transparency on the reasons or parameters of a reward. The 2013 study will explore a few of these factors in detail. Data relating to the establishment of internal equity and employee perception of fairness will be used to test the hypotheses discussed later on in this report.
The previous study also reported that it was important to involve employees in decisions on the various ways in which rewards and recognition can be provided. Additionally, it was also discovered that using recognition to drive certain behaviours and efforts, not just results, increases the positive impact of an R&R program. Personalised or individualised gifts (without violating the essence of fairness
in the practice) make recognition elements more motivating and meaningful. All three data points mentioned above will be further tested in the current study.
Another factor that plays a vital role in the acceptance and effectiveness of an R&R practice is communication. Communication here not only refers to the process of informing employees about what can be earned but also refers to the medium used to transfer information throughout the organization. Companies may choose to announce a new Restricted Stock Units (RSU) scheme via internal mass mailers. They may also choose to conduct country wide road shows to gain ‘face-time’ with employees from all regions - to communicate the same initiative. The current study will highlight a few such practices implemented by the winning organizations.
A few factors contributing to effectiveness have emerged from the 2012 data. The defined metrics of a programme (what is achievable and who can achieve what), the transparency of communication of these metrics and the accuracy with which performance is calculated are factors that positively contribute to an effective R&R programme. The weight of the amount/gift/recognition needs to be calculated in line with the values/goals of the organization. If the weight is too little, employees will lose interest and, if it is unrelated to demonstration and practice of desirable behaviours, it will be perceived as unfair by employees.
The study conducted this year will build on these points and will also attempt to answer questions relating to the exact factors that ensure effective rewards and recognition programmes. The benchmark to check and measure this effectiveness is the employee feedback collated as responses to the Trust Index© questionnaire. Thus, for the purpose of this report, the feedback scores of the Top 15 in Rewards and Recognition will be used as a measure of effectiveness.
Additionally employee referrals and voluntary separations have been looked at as indicators of effectiveness. A surrogate measure that has been considered is whether the companies have featured as ‘India’s Best Companies to Work For ,2012 and 2013 - A Study by Great Place to Work® in partnership with the Economic Times.
In summary, the 2012 study provides some learning for the current one, an opportunity to continue to test some of the earlier hypotheses and critically examine some new ones with data
THE 2012 STUDY - LESSONS FOR 2013
08
The war for talent today is one of the biggest challenges faced by organisations, both large and small, and it has become increasingly harder to attract and retain the kind of talent that is necessary to sustain a growing business in the long term. Talent management in India constantly needs to tackle two major issues. The first deals with the employability of students being churned out of our universities. The second deals with retaining talent in organizations. A McKinsey study reported that only 10%–25% of the 14 million university graduates churned out by Indian universities work in MNCs, mostly because they do not have the language skills, cultural awareness or other competencies needed for the job (Holland, 2008), required in global corporations. Equally challenging has been their retention of knowledge workers beyond 2–3 years. In India, the information technology (IT) and business process outsourcing (BPO) sectors experience annual attrition rates of 30%–45% (Bhatnagar, 2007). This is also the case in many other industries in India today. As an article in Business Standard states "India Inc. may see attrition rates as high as 31%" 2013), a study has found that while IT/ITES (BPO) industry showed the highest attrition rates in the country during the first quarter of the Financial Year, it is closely followed by the Telecom industry (26%), Banking and Financial Services (23%), Aviation and Hospitality (22%), FMCG (21%), Automobile and Manufacturing (19%) and Real Estate (15%).
Several research studies have revealed that this is not just an Indian phenomenon. It has been estimated that in most significant economies across the globe, around 55% - 60% employees are either actively seeking alternative job opportunities or seriously contemplating a job change. What is recognition?
As much as this is a widely understood concept, there are some definitions that capture the essence of the word well. One such definition has been put forward by Brun and Dugas (2008) who say “Recognition is first and foremost a constructive response; it is also a judgment made about a person’s contribution, reflecting not just work performance but also personal dedication and engagement. Lastly, recognition is engaged in on a regular or ad hoc basis, and expressed formally or informally, individually or collectively, privately or publicly, and monetarily or non-monetarily”. Similarly, rewards are an important part of an organisation’s system, and the right kind of rewards system helps in contributing to employees feeling motivated and committed to their job (Bonsdorff 2011). It has been long understood that rewards and recognition in the workplace are important, and the integral aspects of motivating employees, whilst keeping them engaged at the work they do. Today, employees are not satisfied with just going into work today. As studies done by Great Place to Work Institute have shown us year on year, employees want a lot more out of their workplace – be it in terms of feeling like they belong to a community, that they are valued and their differences appreciated, or even in knowing that their management is taking them in the
right direction – companies we have studied and identified over the last 25 years as the best in their space have consistently scored high on these elements.
There have been numerous studies in different industries trying to establish a link between the right kind of rewards and recognition programmes, and the impact on employees. A study conducted by Bhattacharya and Mukherjee (paper 12) among Information Technology organisations in India found that employees in the IT sector placed a great emphasis on rewards. They also identified many key aspects an effective rewards and recognition programme will need to encapsulate, which include:
• Theneedtobefair,transparent,inclusive,timelyandvaried.• Theformofrecognitionshouldbeappropriatetothecontribution
that was made.• Recognitionshouldbemeaningfulandreflectthepreferences
of the recipient.• Anyrelatedactivitiesshouldberespectfulofworkplacediversity
and must be done with the involvement of employees.• When recognition is the result of a group or team effort, all
contributing members of the team should be recognized.• Therightkindofcommunicationonrecognitionactivitiesneeds
to happen to promote a culture of recognition and pride among employees.
Brun and Dugas (2008) have found interesting relationships between recognition and the psychology of the worker. An excerpt from their paper explains the relationship even better .
Brun and Biron et al. (2003) reveal that lack of recognition constitutes the second-largest risk factor for psychological distress in the workplace. Among managers, for instance, it would appear to constitute a stress-tolerance factor and a key element in their ability to handle difficult professional situations (Dany and Livian 2002). One of the most important sources of organizational mobilization and engagement (Wills, Labelle, Gue´rin and Tremblay 1998; Tremblay, Gay and Simard 2000), recognition plays a key role in the success and continuity of organizational change (Atkinson 1994; Fabi, Martin and Valois 1999; Evans 2001). Moreover, it promotes on-the-job learning (Lippit 1997) and is a building block of learning organizations (Griego, Geroy and Wright 2000). Finally, by contributing to employee job satisfaction, recognition has a positive impact on organizational productivity and performance (Applebaum and Kamal 2000).
What do companies mostly base their recognition schemes on? A study conducted in the USA by the Society for Human Resource Management in 2011 shows that 58% of the organisations recognised tenure in the company, 48% recognised employees who went over and above their regular call of work, 43% organisations recognised employees for adding to the organisation’s financial bottom line, 37% recognised employees
LITERATURE REVIEW, DEFINITIONS AND KEY HYPOTHESES
09
who behaved according to the values of the organisation, 9% recognised employees for the high-quality outputs on work projects and 2% on completing the projects ahead of deadlines. This information is very important for organisations – especially as further research conducted by Globoforce, Intuit, and Stanford Graduate School of Business reported that for a recognition practice to be considered an important strategic tool within the company, it had to involve 5%-8% of the employee base. If it did not, the recognition scheme was irrelevant to the organisation.
As is obvious, there are many common reasons for implementing rewards and recognition schemes within an organisation. Then why do some companies not give enough emphasis to these schemes, or look at implementing them in the proper manner within their organisations? Studies have shown a plethora of main reasons, and the bottlenecks that crop up for these continue to be managers within the organisation. Brun and Dugas (2008) refer to research that has found that managers are apprehensive of giving recognition to their subordinates due to:
1. Fear of losing control, 2. Apprehensions about others’ creative power, 3. Resistance to more egalitarian relationships, and,4. Detachment from employees’ actual work often caused by
new management constraints.
Other reasons for companies not giving due prominence to rewards and recognition schemes for employees include biases against recognition and the perception of recognition being misconstrued as flattery and that they have to be handled carefully and accurately, as they can have unexpected repercussions (Brun and Dugas 2008). Brun and Dugas (2002) also point out that this is an implication of the lack of time, knowledge or skill of managers for implementation.
In summary current literature on the subject indicates that rewards and recognition plays a key role in helping organizations achieve employee commitment and result. It is important to be fair, transparent and team oriented when recognising employees. Additionally absence of it causes stress. Lastly the manager is the key player in making it successful.
REWARDS AND RECOGNITION EXPLAINED
Rewards and Recognition is therefore a subset of the overall framework of employee perception lays a vital role in creating trust in the workplace. Organizations today are engaged in two major battles: the battle for customers and the battle for the best talent. An increasing number of organizations in India are realising that the first battle cannot be won without winning the second. Therefore, in addition to providing their workforce with a dynamic work environment, organizations look to a variety of methods that ensure employee engagement, productivity, and loyalty. Innovative, viable and sustainable rewards and recognition programmes have become ‘must-have’ tools for an organization and its managers to motivate employees.
Rewarding practices fulfill employees’ needs to be fairly rewarded for their capabilities, efforts and contribution. Organizations implement rewarding practices with an aim to offer competitive salaries, bonus packages, and to share the benefits of peoples’ combined efforts in a fair manner. Incentive plans, profit sharing schemes and other opportunities for wealth and ownership sharing are the various forms of rewards organizations set out to present their employees with.
This study includes the following areas under Rewards and Recognition: 1. Assured annual compensation
2. Special or annual increases in assured compensation
3. Increases in benefits and/or compensation with changes in grade, role or position
4. Performance based variable pay, incentives, bonus (that may be monthly, quarterly, half yearly or annual) or even longer term rewards
5. Rewards for loyalty or long tenure
6. Rewards in gifts or cash for specific actions, behaviours, and contribution
7. Rewards ingifts or cash for contribution from suppliers, vendors, third party employees
8. Rewards in gifts or cash for family members’ contribution/achievements
9. Personal recognition/appreciation for desirable actions and contribution without any significant cash component in a public or private manner
10. Wide range of benefits and perquisites i.e. those that are beyond the statutory mandates.
11. Long term wealth sharing mechanisms such as restricted stock units, stock grants, phantom stock grants, stock options, discounted stock purchases, etc.
Thanking practices are those that appreciate employees’ efforts, contribution and results, thus positively recognizing and reinforcing desirable actions and behaviours. Such practices also help to create and maintain a ‘Climate of Appreciation’ in an organization with sincere appreciation of good work and extra effort, regularly and in a wide variety of ways. Elements contributing to this ‘climate of appreciation’ will be looked at while testing the hypothesis at a later stage in this report. Thanking in most organizations is done by creating a wide variety of opportunities for employee recognition. Some of these are - peer recognition, awards for performance, tenure of service, adherence to safety norms both at individual or team levels and recognition for display of company values.
DEFINING EFFECTIVENESS OF REWARDS & RECOGNITION PROGRAMMES
As mentioned earlier in this report, employee perception has been measured using the Trust Index© Questionnaire. This perception is measured in the form of feedback on certain statements from the questionnaire that relate to an organization’s reward and recognition practices. Effectiveness of the R&R programmes in an organization is measured primarily on the basis of this employee feedback. Therefore, this report adjudges an R&R programme as effective when the following criteria are met:
1. There is positive employee perception about Rewards and Recognition programmes i.e. the arithmetic mean of the weighted average scores of the relevant Trust Index© statements for the best companies for R&R are higher than the rest of the organizations who have participated in the study.
10
2. These organizations - the Best in 2012 & 2013 -(winners in Rewards and Recognition)have also been featured in the list of India’s Best Companies to Work For, 2012- A Study by Great Place to Work® and The Economic Times.
3. Finally, the rate of voluntary separations is lower in these companies while the employee referrals are higher (both, in terms of numbers and percentage of employees recruited) for the Top 15 companies for Rewards and Recognition than for others who have participated.
KEY HYPOTHESES
After having discussed the literature on Rewards and Recognition, this report now sets forth two working hypotheses that will be validated with the help of qualitative and quantitative data collected from participating organizations.
1: Once a threshold point is reached, internal equity and transparency are more important than the actual quantum of the rewards in enhancing the effectiveness of rewards and recognition (particularly rewards) programmes.
2: Higher frequency, genuine experience of appreciation and greater inclusiveness in recognition programmes makes them more effective.
The first aim of this study is to prove that perceived equity, fairness and transparency in a reward practice together have a greater impact on the effectiveness that just the actual size/quantum, amount or value of the reward. This study has already identified that a high employee feedback score reflects effectiveness of rewards and recognition practices. Therefore this hypothesis will be proven only if the data collected reveals that for all (or at least significant majority) of the elements mentioned below, the data for the Top 15 is significantly different from that of the other participants. Findings of the study will be used to demonstrate the various factors that contribute to internal equity in an organization.
Secondly, this study suggests the ideas that, in order for recognition programs to be truly effective, they must be frequent, close to the action, reflect a genuine sense of gratitude and attempt to include a majority of the workforce. Data on recognition will be used to discuss and illustrate the points that validate this hypothesis.
This study will also look at those contributing factors/ characteristics that have scattered evidence and may be points for discussion for future practices.
11
The following statements have been considered as indicators for employee perception on rewards and recognition in the organization.
REWARDS
People here are paid fairly for the work they do.
We have special and unique benefits here.
Managers avoid playing favourites.
I feel I receive a fair share of the profits made by this organization.
Promotions go to those who best deserve them.
Performance of employees here is fairly evaluated.
RECOGNITION
Management shows appreciation for good work and extra effort.
Everyone has an opportunity to get special recognition.
Managers avoid playing favourites.
Performance of employees here is fairly evaluated.
THE CULTURE AUDIT© FRAMEWORK
This report has already defined a great workplace from an employee’s perspective. However, while managerial employees are also employees, once in a managerial role, their relationship with the organization, self, team and individual goals changes. Therefore, from a manager’s point of view, a great place to work can also be defined as one where a manager is able to get people to achieve the organizational objectives, give their personal best and work together cohesively as a team/family - all in an environment of trust.
Employee feedback reflects an employee’s perception of the practices, policies, processes, values and overall cultural environment of his/her workplace as he/she experiences it. Every manager plays a vital role in planning and implementing practices and programmes that contribute to this overall cultural environment of the organization. Great Place to Work® Institute, after several years of research has identified 9 ‘people practice areas’ that complete an organization’s cultural circle, and encompass an employee’s life cycle within an organization. The picture below illustrates the 9 people practice areas that organizations are required to focus on in order to develop into great workplaces.
Examples and descriptions of each practice area can be seen in APPENDIX 1 .
Thanking and Sharing (Rewarding) are the two people
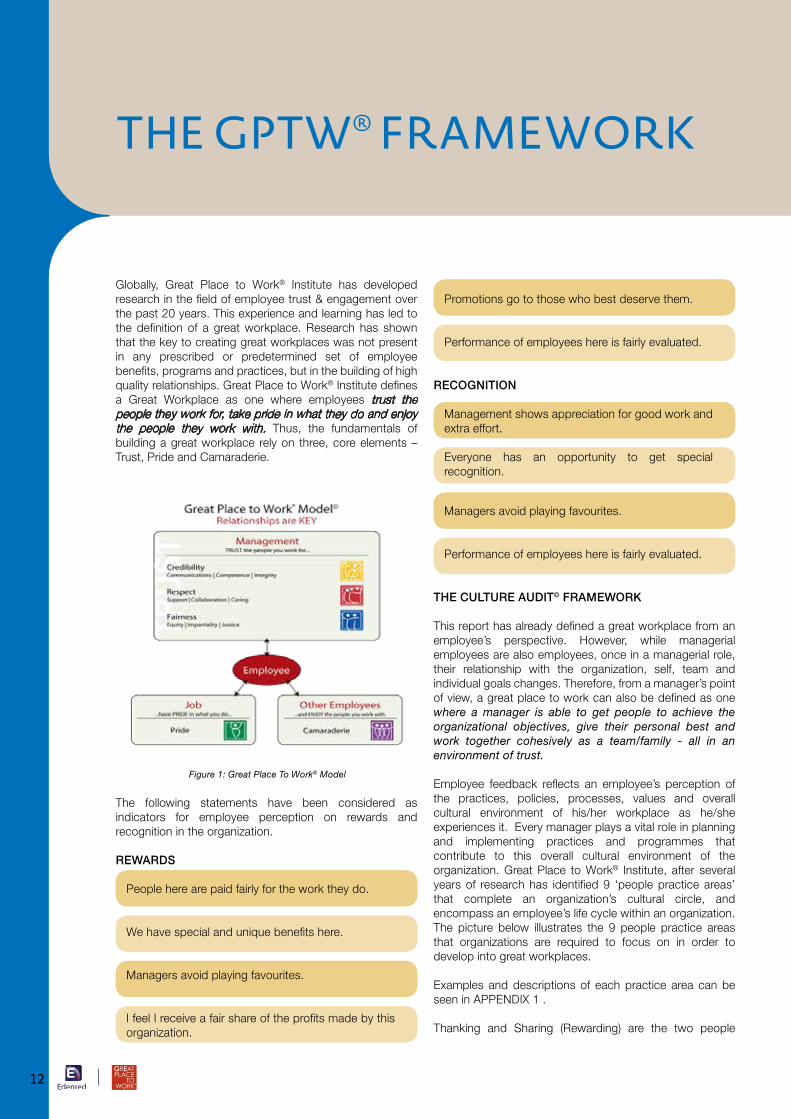
Globally, Great Place to Work® Institute has developed research in the field of employee trust & engagement over the past 20 years. This experience and learning has led to the definition of a great workplace. Research has shown that the key to creating great workplaces was not present in any prescribed or predetermined set of employee benefits, programs and practices, but in the building of high quality relationships. Great Place to Work® Institute defines a Great Workplace as one where employees trust the people they work for, take pride in what they do and enjoy the people they work with. Thus, the fundamentals of building a great workplace rely on three, core elements – Trust, Pride and Camaraderie.
THE GPTW® FRAMEWORK
Figure 1: Great Place To Work® Model
12
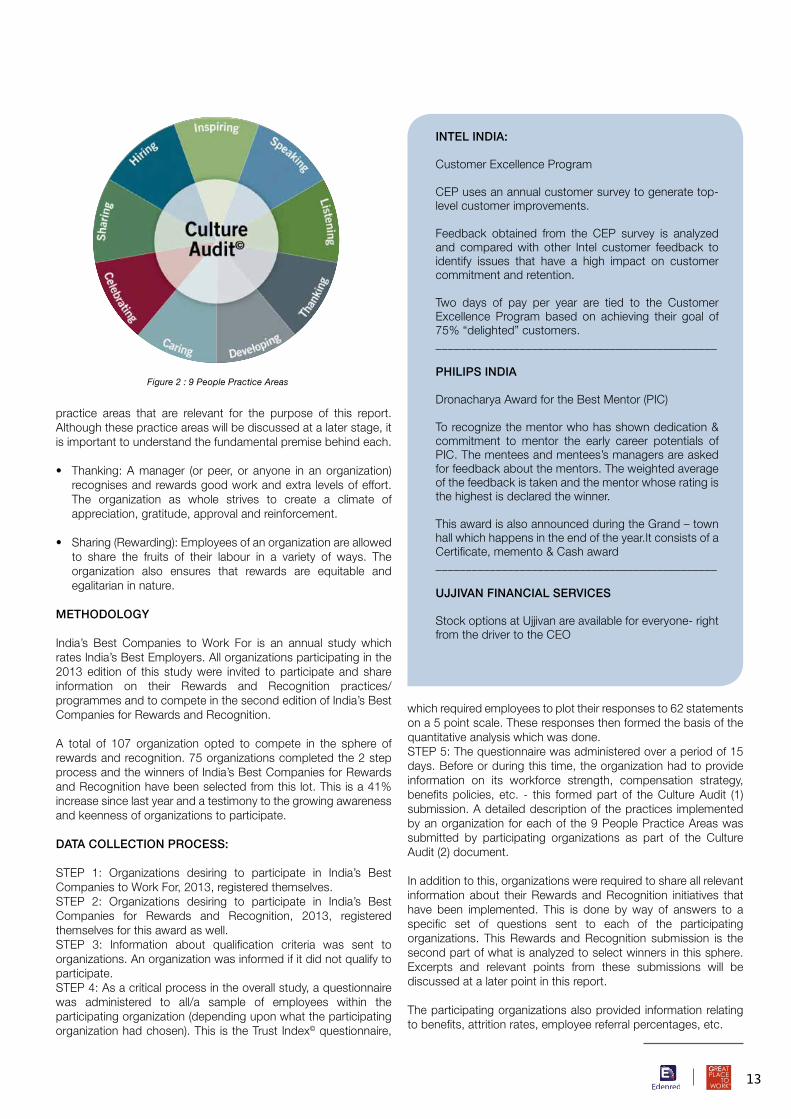
practice areas that are relevant for the purpose of this report. Although these practice areas will be discussed at a later stage, it is important to understand the fundamental premise behind each.
• Thanking:Amanager (orpeer,oranyone inanorganization)recognises and rewards good work and extra levels of effort. The organization as whole strives to create a climate of appreciation, gratitude, approval and reinforcement.
• Sharing(Rewarding):Employeesofanorganizationareallowedto share the fruits of their labour in a variety of ways. The organization also ensures that rewards are equitable and egalitarian in nature.
METHODOLOGY
India’s Best Companies to Work For is an annual study which rates India’s Best Employers. All organizations participating in the 2013 edition of this study were invited to participate and share information on their Rewards and Recognition practices/programmes and to compete in the second edition of India’s Best Companies for Rewards and Recognition.
A total of 107 organization opted to compete in the sphere of rewards and recognition. 75 organizations completed the 2 step process and the winners of India’s Best Companies for Rewards and Recognition have been selected from this lot. This is a 41% increase since last year and a testimony to the growing awareness and keenness of organizations to participate.
DATA COLLECTION PROCESS:
STEP 1: Organizations desiring to participate in India’s Best Companies to Work For, 2013, registered themselves.STEP 2: Organizations desiring to participate in India’s Best Companies for Rewards and Recognition, 2013, registered themselves for this award as well.STEP 3: Information about qualification criteria was sent to organizations. An organization was informed if it did not qualify to participate.STEP 4: As a critical process in the overall study, a questionnaire was administered to all/a sample of employees within the participating organization (depending upon what the participating organization had chosen). This is the Trust Index© questionnaire,
which required employees to plot their responses to 62 statements on a 5 point scale. These responses then formed the basis of the quantitative analysis which was done. STEP 5: The questionnaire was administered over a period of 15 days. Before or during this time, the organization had to provide information on its workforce strength, compensation strategy, benefits policies, etc. - this formed part of the Culture Audit (1) submission. A detailed description of the practices implemented by an organization for each of the 9 People Practice Areas was submitted by participating organizations as part of the Culture Audit (2) document.
In addition to this, organizations were required to share all relevant information about their Rewards and Recognition initiatives that have been implemented. This is done by way of answers to a specific set of questions sent to each of the participating organizations. This Rewards and Recognition submission is the second part of what is analyzed to select winners in this sphere. Excerpts and relevant points from these submissions will be discussed at a later point in this report.
The participating organizations also provided information relating to benefits, attrition rates, employee referral percentages, etc.
Figure 2 : 9 People Practice Areas
INTEL INDIA:
Customer Excellence Program
CEP uses an annual customer survey to generate top-level customer improvements.
Feedback obtained from the CEP survey is analyzed and compared with other Intel customer feedback to identify issues that have a high impact on customer commitment and retention.
Two days of pay per year are tied to the Customer Excellence Program based on achieving their goal of 75% “delighted” customers._______________________________________________
PHILIPS INDIA
Dronacharya Award for the Best Mentor (PIC)
To recognize the mentor who has shown dedication & commitment to mentor the early career potentials of PIC. The mentees and mentees’s managers are asked for feedback about the mentors. The weighted average of the feedback is taken and the mentor whose rating is the highest is declared the winner.
This award is also announced during the Grand – town hall which happens in the end of the year.It consists of a Certificate, memento & Cash award_______________________________________________
UJJIVAN FINANCIAL SERVICES
Stock options at Ujjivan are available for everyone- right from the driver to the CEO
13
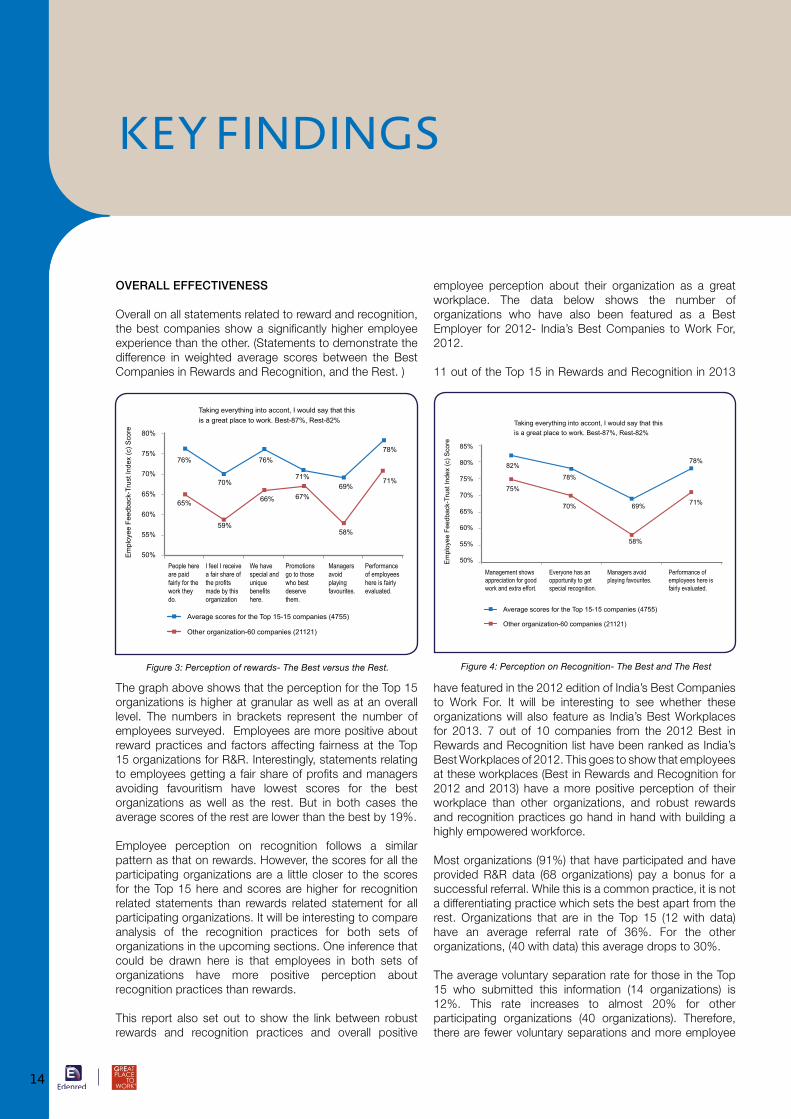
OVERALL EFFECTIVENESS
Overall on all statements related to reward and recognition, the best companies show a significantly higher employee experience than the other. (Statements to demonstrate the difference in weighted average scores between the Best Companies in Rewards and Recognition, and the Rest. )
The graph above shows that the perception for the Top 15 organizations is higher at granular as well as at an overall level. The numbers in brackets represent the number of employees surveyed. Employees are more positive about reward practices and factors affecting fairness at the Top 15 organizations for R&R. Interestingly, statements relating to employees getting a fair share of profits and managers avoiding favouritism have lowest scores for the best organizations as well as the rest. But in both cases the average scores of the rest are lower than the best by 19%.
Employee perception on recognition follows a similar pattern as that on rewards. However, the scores for all the participating organizations are a little closer to the scores for the Top 15 here and scores are higher for recognition related statements than rewards related statement for all participating organizations. It will be interesting to compare analysis of the recognition practices for both sets of organizations in the upcoming sections. One inference that could be drawn here is that employees in both sets of organizations have more positive perception about recognition practices than rewards.
This report also set out to show the link between robust rewards and recognition practices and overall positive
employee perception about their organization as a great workplace. The data below shows the number of organizations who have also been featured as a Best Employer for 2012- India’s Best Companies to Work For, 2012.
11 out of the Top 15 in Rewards and Recognition in 2013
have featured in the 2012 edition of India’s Best Companies to Work For. It will be interesting to see whether these organizations will also feature as India’s Best Workplaces for 2013. 7 out of 10 companies from the 2012 Best in Rewards and Recognition list have been ranked as India’s Best Workplaces of 2012. This goes to show that employees at these workplaces (Best in Rewards and Recognition for 2012 and 2013) have a more positive perception of their workplace than other organizations, and robust rewards and recognition practices go hand in hand with building a highly empowered workforce.
Most organizations (91%) that have participated and have provided R&R data (68 organizations) pay a bonus for a successful referral. While this is a common practice, it is not a differentiating practice which sets the best apart from the rest. Organizations that are in the Top 15 (12 with data) have an average referral rate of 36%. For the other organizations, (40 with data) this average drops to 30%.
The average voluntary separation rate for those in the Top 15 who submitted this information (14 organizations) is 12%. This rate increases to almost 20% for other participating organizations (40 organizations). Therefore, there are fewer voluntary separations and more employee
80%
75%
70%
65%
60%
55%
50%
76% 76%
71%69%
78%
70%
65% 66% 67%
58%
71%
59%
Taking everything into accont, I would say that this is a great place to work. Best-87%, Rest-82%
Average scores for the Top 15-15 companies (4755)
Other organization-60 companies (21121)
People here are paid fairly for the work they do.
I feel I receive a fair share of the profits made by this organization
We have special and unique benefits here.
Promotions go to those who best deserve them.
Managers avoid playing favourites.
Performance of employees here is fairly evaluated.
Empl
oyee
Fee
dbac
k-Tr
ust I
ndex
(c) S
core
Figure 3: Perception of rewards- The Best versus the Rest.
KEY FINDINGS
85%
80%
75%
70%
65%
60%
55%
50%
82%
78%
69%
78%
75%
70%
58%
71%
Taking everything into accont, I would say that this is a great place to work. Best-87%, Rest-82%
Average scores for the Top 15-15 companies (4755)
Other organization-60 companies (21121)
Management shows appreciation for good work and extra effort.
Everyone has an opportunity to get special recognition.
Managers avoid playing favourites.
Performance of employees here is fairly evaluated.
Em
ploy
ee F
eedb
ack-
Trus
t Ind
ex (c
) Sco
re
Figure 4: Perception on Recognition- The Best and The Rest
14
UJJIVAN FINANCIAL SERVICES
External Parity
Compensation surveys are conducted from time to time to benchmark against the industry compensation trends. Ujjivan undertook a compensation survey at the Industry level with MFIN (Micro- Finance Institutions Network – the Industry body similar to NASSCOM, CII), this year for compensation benchmarking.
_______________________________________________
INTEL INDIA PRIVATE LIMITED
Focal Tools (annual performance appraisal tool) and Base Pay Comparison tool which allows managers to view the relevant position of their team members in their salary range. The tools can show the internal parity (within the company) and external parity (within the industry). Any salaries which go beyond or below a particular grades’ range are flagged and highlighted and these cases are to be justified by the manager at senior level meetings. However, such exceptions in salary ranges are rare and not encouraged. All managers have access to the CRT (Compensation Reference Tool) which details out the salary.
My Total Package:
Employee’s can view their salary range as well and can find where they stand in their grade’s salary range.
INTERGLOBE ENTERPRISES
CLAP (Champions League Appreciation Program)
CLAP is a tool to recognize employees of our Air Transport business, for living the values of the organization namely Integrity, Customer Orientation and Future Mindedness. CLAP Awardees are recognized as ‘Champions’. The award consists of a Certificate signed by Business Head and a token of appreciation – a gift voucher worth INR. 15000/-.
_______________________________________________
PHILIPS INDIA
K.I.T.E. Awards
Keep Improving To Excel is a one of a kind competition at Philips which aims at promoting Lean and Six sigma. The program consists of workshops on Lean and Six sigma initiatives. Post the training workshops, the employees who are able to sustain results are given projects. These projects become part of the business improvement competition which is judged by the India management team._______________________________________________
AMERICAN EXPRESS INDIA PRIVATE LIMITED
An in-house wellness program- ‘Healthy Living’ which promotes awareness on healthy eating habits within their employees along with mental and physical fitness. Under this umbrella, various initiatives such as the on-site clinic (Care@Amex), on-site gym and fitness sessions, smoking cessation program, pregnancy care program and Employee Assistance Program, Weight management program etc. have been designed for our employees.
referrals, in the Top 15 organizations. Employees at these workplaces are less likely to decide to move on, and are more likely to recommend their workplaces to their social and professional circles.
The findings provide interesting learning on factors that differentiate the best, those which are hygiene across the organization and also areas that need to be considered in the future.
Let us now look at rewards and recognition separately.
FINDINGS ON REWARDS
The following factors have been measured to infer about an organization’s internal equity and transparency of its rewards programs:
• CompensationoftheCEOoftheorganization,whencomparedto that of fresh graduates and /CAs as a multiple of the compensation of these categories.
• Total compensation of Supervisors to Managers and SeniorManagement Team Members.
• Appropriatemarketcorrectionsandinternalcorrectionsmadein the compensation level of deserving lower paid employees, proactively, from time to time, to minimize anomalies and inequities.
• Non-discrimination incompensation,benefitsandrewardsonthe basis of gender, caste, race, language and religion.
• Incentivesandperformancebonusavailabilityacrossalllevels,roles and functions.
• The parameters of rewards especially for incentives/performance bonus and the amount of increments Wealth creation/wealth sharing opportunities such as Stock Options/Restricted Stock Units/Stock Purchase Plans, etc., made available to the largest number and percentage of employees regardless of their level, function and tenure.
• Percentageoftheorganization’sstockownedbyemployees
• Grievanceredressal/appealsthatspecificallydealswithmattersrelating to compensation, grade & salary fitment, performance rating and increment/incentive/performance bonus and promotions.
15
the Top 15, than in the other organizations.
Taking a deeper look into select industries, data demonstrates that the financial services sector has returned the highest difference between the salary structure of CEO and entry levels. The average salary multiplier for CEO compensation compared with an MBA entrant is 45; whereas, it is 25 and 21 for the IT and Manufacturing industries respectively. Similarly, for fresher comparisons, the CEO salary average is 68 times in Financial Services, while it is 32 and 40 for the IT and Manufacturing industries. This indicates that there is greater sense of internal equity in these two sectors, when compared with Financial Services.
Internal equity is also established when organizations regularly track and compare their compensation and benefits with a suitable basket of organizations. Compensation of newly hired employees versus those with tenure (of comparable performance) is also tracked. Appropriate market corrections and internal corrections are made in the compensation level of deserving lower paid
• Accessibility of generic benefits which are not required toperform one’s role effectively to employees across levels, roles, functions and locations.
• Extent of feedback and inputs from employees, supervisorsand managers to decide on introduction, withdrawal or change in benefits.
QUANTUM OF COMPENSATION AND INTERNAL EQUITY
Data indicates that the Top 15 do not have vastly higher compensation at and between various levels, thereby suggesting that the quantum of compensation need not be drastically high to create an effective rewards experience.
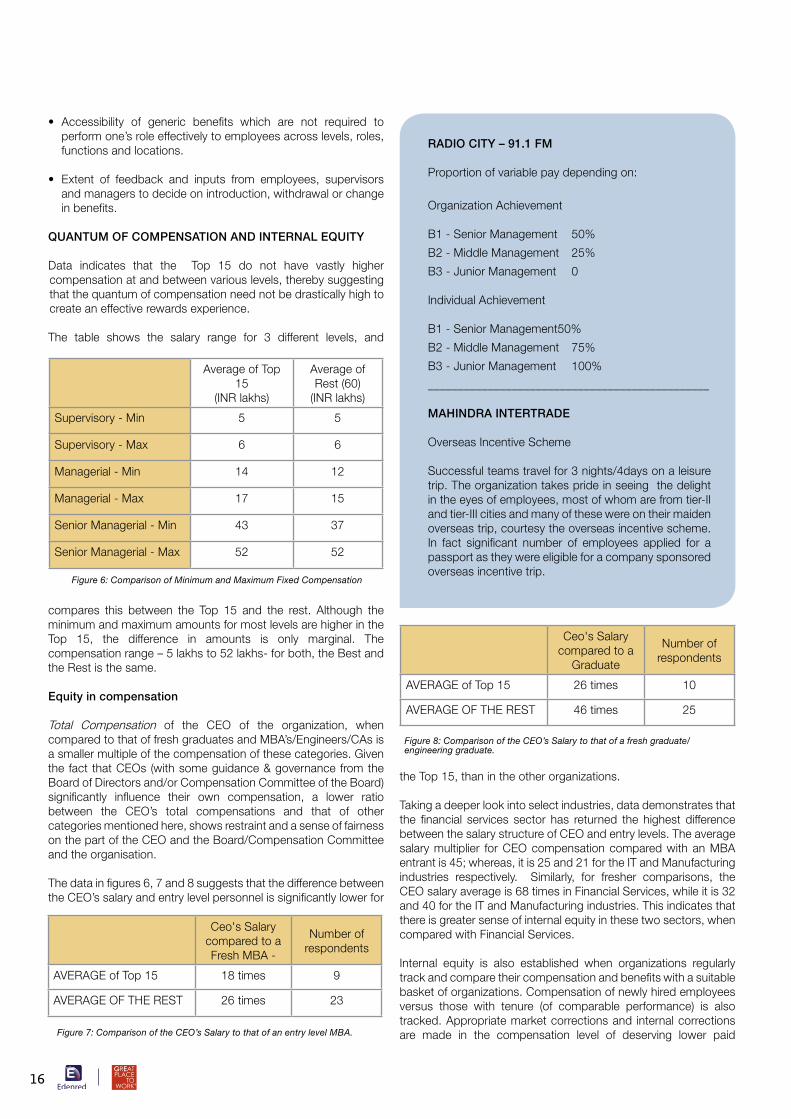
The table shows the salary range for 3 different levels, and
compares this between the Top 15 and the rest. Although the minimum and maximum amounts for most levels are higher in the Top 15, the difference in amounts is only marginal. The compensation range – 5 lakhs to 52 lakhs- for both, the Best and the Rest is the same.
Equity in compensation
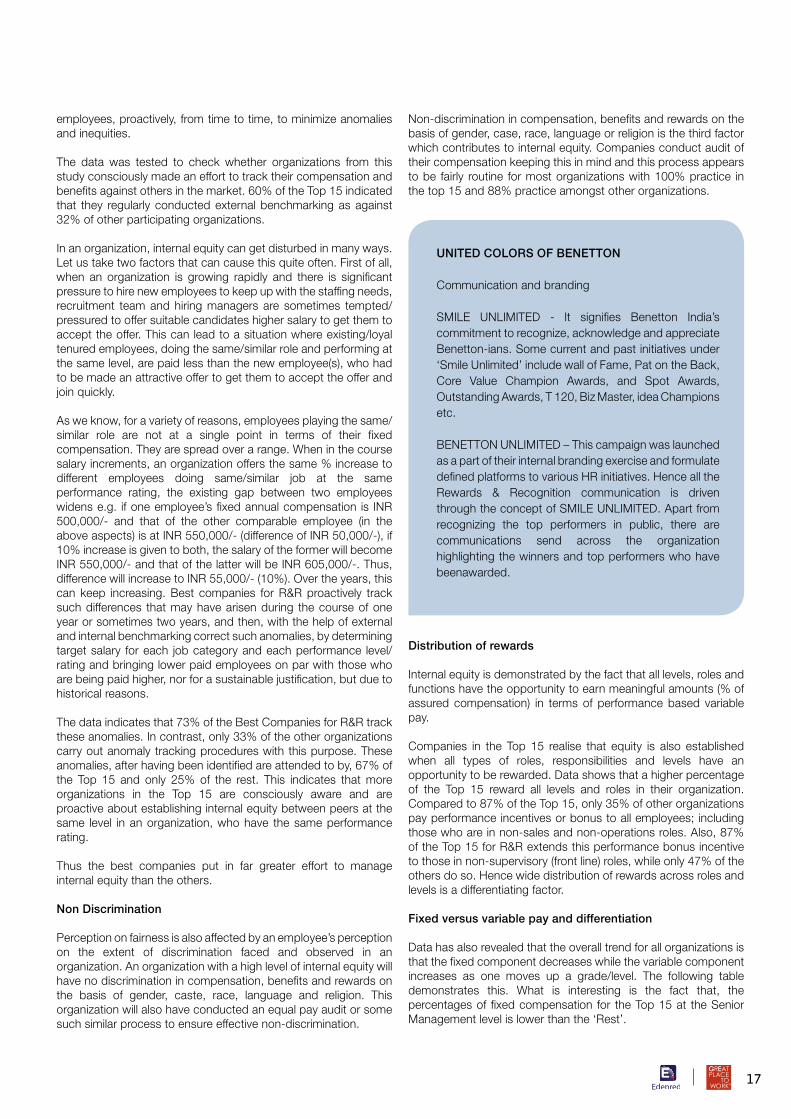
Total Compensation of the CEO of the organization, when compared to that of fresh graduates and MBA’s/Engineers/CAs is a smaller multiple of the compensation of these categories. Given the fact that CEOs (with some guidance & governance from the Board of Directors and/or Compensation Committee of the Board) significantly influence their own compensation, a lower ratio between the CEO’s total compensations and that of other categories mentioned here, shows restraint and a sense of fairness on the part of the CEO and the Board/Compensation Committee and the organisation.
The data in figures 6, 7 and 8 suggests that the difference between the CEO’s salary and entry level personnel is significantly lower for
Ceo's Salary compared to a
Graduate
Number of respondents
AVERAGE of Top 15 26 times 10
AVERAGE OF THE REST 46 times 25
Figure 8: Comparison of the CEO’s Salary to that of a fresh graduate/ engineering graduate.
RADIO CITY – 91.1 FM
Proportion of variable pay depending on:
Organization Achievement
B1 - Senior Management 50%
B2 - Middle Management 25%
B3 - Junior Management 0
Individual Achievement
B1 - Senior Management50%
B2 - Middle Management 75%
B3 - Junior Management 100%
_______________________________________________
MAHINDRA INTERTRADE
Overseas Incentive Scheme
Successful teams travel for 3 nights/4days on a leisure trip. The organization takes pride in seeing the delight in the eyes of employees, most of whom are from tier-II and tier-III cities and many of these were on their maiden overseas trip, courtesy the overseas incentive scheme. In fact significant number of employees applied for a passport as they were eligible for a company sponsored overseas incentive trip.
Average of Top 15
(INR lakhs)
Average of Rest (60)
(INR lakhs)
Supervisory - Min 5 5
Supervisory - Max 6 6
Managerial - Min 14 12
Managerial - Max 17 15
Senior Managerial - Min 43 37
Senior Managerial - Max 52 52
Figure 6: Comparison of Minimum and Maximum Fixed Compensation
Ceo's Salary compared to a Fresh MBA -
Number of respondents
AVERAGE of Top 15 18 times 9
AVERAGE OF THE REST 26 times 23
Figure 7: Comparison of the CEO’s Salary to that of an entry level MBA.
16
employees, proactively, from time to time, to minimize anomalies and inequities.
The data was tested to check whether organizations from this study consciously made an effort to track their compensation and benefits against others in the market. 60% of the Top 15 indicated that they regularly conducted external benchmarking as against 32% of other participating organizations.
In an organization, internal equity can get disturbed in many ways. Let us take two factors that can cause this quite often. First of all, when an organization is growing rapidly and there is significant pressure to hire new employees to keep up with the staffing needs, recruitment team and hiring managers are sometimes tempted/pressured to offer suitable candidates higher salary to get them to accept the offer. This can lead to a situation where existing/loyal tenured employees, doing the same/similar role and performing at the same level, are paid less than the new employee(s), who had to be made an attractive offer to get them to accept the offer and join quickly.
As we know, for a variety of reasons, employees playing the same/similar role are not at a single point in terms of their fixed compensation. They are spread over a range. When in the course salary increments, an organization offers the same % increase to different employees doing same/similar job at the same performance rating, the existing gap between two employees widens e.g. if one employee’s fixed annual compensation is INR 500,000/- and that of the other comparable employee (in the above aspects) is at INR 550,000/- (difference of INR 50,000/-), if 10% increase is given to both, the salary of the former will become INR 550,000/- and that of the latter will be INR 605,000/-. Thus, difference will increase to INR 55,000/- (10%). Over the years, this can keep increasing. Best companies for R&R proactively track such differences that may have arisen during the course of one year or sometimes two years, and then, with the help of external and internal benchmarking correct such anomalies, by determining target salary for each job category and each performance level/rating and bringing lower paid employees on par with those who are being paid higher, nor for a sustainable justification, but due to historical reasons.
The data indicates that 73% of the Best Companies for R&R track these anomalies. In contrast, only 33% of the other organizations carry out anomaly tracking procedures with this purpose. These anomalies, after having been identified are attended to by, 67% of the Top 15 and only 25% of the rest. This indicates that more organizations in the Top 15 are consciously aware and are proactive about establishing internal equity between peers at the same level in an organization, who have the same performance rating.
Thus the best companies put in far greater effort to manage internal equity than the others.
Non Discrimination
Perception on fairness is also affected by an employee’s perception on the extent of discrimination faced and observed in an organization. An organization with a high level of internal equity will have no discrimination in compensation, benefits and rewards on the basis of gender, caste, race, language and religion. This organization will also have conducted an equal pay audit or some such similar process to ensure effective non-discrimination.
Non-discrimination in compensation, benefits and rewards on the basis of gender, case, race, language or religion is the third factor which contributes to internal equity. Companies conduct audit of their compensation keeping this in mind and this process appears to be fairly routine for most organizations with 100% practice in the top 15 and 88% practice amongst other organizations.
Distribution of rewards
Internal equity is demonstrated by the fact that all levels, roles and functions have the opportunity to earn meaningful amounts (% of assured compensation) in terms of performance based variable pay.
Companies in the Top 15 realise that equity is also established when all types of roles, responsibilities and levels have an opportunity to be rewarded. Data shows that a higher percentage of the Top 15 reward all levels and roles in their organization. Compared to 87% of the Top 15, only 35% of other organizations pay performance incentives or bonus to all employees; including those who are in non-sales and non-operations roles. Also, 87% of the Top 15 for R&R extends this performance bonus incentive to those in non-supervisory (front line) roles, while only 47% of the others do so. Hence wide distribution of rewards across roles and levels is a differentiating factor.
Fixed versus variable pay and differentiation
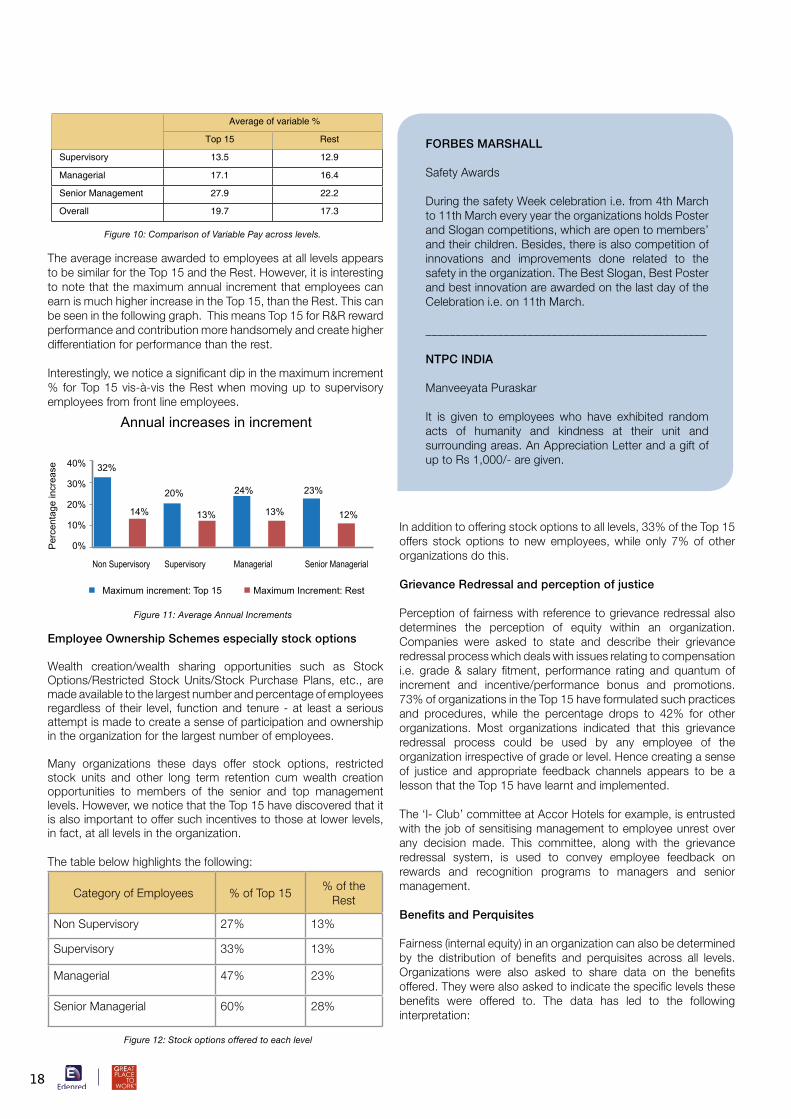
Data has also revealed that the overall trend for all organizations is that the fixed component decreases while the variable component increases as one moves up a grade/level. The following table demonstrates this. What is interesting is the fact that, the percentages of fixed compensation for the Top 15 at the Senior Management level is lower than the ‘Rest’.
UNITED COLORS OF BENETTON
Communication and branding
SMILE UNLIMITED - It signifies Benetton India’s commitment to recognize, acknowledge and appreciate Benetton-ians. Some current and past initiatives under ‘Smile Unlimited’ include wall of Fame, Pat on the Back, Core Value Champion Awards, and Spot Awards, Outstanding Awards, T 120, Biz Master, idea Champions etc.
BENETTON UNLIMITED – This campaign was launched as a part of their internal branding exercise and formulate defined platforms to various HR initiatives. Hence all the Rewards & Recognition communication is driven through the concept of SMILE UNLIMITED. Apart from recognizing the top performers in public, there are communications send across the organization highlighting the winners and top performers who have beenawarded.
17
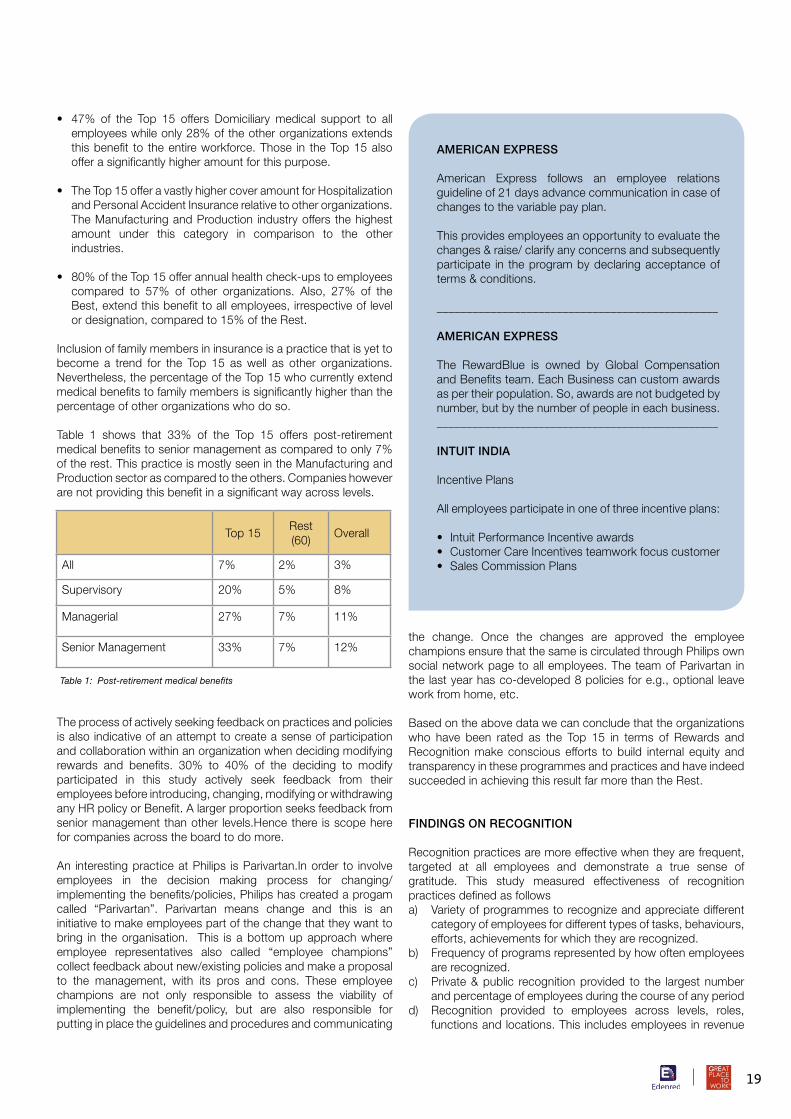
The average increase awarded to employees at all levels appears to be similar for the Top 15 and the Rest. However, it is interesting to note that the maximum annual increment that employees can earn is much higher increase in the Top 15, than the Rest. This can be seen in the following graph. This means Top 15 for R&R reward performance and contribution more handsomely and create higher differentiation for performance than the rest.
Interestingly, we notice a significant dip in the maximum increment % for Top 15 vis-à-vis the Rest when moving up to supervisory employees from front line employees.
Employee Ownership Schemes especially stock options
Wealth creation/wealth sharing opportunities such as Stock Options/Restricted Stock Units/Stock Purchase Plans, etc., are made available to the largest number and percentage of employees regardless of their level, function and tenure - at least a serious attempt is made to create a sense of participation and ownership in the organization for the largest number of employees.
Many organizations these days offer stock options, restricted stock units and other long term retention cum wealth creation opportunities to members of the senior and top management levels. However, we notice that the Top 15 have discovered that it is also important to offer such incentives to those at lower levels, in fact, at all levels in the organization.
The table below highlights the following:
In addition to offering stock options to all levels, 33% of the Top 15 offers stock options to new employees, while only 7% of other organizations do this.
Grievance Redressal and perception of justice
Perception of fairness with reference to grievance redressal also determines the perception of equity within an organization. Companies were asked to state and describe their grievance redressal process which deals with issues relating to compensation i.e. grade & salary fitment, performance rating and quantum of increment and incentive/performance bonus and promotions. 73% of organizations in the Top 15 have formulated such practices and procedures, while the percentage drops to 42% for other organizations. Most organizations indicated that this grievance redressal process could be used by any employee of the organization irrespective of grade or level. Hence creating a sense of justice and appropriate feedback channels appears to be a lesson that the Top 15 have learnt and implemented.
The ‘I- Club’ committee at Accor Hotels for example, is entrusted with the job of sensitising management to employee unrest over any decision made. This committee, along with the grievance redressal system, is used to convey employee feedback on rewards and recognition programs to managers and senior management.
Benefits and Perquisites
Fairness (internal equity) in an organization can also be determined by the distribution of benefits and perquisites across all levels. Organizations were also asked to share data on the benefits offered. They were also asked to indicate the specific levels these benefits were offered to. The data has led to the following interpretation:
Average of variable %
Top 15 Rest
Supervisory 13.5 12.9
Managerial 17.1 16.4
Senior Management 27.9 22.2
Overall 19.7 17.3
FORBES MARSHALL
Safety Awards
During the safety Week celebration i.e. from 4th March to 11th March every year the organizations holds Poster and Slogan competitions, which are open to members’ and their children. Besides, there is also competition of innovations and improvements done related to the safety in the organization. The Best Slogan, Best Poster and best innovation are awarded on the last day of the Celebration i.e. on 11th March.
_______________________________________________
NTPC INDIA
Manveeyata Puraskar
It is given to employees who have exhibited random acts of humanity and kindness at their unit and surrounding areas. An Appreciation Letter and a gift of up to Rs 1,000/- are given.
Category of Employees % of Top 15 % of the
Rest
Non Supervisory 27% 13%
Supervisory 33% 13%
Managerial 47% 23%
Senior Managerial 60% 28%
Figure 12: Stock options offered to each level
40%
30%
20%
10%
0%
32%
14%
20%
13%
24%
13%
23%
12%
Annual increases in increment
Maximum increment: Top 15 Maximum Increment: Rest
Non Supervisory Supervisory Managerial Senior Managerial
Per
cent
age
incr
ease
Figure 11: Average Annual Increments
Figure 10: Comparison of Variable Pay across levels.
18
• 47% of the Top 15 offers Domiciliary medical support to allemployees while only 28% of the other organizations extends this benefit to the entire workforce. Those in the Top 15 also offer a significantly higher amount for this purpose.
• TheTop15offeravastlyhighercoveramountforHospitalizationand Personal Accident Insurance relative to other organizations. The Manufacturing and Production industry offers the highest amount under this category in comparison to the other industries.
• 80%oftheTop15offerannualhealthcheck-upstoemployeescompared to 57% of other organizations. Also, 27% of the Best, extend this benefit to all employees, irrespective of level or designation, compared to 15% of the Rest.
Inclusion of family members in insurance is a practice that is yet to become a trend for the Top 15 as well as other organizations. Nevertheless, the percentage of the Top 15 who currently extend medical benefits to family members is significantly higher than the percentage of other organizations who do so.
Table 1 shows that 33% of the Top 15 offers post-retirement medical benefits to senior management as compared to only 7% of the rest. This practice is mostly seen in the Manufacturing and Production sector as compared to the others. Companies however are not providing this benefit in a significant way across levels.
The process of actively seeking feedback on practices and policies is also indicative of an attempt to create a sense of participation and collaboration within an organization when deciding modifying rewards and benefits. 30% to 40% of the deciding to modify participated in this study actively seek feedback from their employees before introducing, changing, modifying or withdrawing any HR policy or Benefit. A larger proportion seeks feedback from senior management than other levels.Hence there is scope here for companies across the board to do more.
An interesting practice at Philips is Parivartan.In order to involve employees in the decision making process for changing/implementing the benefits/policies, Philips has created a progam called “Parivartan”. Parivartan means change and this is an initiative to make employees part of the change that they want to bring in the organisation. This is a bottom up approach where employee representatives also called “employee champions” collect feedback about new/existing policies and make a proposal to the management, with its pros and cons. These employee champions are not only responsible to assess the viability of implementing the benefit/policy, but are also responsible for putting in place the guidelines and procedures and communicating
the change. Once the changes are approved the employee champions ensure that the same is circulated through Philips own social network page to all employees. The team of Parivartan in the last year has co-developed 8 policies for e.g., optional leave work from home, etc.
Based on the above data we can conclude that the organizations who have been rated as the Top 15 in terms of Rewards and Recognition make conscious efforts to build internal equity and transparency in these programmes and practices and have indeed succeeded in achieving this result far more than the Rest.
FINDINGS ON RECOGNITION
Recognition practices are more effective when they are frequent, targeted at all employees and demonstrate a true sense of gratitude. This study measured effectiveness of recognition practices defined as followsa) Variety of programmes to recognize and appreciate different
category of employees for different types of tasks, behaviours, efforts, achievements for which they are recognized.
b) Frequency of programs represented by how often employees are recognized.
c) Private & public recognition provided to the largest number and percentage of employees during the course of any period
d) Recognition provided to employees across levels, roles, functions and locations. This includes employees in revenue
Table 1: Post-retirement medical benefits
Top 15Rest (60)
Overall
All 7% 2% 3%
Supervisory 20% 5% 8%
Managerial 27% 7% 11%
Senior Management 33% 7% 12%
AMERICAN EXPRESS
American Express follows an employee relations guideline of 21 days advance communication in case of changes to the variable pay plan.
This provides employees an opportunity to evaluate the changes & raise/ clarify any concerns and subsequently participate in the program by declaring acceptance of terms & conditions.
_______________________________________________
AMERICAN EXPRESS
The RewardBlue is owned by Global Compensation and Benefits team. Each Business can custom awards as per their population. So, awards are not budgeted by number, but by the number of people in each business._______________________________________________
INTUIT INDIA
Incentive Plans
All employees participate in one of three incentive plans:
• Intuit Performance Incentive awards • Customer Care Incentives teamwork focus customer • Sales Commission Plans
19
earning & customer/client impacting as well as enabling support functions.
e) Employees are recognized and appreciated for their loyalty i.e. long tenure.
f) Recognition of results or outcomes along with effort which take the form of going the extra mile, demonstration of desired actions and behaviours, adherence and upholding of values, etc.
g) Inclusiveness of recognition defined by the fact that it flows from and in all directions – not only from seniors to juniors, but between peers, from juniors to seniors, across functions, business units & locations, to even outsiders and from outsiders (such as clients, suppliers, business partners, service providers, industry peers, etc.).
h) Recognition and celebrations are done for not only work related efforts and achievements/results, but for achievements which are beyond work as well .
i) Achievements of family members are also recognized, appreciated and rewarded publicly within the organization.
j) Family members are informed and thanked and/or invited to participate in events and functions where employees are being recognized and felicitated.
k) Forms of recognition i.e. private and public, emotional & personal as compared to the ones with trophy value.
l) Personalization of gifts and forms of recognition i.e. thought is given to what the recipient of recognition really likes book(s) to a bookworm, movie ticket(s) to a movie buff, music CD(s) or ticket(s) to a music concert to a music lover, coupon to a restaurant to a foodie, etc.
m) Extent of feedback and inputs sought from supervisors, managers and employees on what should be recognized and appreciated.
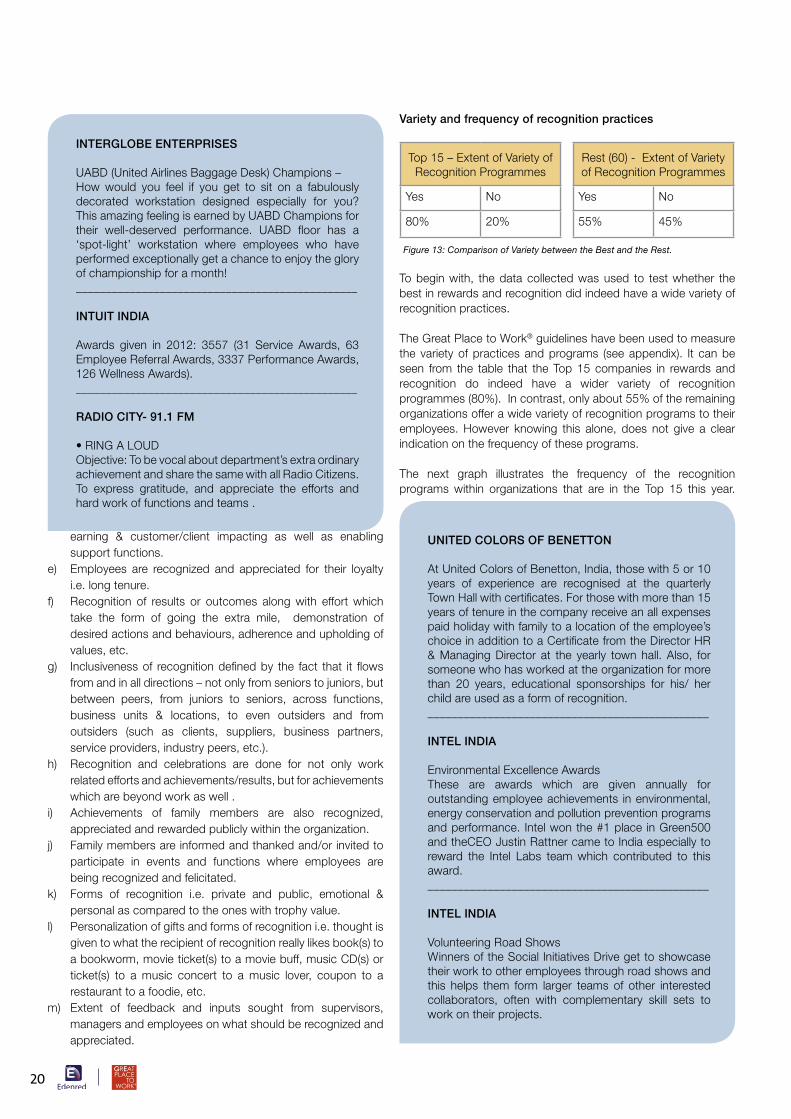
Variety and frequency of recognition practices
To begin with, the data collected was used to test whether the best in rewards and recognition did indeed have a wide variety of recognition practices.
The Great Place to Work® guidelines have been used to measure the variety of practices and programs (see appendix). It can be seen from the table that the Top 15 companies in rewards and recognition do indeed have a wider variety of recognition programmes (80%). In contrast, only about 55% of the remaining organizations offer a wide variety of recognition programs to their employees. However knowing this alone, does not give a clear indication on the frequency of these programs.
The next graph illustrates the frequency of the recognition programs within organizations that are in the Top 15 this year.
INTERGLOBE ENTERPRISES
UABD (United Airlines Baggage Desk) Champions –How would you feel if you get to sit on a fabulously decorated workstation designed especially for you? This amazing feeling is earned by UABD Champions for their well-deserved performance. UABD floor has a ‘spot-light’ workstation where employees who have performed exceptionally get a chance to enjoy the glory of championship for a month!_______________________________________________
INTUIT INDIA
Awards given in 2012: 3557 (31 Service Awards, 63 Employee Referral Awards, 3337 Performance Awards, 126 Wellness Awards). _______________________________________________
RADIO CITY- 91.1 FM
•RINGALOUDObjective: To be vocal about department’s extra ordinary achievement and share the same with all Radio Citizens. To express gratitude, and appreciate the efforts and hard work of functions and teams .
UNITED COLORS OF BENETTON
At United Colors of Benetton, India, those with 5 or 10 years of experience are recognised at the quarterly Town Hall with certificates. For those with more than 15 years of tenure in the company receive an all expenses paid holiday with family to a location of the employee’s choice in addition to a Certificate from the Director HR & Managing Director at the yearly town hall. Also, for someone who has worked at the organization for more than 20 years, educational sponsorships for his/ her child are used as a form of recognition._______________________________________________
INTEL INDIA
Environmental Excellence AwardsThese are awards which are given annually for outstanding employee achievements in environmental, energy conservation and pollution prevention programs and performance. Intel won the #1 place in Green500 and theCEO Justin Rattner came to India especially to reward the Intel Labs team which contributed to this award. _______________________________________________
INTEL INDIA
Volunteering Road ShowsWinners of the Social Initiatives Drive get to showcase their work to other employees through road shows and this helps them form larger teams of other interested collaborators, often with complementary skill sets to work on their projects.
Top 15 – Extent of Variety of Recognition Programmes
Yes No
80% 20%
Rest (60) - Extent of Variety of Recognition Programmes
Yes No
55% 45%
Figure 13: Comparison of Variety between the Best and the Rest.
20
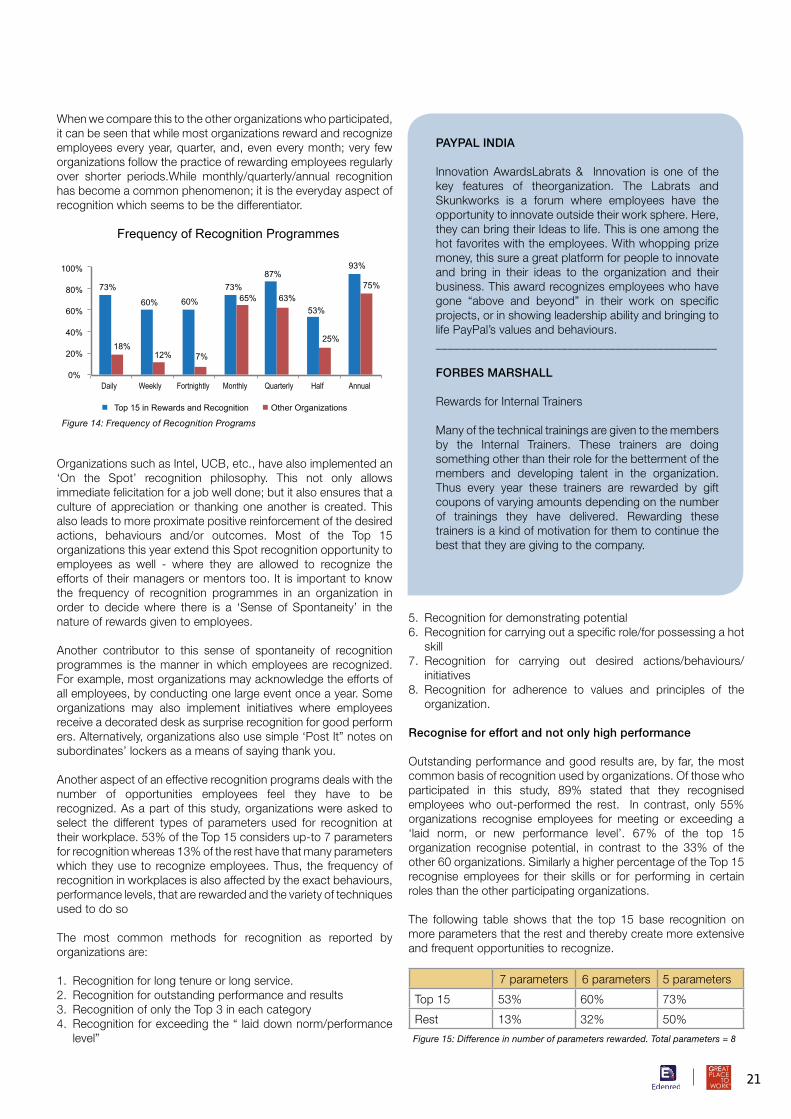
When we compare this to the other organizations who participated, it can be seen that while most organizations reward and recognize employees every year, quarter, and, even every month; very few organizations follow the practice of rewarding employees regularly over shorter periods.While monthly/quarterly/annual recognition has become a common phenomenon; it is the everyday aspect of recognition which seems to be the differentiator.
Organizations such as Intel, UCB, etc., have also implemented an ‘On the Spot’ recognition philosophy. This not only allows immediate felicitation for a job well done; but it also ensures that a culture of appreciation or thanking one another is created. This also leads to more proximate positive reinforcement of the desired actions, behaviours and/or outcomes. Most of the Top 15 organizations this year extend this Spot recognition opportunity to employees as well - where they are allowed to recognize the efforts of their managers or mentors too. It is important to know the frequency of recognition programmes in an organization in order to decide where there is a ‘Sense of Spontaneity’ in the nature of rewards given to employees.
Another contributor to this sense of spontaneity of recognition programmes is the manner in which employees are recognized. For example, most organizations may acknowledge the efforts of all employees, by conducting one large event once a year. Some organizations may also implement initiatives where employees receive a decorated desk as surprise recognition for good perform ers. Alternatively, organizations also use simple ‘Post It” notes on subordinates’ lockers as a means of saying thank you.
Another aspect of an effective recognition programs deals with the number of opportunities employees feel they have to be recognized. As a part of this study, organizations were asked to select the different types of parameters used for recognition at their workplace. 53% of the Top 15 considers up-to 7 parameters for recognition whereas 13% of the rest have that many parameters which they use to recognize employees. Thus, the frequency of recognition in workplaces is also affected by the exact behaviours, performance levels, that are rewarded and the variety of techniques used to do so
The most common methods for recognition as reported by organizations are:
1. Recognition for long tenure or long service.2. Recognition for outstanding performance and results3. Recognition of only the Top 3 in each category4. Recognition for exceeding the “ laid down norm/performance
level”
5. Recognition for demonstrating potential6. Recognition for carrying out a specific role/for possessing a hot
skill7. Recognition for carrying out desired actions/behaviours/
initiatives8. Recognition for adherence to values and principles of the
organization.
Recognise for effort and not only high performance
Outstanding performance and good results are, by far, the most common basis of recognition used by organizations. Of those who participated in this study, 89% stated that they recognised employees who out-performed the rest. In contrast, only 55% organizations recognise employees for meeting or exceeding a ‘laid norm, or new performance level’. 67% of the top 15 organization recognise potential, in contrast to the 33% of the other 60 organizations. Similarly a higher percentage of the Top 15 recognise employees for their skills or for performing in certain roles than the other participating organizations.
The following table shows that the top 15 base recognition on more parameters that the rest and thereby create more extensive and frequent opportunities to recognize.
PAYPAL INDIA
Innovation AwardsLabrats & Innovation is one of the key features of theorganization. The Labrats and Skunkworks is a forum where employees have the opportunity to innovate outside their work sphere. Here, they can bring their Ideas to life. This is one among the hot favorites with the employees. With whopping prize money, this sure a great platform for people to innovate and bring in their ideas to the organization and their business. This award recognizes employees who have gone “above and beyond” in their work on specific projects, or in showing leadership ability and bringing to life PayPal’s values and behaviours._______________________________________________
FORBES MARSHALL
Rewards for Internal Trainers
Many of the technical trainings are given to the members by the Internal Trainers. These trainers are doing something other than their role for the betterment of the members and developing talent in the organization. Thus every year these trainers are rewarded by gift coupons of varying amounts depending on the number of trainings they have delivered. Rewarding these trainers is a kind of motivation for them to continue the best that they are giving to the company.
100%
80%
60%
40%
20%
0%
73%
18%
60%
12%
60%
7%
73%65%
87%
63%
93%
75%
53%
25%
Frequency of Recognition Programmes
Top 15 in Rewards and Recognition Other Organizations
Daily Weekly Fortnightly Monthly Quarterly Half Annual
Figure 14: Frequency of Recognition Programs
Figure 15: Difference in number of parameters rewarded. Total parameters = 8
7 parameters 6 parameters 5 parameters
Top 15 53% 60% 73%
Rest 13% 32% 50%
21
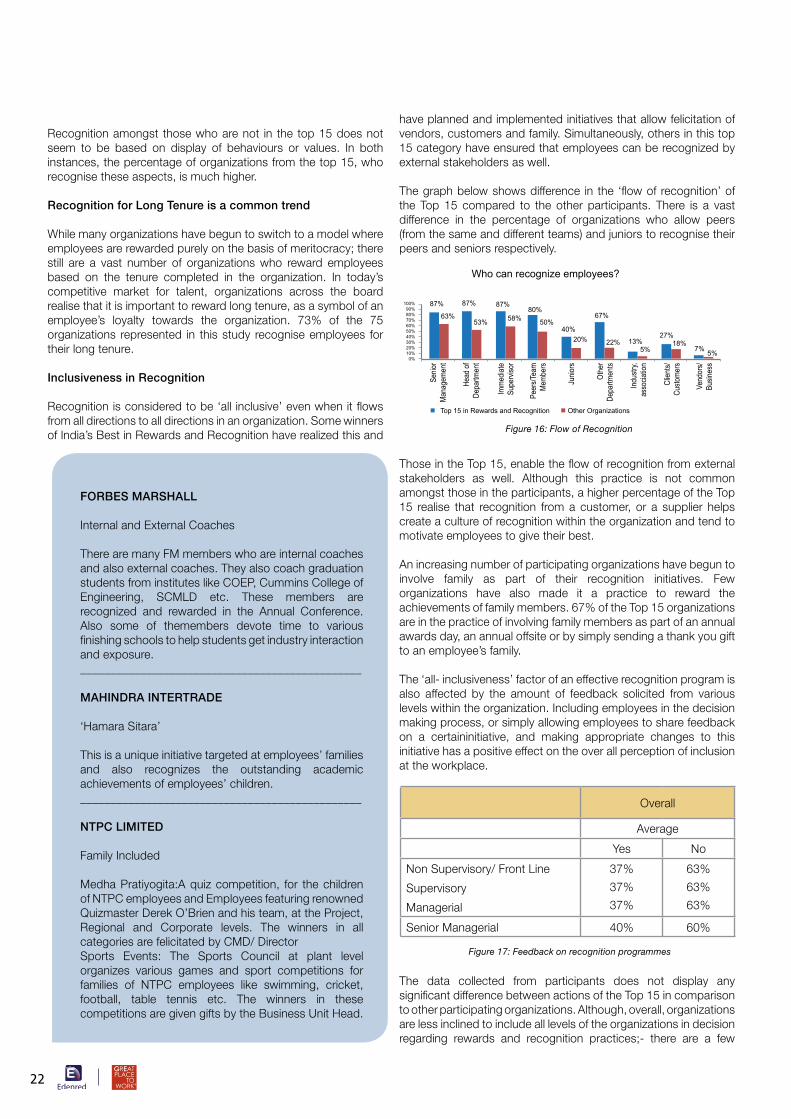
Recognition amongst those who are not in the top 15 does not seem to be based on display of behaviours or values. In both instances, the percentage of organizations from the top 15, who recognise these aspects, is much higher.
Recognition for Long Tenure is a common trend
While many organizations have begun to switch to a model where employees are rewarded purely on the basis of meritocracy; there still are a vast number of organizations who reward employees based on the tenure completed in the organization. In today’s competitive market for talent, organizations across the board realise that it is important to reward long tenure, as a symbol of an employee’s loyalty towards the organization. 73% of the 75 organizations represented in this study recognise employees for their long tenure.
Inclusiveness in Recognition
Recognition is considered to be ‘all inclusive’ even when it flows from all directions to all directions in an organization. Some winners of India’s Best in Rewards and Recognition have realized this and
have planned and implemented initiatives that allow felicitation of vendors, customers and family. Simultaneously, others in this top 15 category have ensured that employees can be recognized by external stakeholders as well.
The graph below shows difference in the ‘flow of recognition’ of the Top 15 compared to the other participants. There is a vast difference in the percentage of organizations who allow peers (from the same and different teams) and juniors to recognise their peers and seniors respectively.
Those in the Top 15, enable the flow of recognition from external stakeholders as well. Although this practice is not common amongst those in the participants, a higher percentage of the Top 15 realise that recognition from a customer, or a supplier helps create a culture of recognition within the organization and tend to motivate employees to give their best.
An increasing number of participating organizations have begun to involve family as part of their recognition initiatives. Few organizations have also made it a practice to reward the achievements of family members. 67% of the Top 15 organizations are in the practice of involving family members as part of an annual awards day, an annual offsite or by simply sending a thank you gift to an employee’s family.
The ‘all- inclusiveness’ factor of an effective recognition program is also affected by the amount of feedback solicited from various levels within the organization. Including employees in the decision making process, or simply allowing employees to share feedback on a certaininitiative, and making appropriate changes to this initiative has a positive effect on the over all perception of inclusion at the workplace.
The data collected from participants does not display any significant difference between actions of the Top 15 in comparison to other participating organizations. Although, overall, organizations are less inclined to include all levels of the organizations in decision regarding rewards and recognition practices;- there are a few
FORBES MARSHALL
Internal and External Coaches
There are many FM members who are internal coaches and also external coaches. They also coach graduation students from institutes like COEP, Cummins College of Engineering, SCMLD etc. These members are recognized and rewarded in the Annual Conference. Also some of themembers devote time to various finishing schools to help students get industry interaction and exposure._______________________________________________
MAHINDRA INTERTRADE
‘Hamara Sitara’
This is a unique initiative targeted at employees’ families and also recognizes the outstanding academic achievements of employees’ children._______________________________________________
NTPC LIMITED
Family Included
Medha Pratiyogita:A quiz competition, for the children of NTPC employees and Employees featuring renowned Quizmaster Derek O’Brien and his team, at the Project, Regional and Corporate levels. The winners in all categories are felicitated by CMD/ Director Sports Events: The Sports Council at plant level organizes various games and sport competitions for families of NTPC employees like swimming, cricket, football, table tennis etc. The winners in these competitions are given gifts by the Business Unit Head.
100% 90% 80% 70% 60% 50% 40% 30% 20% 10% 0%
87%
63%
87%
53%
87%
58%80%
50%40%
20% 13%5%
27%18%
7% 5%
67%
22%
Who can recognize employees?
Top 15 in Rewards and Recognition Other Organizations
Senio
r Ma
nage
ment
Head
of
Depa
rtmen
t
Imme
diate
Supe
rviso
r
Peer
s/Tea
m Me
mber
s
Junio
rs
Othe
r De
partm
ents
Indus
try,
asso
ciatio
n
Clien
ts/Cu
stome
rs
Vend
ors/
Busin
ess
Figure 16: Flow of Recognition
Figure 17: Feedback on recognition programmes
Overall
Average
Yes No
Non Supervisory/ Front Line
Supervisory
Managerial
37%
37%
37%
63%
63%
63%
Senior Managerial 40% 60%
22
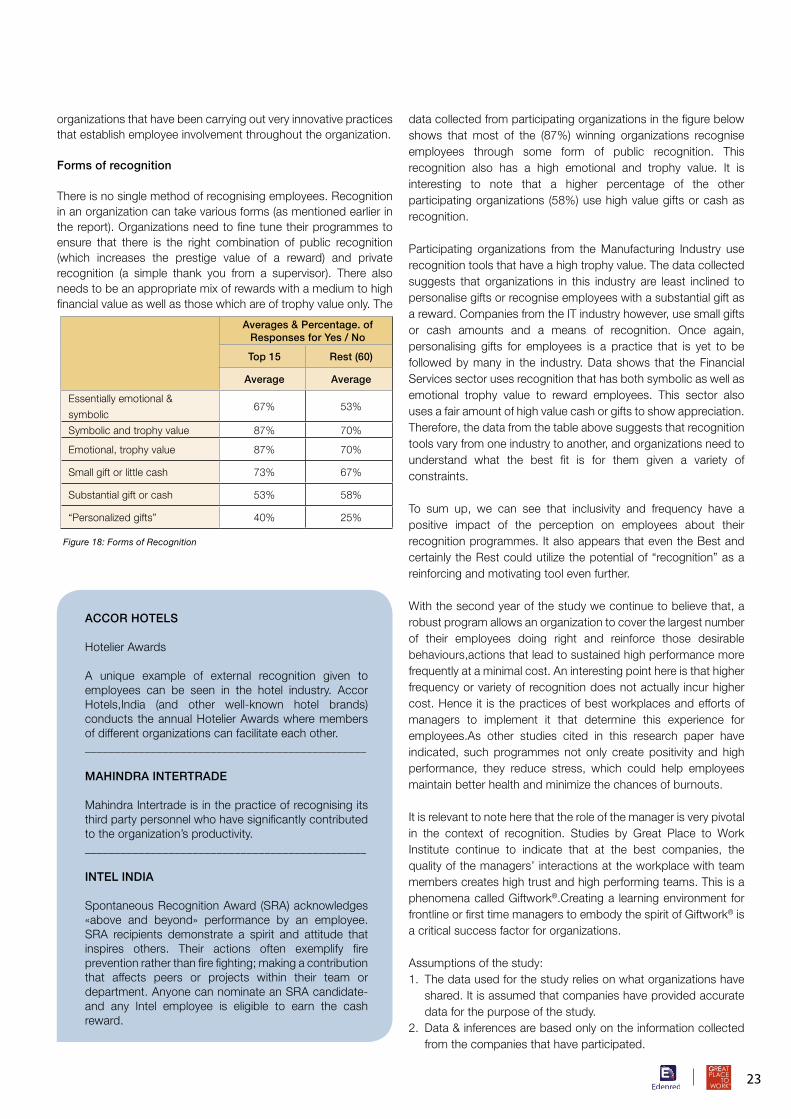
organizations that have been carrying out very innovative practices that establish employee involvement throughout the organization.
Forms of recognition
There is no single method of recognising employees. Recognition in an organization can take various forms (as mentioned earlier in the report). Organizations need to fine tune their programmes to ensure that there is the right combination of public recognition (which increases the prestige value of a reward) and private recognition (a simple thank you from a supervisor). There also needs to be an appropriate mix of rewards with a medium to high financial value as well as those which are of trophy value only. The
data collected from participating organizations in the figure below shows that most of the (87%) winning organizations recognise employees through some form of public recognition. This recognition also has a high emotional and trophy value. It is interesting to note that a higher percentage of the other participating organizations (58%) use high value gifts or cash as recognition.
Participating organizations from the Manufacturing Industry use recognition tools that have a high trophy value. The data collected suggests that organizations in this industry are least inclined to personalise gifts or recognise employees with a substantial gift as a reward. Companies from the IT industry however, use small gifts or cash amounts and a means of recognition. Once again, personalising gifts for employees is a practice that is yet to be followed by many in the industry. Data shows that the Financial Services sector uses recognition that has both symbolic as well as emotional trophy value to reward employees. This sector also uses a fair amount of high value cash or gifts to show appreciation.Therefore, the data from the table above suggests that recognition tools vary from one industry to another, and organizations need to understand what the best fit is for them given a variety of constraints.
To sum up, we can see that inclusivity and frequency have a positive impact of the perception on employees about their recognition programmes. It also appears that even the Best and certainly the Rest could utilize the potential of “recognition” as a reinforcing and motivating tool even further.
With the second year of the study we continue to believe that, a robust program allows an organization to cover the largest number of their employees doing right and reinforce those desirable behaviours,actions that lead to sustained high performance more frequently at a minimal cost. An interesting point here is that higher frequency or variety of recognition does not actually incur higher cost. Hence it is the practices of best workplaces and efforts of managers to implement it that determine this experience for employees.As other studies cited in this research paper have indicated, such programmes not only create positivity and high performance, they reduce stress, which could help employees maintain better health and minimize the chances of burnouts.
It is relevant to note here that the role of the manager is very pivotal in the context of recognition. Studies by Great Place to Work Institute continue to indicate that at the best companies, the quality of the managers’ interactions at the workplace with team members creates high trust and high performing teams. This is a phenomena called Giftwork®.Creating a learning environment for frontline or first time managers to embody the spirit of Giftwork® is a critical success factor for organizations.
Assumptions of the study:1. The data used for the study relies on what organizations have
shared. It is assumed that companies have provided accurate data for the purpose of the study.
2. Data & inferences are based only on the information collected from the companies that have participated.
ACCOR HOTELS
Hotelier Awards
A unique example of external recognition given to employees can be seen in the hotel industry. Accor Hotels,India (and other well-known hotel brands) conducts the annual Hotelier Awards where members of different organizations can facilitate each other._______________________________________________
MAHINDRA INTERTRADE
Mahindra Intertrade is in the practice of recognising its third party personnel who have significantly contributed to the organization’s productivity._______________________________________________
INTEL INDIA
Spontaneous Recognition Award (SRA) acknowledges «above and beyond» performance by an employee. SRA recipients demonstrate a spirit and attitude that inspires others. Their actions often exemplify fire prevention rather than fire fighting; making a contribution that affects peers or projects within their team or department. Anyone can nominate an SRA candidate-and any Intel employee is eligible to earn the cash reward.
Averages & Percentage. of Responses for Yes / No
Top 15 Rest (60)
Average Average
Essentially emotional &
symbolic67% 53%
Symbolic and trophy value 87% 70%
Emotional, trophy value 87% 70%
Small gift or little cash 73% 67%
Substantial gift or cash 53% 58%
“Personalized gifts” 40% 25%
Figure 18: Forms of Recognition
23
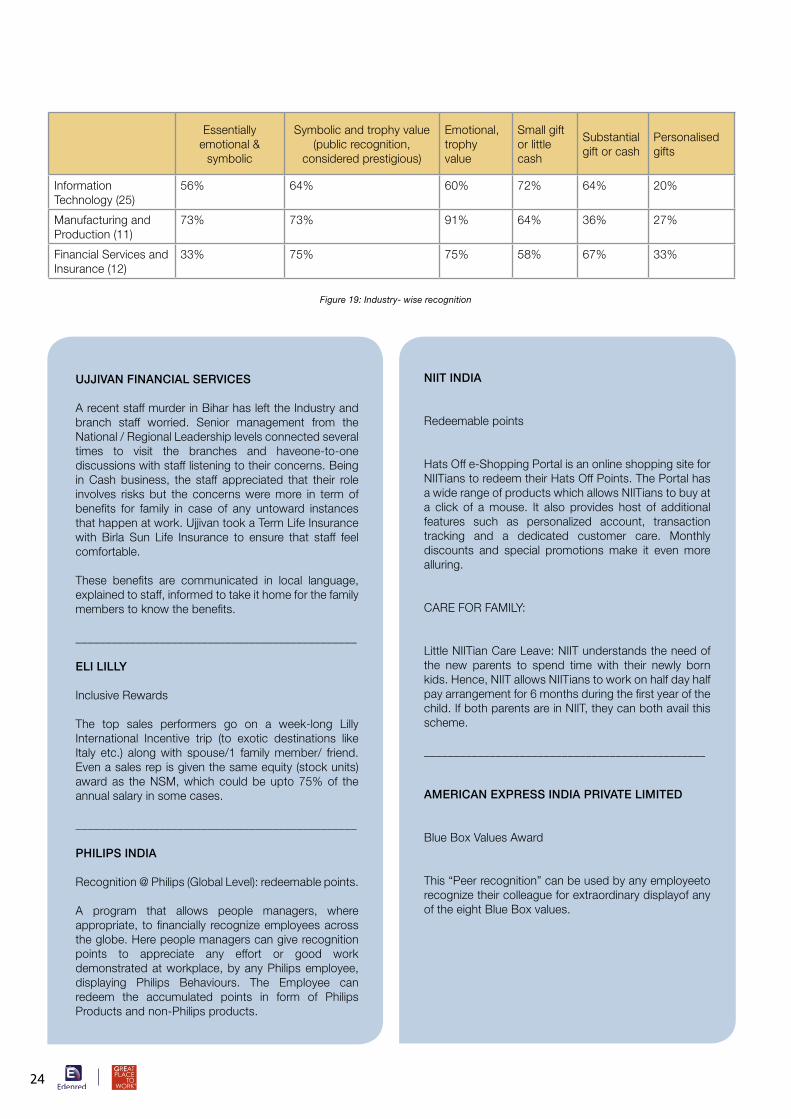
NIIT INDIA
Redeemable points
Hats Off e-Shopping Portal is an online shopping site for NIITians to redeem their Hats Off Points. The Portal has a wide range of products which allows NIITians to buy at a click of a mouse. It also provides host of additional features such as personalized account, transaction tracking and a dedicated customer care. Monthly discounts and special promotions make it even more alluring.
CARE FOR FAMILY:
Little NIITian Care Leave: NIIT understands the need of the new parents to spend time with their newly born kids. Hence, NIIT allows NIITians to work on half day half pay arrangement for 6 months during the first year of the child. If both parents are in NIIT, they can both avail this scheme.
_______________________________________________
AMERICAN EXPRESS INDIA PRIVATE LIMITED
Blue Box Values Award
This “Peer recognition” can be used by any employeeto recognize their colleague for extraordinary displayof any of the eight Blue Box values.
Essentially emotional &
symbolic
Symbolic and trophy value (public recognition,
considered prestigious)
Emotional, trophy value
Small gift or little cash
Substantial gift or cash
Personalised gifts
Information Technology (25)
56% 64% 60% 72% 64% 20%
Manufacturing and Production (11)
73% 73% 91% 64% 36% 27%
Financial Services and Insurance (12)
33% 75% 75% 58% 67% 33%
Figure 19: Industry- wise recognition
UJJIVAN FINANCIAL SERVICES
A recent staff murder in Bihar has left the Industry and branch staff worried. Senior management from the National / Regional Leadership levels connected several times to visit the branches and haveone-to-one discussions with staff listening to their concerns. Being in Cash business, the staff appreciated that their role involves risks but the concerns were more in term of benefits for family in case of any untoward instances that happen at work. Ujjivan took a Term Life Insurance with Birla Sun Life Insurance to ensure that staff feel comfortable.
These benefits are communicated in local language, explained to staff, informed to take it home for the family members to know the benefits.
_______________________________________________
ELI LILLY
Inclusive Rewards
The top sales performers go on a week-long Lilly International Incentive trip (to exotic destinations like Italy etc.) along with spouse/1 family member/ friend. Even a sales rep is given the same equity (stock units) award as the NSM, which could be upto 75% of the annual salary in some cases.
_______________________________________________
PHILIPS INDIA
Recognition @ Philips (Global Level): redeemable points.
A program that allows people managers, where appropriate, to financially recognize employees across the globe. Here people managers can give recognition points to appreciate any effort or good work demonstrated at workplace, by any Philips employee, displaying Philips Behaviours. The Employee can redeem the accumulated points in form of Philips Products and non-Philips products.
24
We hope that based on differentiating evidence, this research paper has been able to persuasively argue that it is not the quantum of money alone, especially after a critical threshold is crossed, that help R&R programmes work for the employees, and in turn, for their organizations.Essentially it is a sense of fairness along with frequent, inclusive and heartfelt appreciation that really make these programmes and practices impactful.
All organizations have put in place some practices to create a robust rewards and recognition program. These have become hygiene. These would be aspects like ensuring non- discrimination in rewards through audits and some benefits e.g. hospitalization, health check -ups and domicialliary medical benefits. Monthly, quarterly and annual programs especially focused on recognizing performance, results and loyalty (i.e. tenure) have become common now.
On the other hand the differentiators are:
1. Systems and mindset for internal equity in compensation especially after reaching a particular threshold
2. Wider distribution of rewards across levels and roles
3. Higher payouts for medical benefits
4. Greater differentiation based on performance indicated by the fact that fixed is lower and variable, as well as maximum increment percentages are higher for the Top 15.
5. Stock ownership both as a percentage as well as spread across levels
6. Higher variety, inclusiveness and frequency of recognition
7. Recognition for potential and skills, behaviours apart from results and contribution
8. Grievance redressal channels for employees to ensure strong execution and sense of justice.
Some factors continue to be areas that all organizations could look into. These are aspects that have scattered evidence but could well be leverage areas for employees and organizatons in the time to come. These are family involvement in both recognition as well as benefit programs e.g. inviting family members to recognition events and applauding their role in the achievement of the employee or insurance cover for family members. Medical benefits on retirement is another such area. It is also interesting that while companies are recognizing employees for results and
effort, there is still little recognition for exceeding norms or finding new performance levels. This could very well be what can drive innovation among employees. Personalization of recognition programs is one other area where organizations are not investing a lot of time or energy. In a technology enabled age driven by social media and group think, this could well be a means of touching the emotional chord in people with significant psychological, social and economic benefits.Lastly an ongoing area of focus remains the extent of participation and feedback that an organization takes from across levelsto continuously improve its practices.
In conclusion both the hypotheses are validated and are differentiating practices in reward and recognition i.e,
1. Once a threshold point is reached, internal equity and transparency are more important than the actual quantum of the rewards in enhancing the effectiveness of rewards and recognition (particularly rewards) programmes.
2: Higher frequency, genuine experience of appreciation and greater inclusiveness in recognition programmes makes them more effective.
We hope more and more organizations and their business and HR leaders are inspired to learn from the Best and add to the repertoire of best practices in this all important area, thereby benefiting them and providing more valuable ideas to others.
Conclusion
25
1. Bhattacharya, S., & Mukherjee, P. (2009). Rewards as a Key to Employee Engagement : A Comparative Study on I.T. Professionals.
ASBM Journal of Management, II(1), 160-175.
2. Bhatnagar, J. (2007). Talent management strategy of employee engagement in Indian ITES employees: Key to retention, Employee
Relations, 29 (2007), pp. 640–663
3. Bonsdorff, M. E. v. (2011). Age-related differences in reward preferences. The International Journal of Human Resource Management,
22(6), 1262-1276.
4. Brun, J.-P., & Dugas, N. (2008). An analysis of employee recognition: Perspectives on human resources practices. The International
Journal of Human Resource Management, 19(4), 716-730.
5. Danish, R. Q., & Usman, A. (2010). Impact f Reward and Recognition on Job Satisfaction and Motivation: An Empirical Study from
Pakistan. International Journal of Business and Management, 5(2), 159-167.
6. Darling, K., Arn, J., & Gatlin, R. (1997). How to Effectively Reward Employees. Industrial Management. USA.
7. Flynn, G. (1998). Is your recognition program understood? Workforce, 77(7), 30-35.
8. Hart, P. (2011). Benefits of Employee Recognition in the Workplace: Reduced Risk & Raised Revenues. EHSToday, 49-52.
9. Henagan, S. C. (2010). The Perils of Workplae Recognition: Antecedents to Discomfort Associated with Being the Target of Upward
Comparisons. Basic and Applied Social Psychology(32), 57-68.
10. Holland, K. (2008, February 24). Working all corners in a global talent hunt. The New York Times.www.nytimes.com
11. Inc, B. o. N. A. (2012). What Reward, Recognition Program Awards Are the Most Valuable? HRfocus.
12. India Inc may see attrition rates as high as 31%. (2012). Business Standard. Retrieved from http://www.business-standard.com/
article/companies/india-inc-may-see-attrition-rates-as-high-as-31-112050100097_1.html website:
13. Jr., W. G. T., Stumpfb, S. A., & Dohc, J. P. (2010). Exploring talent management in India: The neglected role of intrinsic rewards.
Journal of World Business, 45(2), 109-121.
14. Kular, S., Gatenby, M., Rees, C., Soane, E., & Truss, K. (2008). Employee Engagement: A Literature Review. Kingston University:
Kingston University.
15. Luss, R., & Nyce, S. (2008). Secrets of Top Performers: How Companies with Highly Effective Employee Communication Differentiate
Themselves - the Methodlogy behind the 2007/2008 Communication ROI Study Communication ROI Studies: Watson Wyatt
Worldwide.
16. Maslach, C., Schaufelli, W.B. and Leiter, M.P. (2001), “Job burnout”, Annual Review of Psychology, Vol. 52, pp. 397-422.
17. Monis, H., & Sreedhara, D. T. N. (2011). Employee perceptions of reward & recognition policy: A comparative study of Indian and
Foreign MNC BPO firms. JM International Journal of Management Research, 1(2), 122-130.
18. Mundhra, W. C. D. D. (2010). Intrinsic Motivational Canvass in the Indian Service Sector: An Empirical Study. VISION - The Journal
of Business Perspective, 14(4), 275-284.
19. Nurmi, S. (2012). Rewards for Motivating Employees. (Master’s in International Business), University of Turku, Turku.
20. Ostrow, P. (2011). Sales performance management 2012: Rewards and Recognition as a vital compensation component
21. Roberts, R. L. (2005). The relationship between rewards, recognition and motivation at an insurance company in the western cape.
(Magister Commerci), University of Western Cape.
22. Saks, A. M. (2006). Antecedents and consequences of employee engagement. Journal of Managerial Psychology, 21(7), 600-619.
23. Shore, T. H., & Strauss, J. (2012). Effects of Pay and Productivity Comparisons in the Workplace on Employee Attitudes: An
Experimental Investigation. International Journal of Management, 29(2), 677-686.
References
26
APPENDIX 1: CULTURE AUDIT © PRACTICES
1. HIRING Focus is on hiring for potential and character of the person, rather than
primarily on skill set. New employees are welcomed and assimilated into the team with orientation programs, personal sponsorships, and the like.
2. INSPIRING Employees learn and understand how their job has meaning for the
organization and for society, beyond earning a salary and making a profit for the business.
3. SPEAKING Management goes to great lengths to be open and transparent,
offering access to information across the board, enabling and encouraging employees to contribute beyond the scope of a narrowly defined job.
4. LISTENING Special open systems for incorporating peoples’ ideas, for including
people in decision-making, and enabling them to air their concerns and grievances.
5. THANKING Recognizes and rewards good work and extra levels of effort; strives
to create a climate of approval and reinforcement. 6. DEVELOPING Focus is on nurturing individuals’ gifts to foster personal growth and
development as well as offering job-specific training. 7. CARING A multiplicity of systems and programs are put in place for creating a
caring environment for the individual and his/her family. 8. CELEBRATING Celebrations of both personal milestones and company successes
are built into the way people work together. 9. SHARING Employees share in the fruits of their labour in a variety of ways;
rewards are equitable and egalitarian in nature.
DATA SELECTION
The employee response discussed in Step 5 above represents employees’ perception of their workplace. Although all 62 statements were used to gather data for this overall analysis, 10 statements that relate directly to an organization’s reward and recognition practices and their effects on employee perception have been used for R&R Award.
Rather than combine statements from the Trust Index© that relate to both
rewards and recognition, this time around, statements that pertain to rewards were treated as a separate category from those statements that pertain to recognition in organizations. As mentioned earlier employees’ responses are measured on the ‘truth’ scale (veracity cum frequency scale) rather than the ‘agreement/disagreement’ scale. The two sections below specify the statements used for subject and the rationale behind this measure.
Employee responses from each participating organization were sampled and the feedback on the question mentioned above was considered. Employees were asked to rate their organization using these statements on a 5 point scale – with 1 being the lowest (that is, whatever is mentioned in the statement is almost always untrue) and 5 the highest measurement of positive perception (that is, whatever is mentioned in the statement is almost always true) in relation to each statement. 25,930 employees were surveyed for the purpose of this study. The data collated and analysed will reflect the perception of employees based on this sample.
The Great Place to Work® Model measures or rates an organization using two lenses. The first, measures employees’ perception on their workplaces using scores for the statements mentioned above and comments of employees in their own words about what is special and unique about their workplace which makes it a great workplace or what needs to be changed or improved to make their workplace a better workplace. The second aspect measures/assesses and scores the people practices implemented in an organization - by management/human resources function, which are captured in the Culture Audit Documents.
As has been mentioned earlier, organizations who participated for R&R Awards were asked to answer questions related to the rewards and recognition initiatives that have been implemented in their organization. These responses were also studied and evaluated. Scores of relevant employee responses as well as scores of people practices (R&R) have been used to rank the winners for India’s Best Companies for Rewards & Recognition, 2013. A copy of this questionnaire can be seen in Appendix 2.
SELECTION OF THE TOP 15 IN REWARDS AND RECOGNITION
Although both forms of data (the Trust Index© Questionnaire and the practice questions- Culture Audit©) were used to consider organizations - each section had different weightage. Employee perception (an equally weighted combination of statement scores for both rewards and recognition) was assigned 2/3rd weight of the overall score. The remaining 1/3rd weight was assigned to the score of R&R practices. The following
References Appendices
REWARDS
STATEMENT Weightage out of 100.
People here are paid fairly for the work they do. 20
We have special and unique benefits here. 20
Managers avoid playing favourites. 15
I feel I receive a fair share of the profits made by this organization. 15
Promotions go to those who best deserve them. 15
Performance of employees here is fairly evaluated. 15
27
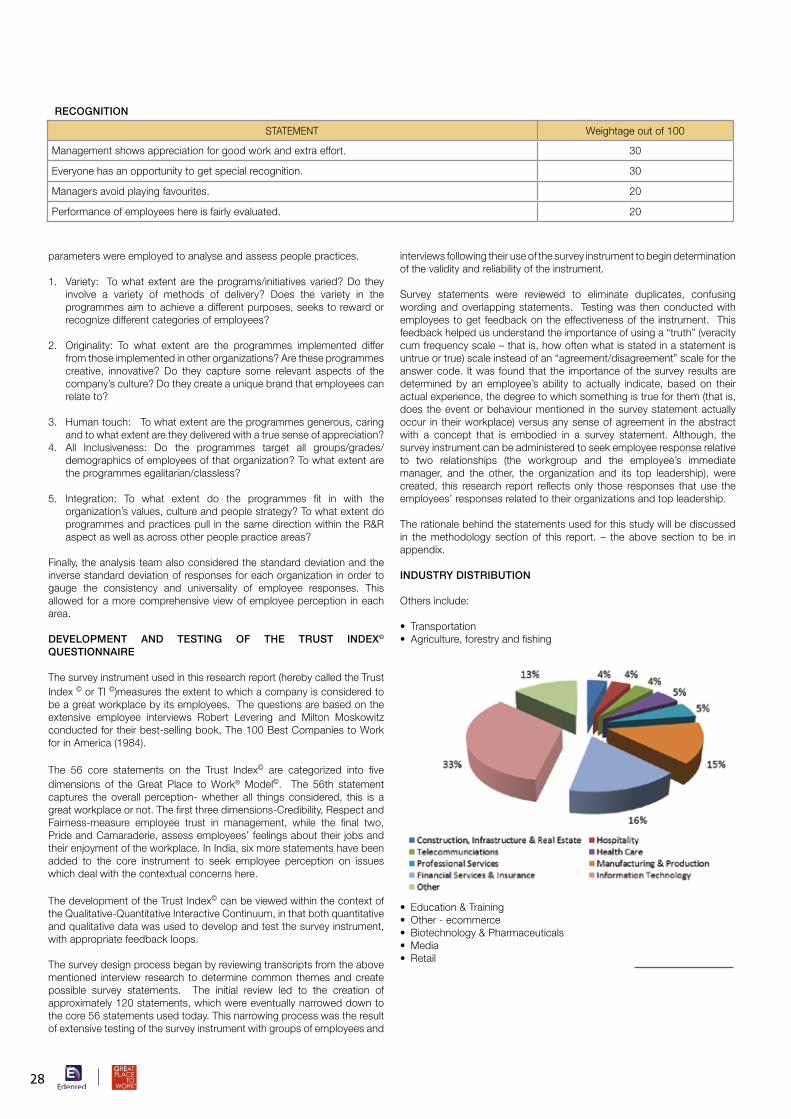
parameters were employed to analyse and assess people practices.
1. Variety: To what extent are the programs/initiatives varied? Do they involve a variety of methods of delivery? Does the variety in the programmes aim to achieve a different purposes, seeks to reward or recognize different categories of employees?
2. Originality: To what extent are the programmes implemented differ from those implemented in other organizations? Are these programmes creative, innovative? Do they capture some relevant aspects of the company’s culture? Do they create a unique brand that employees can relate to?
3. Human touch: To what extent are the programmes generous, caring and to what extent are they delivered with a true sense of appreciation?
4. All Inclusiveness: Do the programmes target all groups/grades/demographics of employees of that organization? To what extent are the programmes egalitarian/classless?
5. Integration: To what extent do the programmes fit in with the organization’s values, culture and people strategy? To what extent do programmes and practices pull in the same direction within the R&R aspect as well as across other people practice areas?
Finally, the analysis team also considered the standard deviation and the inverse standard deviation of responses for each organization in order to gauge the consistency and universality of employee responses. This allowed for a more comprehensive view of employee perception in each area.
DEVELOPMENT AND TESTING OF THE TRUST INDEX©
QUESTIONNAIRE
The survey instrument used in this research report (hereby called the Trust Index © or TI ©)measures the extent to which a company is considered to be a great workplace by its employees. The questions are based on the extensive employee interviews Robert Levering and Milton Moskowitz conducted for their best-selling book, The 100 Best Companies to Work for in America (1984).
The 56 core statements on the Trust Index© are categorized into five dimensions of the Great Place to Work® Model©. The 56th statement captures the overall perception- whether all things considered, this is a great workplace or not. The first three dimensions-Credibility, Respect and Fairness-measure employee trust in management, while the final two, Pride and Camaraderie, assess employees’ feelings about their jobs and their enjoyment of the workplace. In India, six more statements have been added to the core instrument to seek employee perception on issues which deal with the contextual concerns here.
The development of the Trust Index© can be viewed within the context of the Qualitative-Quantitative Interactive Continuum, in that both quantitative and qualitative data was used to develop and test the survey instrument, with appropriate feedback loops.
The survey design process began by reviewing transcripts from the above mentioned interview research to determine common themes and create possible survey statements. The initial review led to the creation of approximately 120 statements, which were eventually narrowed down to the core 56 statements used today. This narrowing process was the result of extensive testing of the survey instrument with groups of employees and
interviews following their use of the survey instrument to begin determination of the validity and reliability of the instrument.
Survey statements were reviewed to eliminate duplicates, confusing wording and overlapping statements. Testing was then conducted with employees to get feedback on the effectiveness of the instrument. This feedback helped us understand the importance of using a “truth” (veracity cum frequency scale – that is, how often what is stated in a statement is untrue or true) scale instead of an “agreement/disagreement” scale for the answer code. It was found that the importance of the survey results are determined by an employee’s ability to actually indicate, based on their actual experience, the degree to which something is true for them (that is, does the event or behaviour mentioned in the survey statement actually occur in their workplace) versus any sense of agreement in the abstract with a concept that is embodied in a survey statement. Although, the survey instrument can be administered to seek employee response relative to two relationships (the workgroup and the employee’s immediate manager, and the other, the organization and its top leadership), were created, this research report reflects only those responses that use the employees’ responses related to their organizations and top leadership.
The rationale behind the statements used for this study will be discussed in the methodology section of this report. – the above section to be in appendix.
INDUSTRY DISTRIBUTION
Others include:
• Transportation• Agriculture, forestry and fishing
• Education & Training• Other - ecommerce• Biotechnology & Pharmaceuticals• Media• Retail
RECOGNITION
STATEMENT Weightage out of 100
Management shows appreciation for good work and extra effort. 30
Everyone has an opportunity to get special recognition. 30
Managers avoid playing favourites. 20
Performance of employees here is fairly evaluated. 20
28

Edenred (India) Private Limited2nd Floor, Camera House, Majiwade Village Road, Majiwade,Thane (W), Thane - 400 601Ph: +91 (22) 2545 5500 www.edenred.co.in
Great Place to Work® Institute, IndiaUnit no. 301, 302, 303Apple Plaza, S. B. Marg, Dadar (West), Mumbai- 400028 Ph: +91 (22) 6610 5544www.greatplacetowork.in