Embed Size (px)
Citation preview

#WFwebinar Sponsored by
The presentation will begin at the top of the hour.
A dial in number will not be provided.
Listen to today’s webinar using your computer’s speakers or headphones.
Welcome to the webinar!

#WFwebinar Sponsored by
Speakers: Stacey Harris Vice President of Research and Analysis Sierra-Cedar
Erin Spencer Research Consultant Sierra-Cedar
Moderator: Kellye Whitney
Associate Editorial Director Workforce magazine
Exploring the Top 10 Trends in HR Technology

#WFwebinar Sponsored by
Tools You Can Use Audio Control
– A dial in number will not be provided.
– Adjust the volume by sliding the indicator in the Media Player box to the right.
– Also check your computer’s volume for external speakers or headsets.

#WFwebinar Sponsored by
Tools You Can Use
Speaker Bios
Resources
Media Player
Q&A
Slides
Help
Post Event Evaluation Share This
Group Chat
HRCI
CLO Webinars

#WFwebinar Sponsored by
Tools You Can Use Q&A and Live Group Chat
– Enter your first name and initial and join the live discussion with other webinar attendees
– Enter technical or content-related questions into the Q&A box
– Type your question in the space at the bottom.
– Click “Submit.”
Q&A
Group Chat

#WFwebinar Sponsored by
Tools You Can Use
Twitter - Click “Post” in the Twitter widget.
#WFwebinar @WorkforceNews

#WFwebinar Sponsored by
1. May I receive a copy of the slides? YES! Click on the resource list located on the top left
portion of your screen.
2. May I review the webinar recording at a later date? YES! You may log in again using today’s link to review the
presentation on-demand.
3. Is this webinar HRCI and SHRM certified? YES! The HRCI and SHRM certification codes will appear
in the box to the right of the slides after the required watch-time has elapsed.
Frequently Asked Ques6ons

#WFwebinar Sponsored by
Kellye Whitney Associate Editorial Director Workforce magazine
Exploring the Top 10 Trends in HR Technology

#WFwebinar Sponsored by
Stacey Harris Vice President of Research and Analysis Sierra-‐Cedar
Exploring the Top 10 Trends in HR Technology
Erin Spencer Research Consultant Sierra-‐Cedar

Exploring the Top 10 Trends in HR Technology
Presenters:
Stacey Harris – Vice President, Research and Analytics @StaceyHarrisHR
Erin Spencer – Research Consultant

11
900 +
Employees
2014 merger of
4 companies with decades of experience
7
Service & Solution Areas Application Services Business Intelligence
Host & Managed Services Infrastructure Services
Integration & Cloud Solutions Research Strategy Training
Delivering industry-focused client success by providing consulting, technical, and managed services for the deployment, management and
optimization of next-generation applications and technology.
5
Industry Focus Commercial Healthcare
Higher Education Public Sector
Justice & Public Safety
Sierra-Cedar Fast Facts
17
Years of Leading HR Systems Survey &
Research

12
Sierra-Cedar HR Systems Survey Over 17 years of continuous data gathering
The most comprehensive survey in the industry: ● Strategy, Process, and Structure ● Administrative and Service Delivery Applications ● Workforce Management Applications ● Talent Management Applications ● Business Intelligence/Analytics/Workforce
Planning Applications ● Integration and Implementation ● Emerging Technologies and Innovations ● Vendor Landscape ● Workforce and HR Expenditures ● Workforce Usage and Perception
BE COUNTED! www.Sierra-Cedar.com/survey-sh

13
Sierra-Cedar 2014–2015 HR Systems Survey Demographics: All Respondents
Organizations 1,063 Large
10,000 + Medium 2,500– 10,000 Small
Under 2,500
Organization Sizes Represented
28%
29% 43%
Total Workforce Represented
Employees + Contingent (in millions)
19 Million
Avg. number of Employees = 16,053
20.5%
Other Services
14.9%
Healthcare
14.9%
Financial Services
12.5%
Higher Ed./ Public Admin.
12.1%
Manufacturing
7.9%
Trans., Comm. Utilities
7.3%
Retail Wholesale
6.8%
High-tech Agriculture/ Mining/
Construction
3%

14
Key Themes for 2014–2015 Survey Results Foundation Strategy and Culture Innovation
Cloud HRMS
User Experience Enterprise
Integration Strategy
Culture of Change
HR Tech Strategy Social
Mobile
Quantified Organization WFM + TM + BI

15
#1 – HR Technology Strategy
Strategy and Culture HR Tech Strategy
More companies are creating an Enterprise HR Technology Strategy than
ever before!

16
An Enterprise HR Systems Strategy Our Top Performers Have One. Do You Have One?
36%
35%
8%
21%
Percentage of Organizations With a Current Enterprise HR Systems Strategy
Regularly updated strategy
In development strategy
Rarely updated strategy
No strategy/Not aware
HR organizations with an Enterprise HR Systems Strategy are 38% more likely to be viewed by all levels of management as contributing strategic value to the organization.

17
Creating Your HR Systems Strategy
1. Benchmark – Current State & Benchmark of HR Technology Environment
2. Blueprint – Enterprise Business Goals and HR Strategies, Enterprise System Strategies
3. Roadmap – Action Plan, Communication Strategy, Measures and KPIs
Diagnosis – Guiding Policy – Coherent Action

18
Sierra-Cedar HCM Application Blueprint
Backlog, Pipeline, Customer Satisfaction
General Ledger, Purchasing, Budgeting, T&E Vendor Management
Project Costing, Contracts, Grants Projects
FIN
CRM
VMS
Talent Management Excellence
Service Delivery Excellence Administrative Excellence
Workforce Management Excellence
Workforce Optimization Excellence
SOA, API, ETL
Enterprise Content Enterprise Workflow
Network Security
Enterprise Social
Mobile Access Integration Platform
Workforce Optimization Workforce Planning, Workforce Analytics, Predictive Analytics
Service Delivery HR Help Desk, Portal, Workforce
Lifecycle Management (Onboarding)
Self Service/Direct Access Employee Self Service Manager Self Service
Workforce Management Time & Labor, Absence & Leave
Management, Labor Scheduling, Labor Budgeting, WFM Analytics, Social
Talent Management Recruiting, Performance, Learning, Compensation, Succession, Career, Talent Profile, Talent Analytics, Social
Business Intelligence Foundation Reporting/visualization and BI tools
Administrative Apps Core HRMS, Roles/Competencies (Profile Mgt.), Payroll,
Benefit Admin, Embedded HR Analytics, Embedded HR Social

19
2014–2015 Three-year Adoption Outlook Looking Forward, Workforce Optimization Will Be Hot!
92%
49%
46%
55%
41%
41%
12%
96%
76%
65%
80%
68%
65%
44%
Administrative
Service delivery
Workforce management
Talent management
Social media tools
BI (reporting and tools)
Workforce optimization
Three-year Application Outlook
In Use Today
In Use within 3 Years
268%
n=648
55%

20
#2 – Enterprise Integration Strategy
Strategy and Culture Enterprise
Integration Strategy
High performing organizations are more likely to have an
Enterprise Integration Strategy!

21
HR System Integration Approaches Early Indication that Enterprise Integration Strategy (EIS) is Valuable
17%
22%
13% 15%
33%
Primary Approach for HR Application Integration
Integrate into HRMS
Integrate into ITM
Enterprise integration strategy/platform
Case by case integration
No approach/not aware
Respondents with an Enterprise Integration Strategy Are Using
• 45%: on-premise solution (Oracle SOA, WebSphere) • 23%: platform as a service solution (PasS – Dell Boomi, MuleSoft, Informatica) • 20%: hybrid solutions • 12%: not aware
n=494

22
#3 – Culture of Change Management
Strategy and Culture Culture of Change
Organizations with a culture of change management have less overall HR Technology costs
per employee!

23
Change Management Practices 27% of Respondents Report a Culture of Change Management
27%
34%
22%
17%
Level of Change Management for HR Technology Projects
Consistent culture of change mangement Key projects that meet criteria Sporadically, with no criteria Never
15%
23%
27%
43%
59%
72%
100%
Incentives
Readiness assessment
Formal CM: Six Sigma etc.
Champions
Usability testing
BPI
Basics*
Change Management Practices for HR Technology Projects
*Basics: Senior sponsorship, communications, documentation, training, and project management.

24
Benefits of Change Management Reduces Costs and Increases Perception of HR as Strategic
57%
2 X Organizations with a Culture of Change Management are twice as likely to be viewed by all levels of management as contributing strategic value, versus at organizations that never uses change management.
Change Management Increases Strategic Value of HR
$691
$461
$344
$302
Never
Sporadic
Key projects
Culture of CM
Total HR Technology Costs/Employee

25
#4 – Moving to the Cloud
Organizations are moving to the Cloud!
Foundation
Cloud HRMS

26
46%
13%
28%
10%
3%
2%
31%
9%
47%
11%
1%
1%
Licensed software – on premise
Licensed software – hosted
SaaS – subscription-based
Combinations
In-house developed/bespoke
Outsourced (process and software)
HRMS Application Deployment Only
Today
12 Months
2014–2015 HRMS Deployment Models SaaS HRMS Deployments Will Overtake Licensed Next Year
n=602

27
2014–2015 HRMS Deployment Models Large Organizations* Will Double Their SaaS HRMS Adoption Next Year
15%
25%
40%
31%
46%
59%
HRMS SaaS Application Deployment Only by Employer Size*
Today 12 Months
Medium
Small
Large
106%
*Large = 10,000+; Medium = 2,500–10,000; Small = <2,500
n=602

28
HRMS Vendor Landscape 12 Months Plans Indicate Greater SaaS Adoption
HRMS Respondent Adoption Overall*
* SAP adoption underrepresented ** Columns do not add to 100% as organizations have multiple solutions in use Colored cells indicate greater than 5% gain in 12 months.
Overall Today In 12 Months
Oracle PeopleSoft 27% 24% ADP 20% 16% Kronos 11% 9% Ultimate Software (UltiPro) 11% 11% SAP* 9% 8% Infor/Lawson 9% 8% Workday 6% 15% Oracle EBS/JD Edwards 7% 7% Ceridian HR 5% 3% SumTotal/Softscape/Accero 4% 4% SuccessFactors EmployeeCentral 3% 6% Oracle Fusion (HCM Cloud) 2% 4% Ceridian Dayforce HCM 2% 3% Other 13% 13%
n=497
Oracle Today: 36%
12 Mths: 35%
SAP Today: 12%
12 Mths: 14%

29
#5 – User Experience Is Important
Foundation
User Experience drives move to new technologies!
User Experience

30
#1 Reason For Moving is User Experience! How Are Vendors Doing?
1 = Poor: not user friendly, excessive steps, limits use 2 = Acceptable: workable but requires training to use 3 = Excellent: intuitive, user centered design, effectively promotes use
And, why is it is such a big deal?
It’s about driving user adoption, so both employees and the organization
get the most value from the solution!

31
User Adoption Level by User Experience Scores Higher User Experience Scores with Newer Cloud Solutions
HR Management System Manager User Adoption and User Experience
30
35
40
45
50
55
60
65
70
75
1.60 1.85 2.10 2.35 2.60
Use
r Ado
ptio
n Pe
rcen
tage
UltiPro
Kronos
Infor/Law PSFT * Ceridian DF
User Experience Scores
Oracle, EBS
* Sample Size Small, Indicative Data Only
SAP (HCM)
Ceridian HR
Multiple Vendors
n=389
UltiPro: Manager adoption, increased by 47%
from last year.
Organizations with new cloud solutions
will see increased adoption levels
quickly. * Oracle HCM Cloud (Fusion)
Workday
* SF/Employee Central
ADP UltiPro (2013)

32
Low Industry Net Promoter Scores Actions to Take from HRMS Scores
● Plan for faster implementations, upgrades, or release deployments Don’t try and boil the ocean. Piloting and phased rollouts can help reduce project time. Complete process re-engineering before technology work, not during.
● If your organization is on an older release, consider changing! Those on older releases are the most unsatisfied by 40 points lower than the average. Those on newest releases are 8–20 points higher than the average.
● Customize as a last resort! Those with high levels of customization (over 25%) are 20 points lower than those with moderate and low customization, and 50% lower than those with no customization. Those with no or low customization give the highest scores, 62 points higher than those with high levels of customization.
● Develop an enterprise integration strategy Those with an Enterprise Integration Strategy and Platform have scores 10 points higher than the average, and 14 points higher than those that integrate on a case by case basis.
33
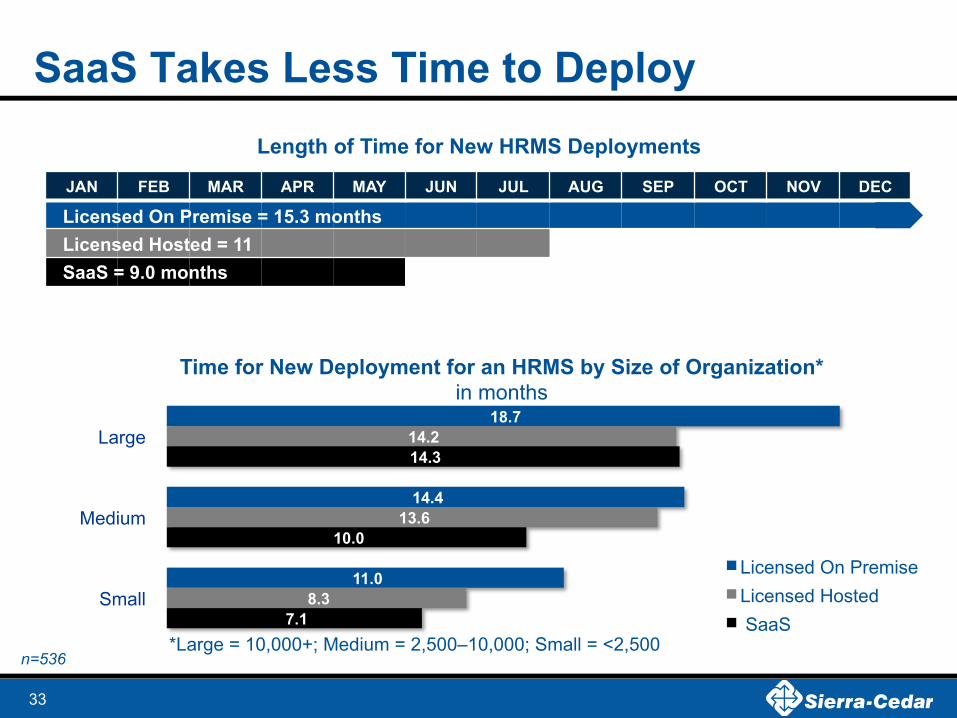
SaaS Takes Less Time to Deploy
Length of Time for New HRMS Deployments
JAN FEB MAR APR MAY JUN JUL AUG SEP OCT NOV DEC
Licensed On Premise = 15.3 months Licensed Hosted = 11 SaaS = 9.0 months
18.7
14.4
11.0
14.2
13.6
8.3
14.3
10.0
7.1
Large
Medium
Small
Time for New Deployment for an HRMS by Size of Organization* in months
Licensed On Premise Licensed Hosted SaaS
n=536 *Large = 10,000+; Medium = 2,500–10,000; Small = <2,500

34
SaaS Takes Less Resources Requires Fewer Total HR Technology Headcount than Licensed Solutions
Licensed on premise SaaS
5.0
4.0 4.9
3.0 4.3
2.8
Hea
dcou
nt
Functional HRMS Application Support HRMS Infrastructure
*All Licensed on premise and SaaS respondents from organizations with average of ~11,000 employees plus contingents served by the HRMS
n=85
HRIT/IT Headcount by Deployment Type*
SaaS advantage holds true across small, medium, and large organizations. It is best to benchmark for your size and industry.

35
#6 – Leveraging Full HR Technology Suites
Foundation
Organizations that leverage full WFM, TM, and BI suites
have better outcomes!
Workforce Management, Talent Management, and Business
Intelligence

36
67%
63%
62%
64%
69%
78%
86%
44%
45%
50%
59%
60%
63%
84%
Succession
Career
Learning
Compensation
Acquisition
Talent Profile
Performance
Integrated Talent Management Components
Today 12 Months
Integrated Talent Management All ITM Components Will See Growth
Approach to Integrated Talent Management
Approach
Organizations with higher than average TM components (4) have 6% higher ROE.
ITM Suite 34%
HRMS-ITM suite
49%
Point Solutions
17%

37
Workforce Management Applications Current Adoption
Absence Management Request Off, Missed Work,
Leave Management Leave requests, Case
management, Compliance
Workforce/Labor Scheduling
Schedule, Resource analysis,
Workforce/Labor Budgeting
Labor analysis, Forecasting,
Time & Attendance (Labor)
Time tracking, Activity tracking,
22% Adoption
32% Adoption
80% Adoption
44% Adoption
55% Adoption
15%
40% 13%
13%
19%
Please characterize the primary approach to selecting workforce management
applications?
WFM Suite
HRMS Suite
ITM Suite
Point Solutions
No Strategy
* WFM Suite – Not part of the HRMS or ITM Suite n=580

38
BI/Analytics Deployment Approaches Adoption is Less Important than Deployment. We Must Learn from the Past!
8%
13%
33%
47%
7%
9%
30%
53%
Standalone HR Analytics Tool
Combination Solutions
Embedded HR
Enterprise BI
Business Intelligence/HR Analytics Approach
Today 12 Months
Predominantly Standalone Apps 2007
2012 With experience,
organizations moved to adopt
Enterprise Solutions
2014 Currently, an
emerging trend of Embedded HR Analytics
Going forward, we will see 44% growth in adoption of
Combinations
12 Mo
Caution: consider past learning as you develop your BI/analytics strategy. While embedded analytics solutions that provide transactional and operational analytics
will not go away, they are not the end solution. Enterprise solutions will be needed.
n=488

39
Top Adopters of WFM, TM, and BI Achieve Higher Outcome Scores and Higher ROE
Top Workforce Management, Talent Management, and Business Intelligence Adopters:
• Have across the board higher HR, talent and business outcome scores • Achieve higher Return on Equity (31% higher than lower adopters)
Workforce Management
Talent Management
Business Intelligence
They integrate WFM, TM, and HRMS data three times as often as lower adopters.
40
#7 Social is Settling In….
Innovation
Organizations that leverage Social Technologies
strategically in HR see higher levels of HR tech adoption!
Social

41
Strategies for Social Tools
27%
30%
36%
52%
62%
7%
4%
5%
9%
10%
6%
13%
15%
17%
13%
10%
8%
9%
6%
10%
16%
18%
4%
3%
38%
28%
17%
9%
19%
Enterprise social netowrk (behind firewall)
Collaboration tools/repository
Social Tools Use and Plan
Used strategically today Will be used strategically in next 12 months
Allowed for individual use only Evaluating use
Not allowed Not aware/no plans

42
Social-enabled Process Adoption Recruiting Staff and Hiring Managers Have the Highest Levels of Use
Workforce Using
Major Social-enabled HR Processes Today In 12
Months Administrative – HR management/record keeping 14% 21%
Workforce Management – Time and labor/time and attendance 8% 14%
Talent Management Recruiting 23% 29% Performance management/Goal management 10% 16% Learning and development 14% 22% Compensation 5% 11%
Recruiting (recruiting/talent acquisition staff) 67% 74% Recruiting (hiring managers) 26% 36%
Business Intelligence/Workforce Analytics 8% 13%
Average workforce adoption across all mobile-enabled processes 12% 18%
Last year
Today In 12 Months
9 16
7 10
15 21 10 16 12 19 5 9 5 9
48 55 17 25
4.49 12.76
9 14
n=186

43
#8 – Rapid Growth of Mobile
Innovation
Mobile technology is changing how we deliver HR Technology!
Mobile

44
Mobile-enabled Process Adoption Mobile Adoption Will Grow by Over 100%
Workforce Using
Major Mobile-enabled HR Processes Today In 12
Months Administrative 15% 33%
HR management/record keeping 11% 31% Payroll 19% 35%
Workforce Management 8% 25% Time and labor/time and attendance 7% 24% Leave management 8% 27% Absence management 8% 26% Workforce scheduling/Labor scheduling 7% 23%
Talent Management 20% 37% Recruiting 17% 31% Performance management/Goal management 25% 40% Learning and development 24% 37% Compensation 20% 39% Succession planning/management 13% 32%
Business Intelligence/Workforce Analytics 4% 13%
Average workforce adoption across all mobile-enabled processes 13% 27%
Workforce Using
Today In 12 Months 15.00 33.00 10.85 30.54 19.02 35.3
7.74 24.92 7.33 23.69 8.05 26.58 8.48 26.44 7.08 22.98
20.36 37.14 17.22 31.25 25.04 40 23.68 37.04 19.85 39.05 12.85 32.46
4.49 12.76
12.65 27.34
n=568

45
With Self Service*
and Help Desk
2.2
With Self Service*
2.1
No or Low Tech
1.75
Why Add Mobile to Service Delivery Tech? Higher HRMS User Experience Scores
*With Self Service: Employee and manager self service applications serve 60% or more of employees and 50% or more of manager populations **User experience scores based on a three point scale: 1 = Poor, 2 = Acceptable, 3 = Excellent
49% increase in user experience scores with combined self service, help desk, and mobile technologies.
With Self Service*,
Help Desk, and Mobile
2.6
HRMS User Experience Scores** by Service Delivery Model
n=158

46
#9 - Quantified Organizations
Innovation
Data driven HR organizations see greater financial outcomes!
Quantified Organization

47
Introducing the “Quantified Organization” An Environment of Data-driven Decision Making
Quantified Organization Not Quantified
Better BI Process Maturity BI Process Maturity
3.2 Effective
BI Process Maturity
1.8 Efficient
More Manager Access to Analytics Managers with BI access
74% Managers with BI access
20%
More Data Sources BI Sources
4.8 BI Sources
2.4
More Categories of Metrics Metrics Categories Tracked
4.2 Metrics Categories Tracked
2.8

48
Quantified Organizations Outperform! They Have 79% Higher ROE than Non-QOs
Quantified Organization
79% Higher ROE
Quantified Organization
Not Quantified
Return on equity measures an organization’s success at generating profits from every unit of shareholders equity, such as that allocated for HR technologies. A company that earns an ROE in excess of its cost of equity capital adds value.
ROE
18% ROE
10.1%

49
Lesson from Quantified Organizations

50
#10 – Transparency and Data Management ● People want to be known as Individuals...Employees are people… ● Wearables > “Internet of Things” > Beyond… ● Government regulations, local regulations, and corporate policies are
all increasing. ● Growing importance of cultures, changing families, and peer groups ● Every 3–6 months consumers are accustomed to upgrading
technology

51
Survey Updates: ● Vendor – What drives customers satisfaction and dissatisfaction ● Payroll – Plans and global capabilities ● Talent Management - New questions on Onboarding, Learning, and
Succession Management ● BI/Analytics – New questions on “how” the tools are being used and
what outcomes they are supporting. ● Implementations & Maintenance – New questions on the complexity of
implementations, time and investment in release updates, and resources used for these efforts.
● Emerging Tech – Talent Acquisition ecosystem, Rewards and Recognition, Employee Engagement
Participants Get: Tailored Snapshots � Printed Responses � Full Report

52
Visit the Sierra-Cedar Website Get Full Survey Details and Participate!
www.Sierra-Cedar.com/annual-survey

53
Stacey Harris Vice President Research and Analytics
Background: ● Currently oversee the Annual HR Systems Survey and Research for Sierra-Cedar ● HR and OE Practitioner for over 10 years in finance, retail, and franchised businesses. ● Past Direct of Research Bersin & Associates, Launched the HR research practice ● Past VP of Research for Brandon Hall Group ● Major Research and Papers: 17th Annual HR Systems Survey White Paper, The High
Impact HR Organization, The HR Framework, Employee Engagement: A Changing Marketplace, and Relationship Centered Learning
● Feel free to connect at: www.linkedin.com/in/staceyharris/ & @StaceyHarrisHR
Passions:
Research

54
Erin Spencer Research Consultant
Background: ● Research and Analysis at Brandon Hall Group ● Learning Administration at ACS Learning Services ● LMS selection and administration, and training at MRINetwork ● Feel free to connect at:
https://www.linkedin.com/pub/erin-spencer/6/734/388

#WFwebinar Sponsored by
Please complete the webinar evaluation.

#WFwebinar Sponsored by
Join our next Webinar! Cracking the Code to High-
Potentials: A Simple Formula on How to Engage and Retain Your
Best
Thursday, July 16, 2015
Webinars start at 2 p.m. Eastern / 11 a.m. Pacific
Register for all upcoming Workforce Webinars at www.workforce.com/webinars
OR click the icon on the widget bar!