Embed Size (px)
Citation preview

The$Home$Sales$Real$Estate$Report$$The$Woodlands$|$February$2nd,$2015$Lis@ng$Inventory$Month$By$Month$Home$Sales$Month$By$Month$$Average$Sold$Price$/$Median$Sold$Price$–$Month$By$Month$Average$Price$Per$Square$Foot$–$Month$By$Month$Average$Days$On$Market$–$Month$By$Month$Months$Supply$of$For$Sale$Inventory$–$Month$By$Month$$$$
9000 Forest Crossing Drive | The Woodlands TX 77381 | 281-367-3531
281-367-3531

The Woodlands Texas Real Estate ReportListing Inventory - Month to Month By Year
Jan Feb Mar Apr May Jun Jul Aug Sep Oct Nov Dec2015 591 6302014 355 366 373 445 497 556 617 682 669 680 652 645
Better Homes And Gardens Real Estate Gary Greene - 9000 Forest Crossing, The Woodlands Texas / 281-367-3531Data obtained from the Houston Association of Realtors Multiple Listing Service - Single Family/TheWoodlands TX
2015 Listing Inventory 2014 Listing Inventory

The Woodlands Texas Real Estate ReportProperties Placed Under Contract - Month to Month
Jan Feb Mar Apr May Jun Jul Aug Sep Oct Nov Dec2015 1702014 195 203 277 314 300 297 218 233 155 197 147 1662013 182 257 290 327 364 304 270 228 177 212 138 149
Better Homes And Gardens Real Estate Gary Greene - 9000 Forest Crossing, The Woodlands Texas / 281-367-3531Data obtained from the Houston Association of Realtors Multiple Listing Service - Single Family/TheWoodlands TX
2013 Contrats Written 2014 Contracts Written 2015 Contracts Written

KEY INFORMATION
2 Years (Monthly) 01/01/13 - 01/31/15
Market Dynamics BHGRE Gary GreeneSold Average vs. Median Price
Monthly % Total % Change
22.570.89
Monthly Change
2,783.28Median
Total ChangeAverage 3,471.15 83,307.53 21.34
66,798.700.94
Sublocations:All
Bathrooms:Single-Family: (Free Standing) Sq Ft:
HAR AllAll AllAllAll Lot Size:Bedrooms:Property Types:
107
2 Years (Monthly) Construction Type:Price:Period:MLS:
02/01/15BrokerMetrics®Information not guaranteed. © 2015 - 2016 Terradatum and its suppliers and licensors (http://www.terradatum.com/metrics/licensors).
© 2015 - 2016 Houston Association of Realtors Certain information contained herein is derived from information which is the licensed property of, and copyrighted by, Houston Association of Realtors
1 of 2

BHGRE Gary Greene
2 Years (Monthly) 01/01/13 - 01/31/15
Market DynamicsSold Average vs. Median Price
Time Period # Properties Sold Sold Average $ Sold Median $ Sold Avg DOMAverage $ - Median $ Median $ as % of Average $114Jan-15 537,178 69.5373,500 163,678 54206Dec-14 447,766 80.2359,250 88,516 55125Nov-14 512,367 68.9353,000 159,367 47162Oct-14 406,457 83.6340,000 66,457 42183Sep-14 411,123 82.5339,000 72,123 36222Aug-14 448,126 77.0345,000 103,126 36297Jul-14 415,437 84.0349,000 66,437 28267Jun-14 456,775 79.9365,000 91,775 27263May-14 472,504 77.6366,500 106,004 32227Apr-14 439,875 73.9325,000 114,875 34199Mar-14 441,630 73.4324,000 117,630 38140Feb-14 447,188 73.1326,750 120,438 43122Jan-14 427,332 71.4305,000 122,332 47170Dec-13 420,911 84.9357,250 63,661 43175Nov-13 416,427 75.2313,000 103,427 47166Oct-13 461,889 69.0318,750 143,139 35186Sep-13 399,372 77.1308,000 91,372 32272Aug-13 411,739 75.3309,900 101,839 28307Jul-13 450,723 75.6340,990 109,733 27318Jun-13 421,902 78.2330,000 91,902 28298May-13 422,955 72.1305,000 117,955 32224Apr-13 399,516 76.2304,250 95,266 38207Mar-13 381,463 77.5295,500 85,963 45164Feb-13 359,287 75.4271,000 88,287 54129Jan-13 390,147 78.4306,000 84,147 64
© 2015 - 2016 Houston Association of Realtors Certain information contained herein is derived from information which is the licensed property of, and copyrighted by, Houston Association of Realtors
2 02/01/152 ofBrokerMetrics®Information not guaranteed. © 2015 - 2016 Terradatum and its suppliers and licensors (http://www.terradatum.com/metrics/licensors).

Market DynamicsAverage $/SQFT (Sold)
2 Years (Monthly) 01/01/13 - 01/31/15
BHGRE Gary Greene
Price:
0.92
AllAll All
28.36
Property Types:HAR
Sold $/SQFT
MLS: AllBathrooms:
1.18
All Construction Type:
Total Change
Sq Ft:
Monthly Change
2 Years (Monthly)
Sublocations:
All
21.99
Lot Size:Period:
Monthly %
Bedrooms:
KEY INFORMATION
Total % Change
Single-Family: (Free Standing)107
02/01/15BrokerMetrics®Information not guaranteed. © 2015 - 2016 Terradatum and its suppliers and licensors (http://www.terradatum.com/metrics/licensors).
© 2015 - 2016 Houston Association of Realtors Certain information contained herein is derived from information which is the licensed property of, and copyrighted by, Houston Association of Realtors
1 of 2

Average $/SQFT (Sold)2 Years (Monthly) 01/01/13 - 01/31/15
Market Dynamics BHGRE Gary Greene
#
FOR SALE
SQFTPeriod$/Avg
SQFTTime
Avg $
UNDER CONTRACT
# Avg $Avg
SQFT$/
SQFT
SOLD EXPIRED NEW LISTINGS
# # #Avg $ Avg $ Avg $Avg
SQFT$/
SQFTAvg
SQFT$/
SQFTAvg
SQFT$/
SQFT
204Jan-15 913 3,685751,088 173 458,665 3,025 152 114 116 297537,178 590,604 593,2943,167 170 3,380 175 3,322 179201Dec-14 896 3,660736,603 147 528,107 3,142 168 206 133 174447,766 547,586 614,5012,974 151 3,305 166 3,314 185196Nov-14 951 3,616708,449 142 457,847 2,953 155 125 87 209512,367 639,628 558,3263,183 161 3,641 175 3,179 175191Oct-14 1,019 3,553679,070 180 444,931 2,916 153 162 97 243406,457 565,367 511,8342,833 143 3,316 170 3,114 164191Sep-14 1,014 3,555677,683 135 455,908 2,913 157 183 103 253411,123 563,356 494,7662,882 143 3,369 168 3,067 161190Aug-14 1,077 3,542670,955 216 440,861 2,924 151 222 100 306448,126 653,978 481,1172,972 151 3,550 184 3,060 157189Jul-14 1,046 3,519666,513 195 409,955 2,809 146 297 80 368415,437 522,936 479,6572,897 144 3,186 164 3,064 157190Jun-14 1,027 3,549675,627 271 454,019 2,999 152 267 78 371456,775 643,217 505,3933,034 150 3,578 180 3,152 160192May-14 969 3,552682,697 255 447,185 2,940 152 263 58 403472,504 709,196 552,2843,065 154 3,720 191 3,212 172192Apr-14 878 3,591690,004 273 487,420 3,085 158 227 39 376439,875 866,534 529,2562,993 147 4,192 207 3,219 165192Mar-14 819 3,593691,097 257 451,375 3,014 149 199 60 364441,630 719,689 490,0183,049 145 3,745 192 3,083 159201Feb-14 677 3,727749,015 181 520,010 3,131 166 140 41 239447,188 617,564 535,4943,011 149 3,313 186 3,223 165201Jan-14 663 3,741752,559 177 447,411 3,050 147 122 48 230427,332 846,972 638,7202,991 143 3,917 216 3,439 186196Dec-13 619 3,711728,217 119 421,282 2,981 141 170 67 144420,911 725,263 510,3993,008 139 3,786 192 3,159 162198Nov-13 648 3,713734,164 134 427,319 2,991 141 175 39 163416,427 1,056,635 537,4083,046 137 4,157 254 3,115 173188Oct-13 735 3,646684,277 190 442,090 3,063 144 166 60 209461,889 513,423 515,6023,073 150 3,336 154 3,183 162186Sep-13 745 3,621673,264 161 421,443 2,909 145 186 58 202399,372 664,600 517,4472,950 135 3,703 179 3,178 163181Aug-13 819 3,571645,253 207 435,335 3,027 144 272 69 276411,739 598,408 458,6392,995 137 3,516 170 3,035 151180Jul-13 845 3,607648,161 242 440,472 2,997 147 307 60 327450,723 653,743 505,6843,174 142 3,924 167 3,253 155176Jun-13 842 3,586632,970 270 415,578 3,032 137 318 54 324421,902 711,432 432,6553,083 137 4,011 177 3,110 139176May-13 895 3,586632,518 339 460,416 3,152 146 298 38 373422,955 453,741 451,9933,051 139 3,383 134 3,098 146179Apr-13 850 3,638650,479 282 459,747 3,123 147 224 46 368399,516 559,738 521,0713,056 131 3,430 163 3,299 158176Mar-13 788 3,622637,097 255 414,628 3,050 136 207 51 335381,463 689,195 460,5062,973 128 3,880 178 3,189 144179Feb-13 698 3,674656,826 215 395,748 3,034 130 164 30 235359,287 853,851 496,9102,953 122 4,231 202 3,259 152175Jan-13 700 3,659638,958 175 387,407 3,020 129 129 62 236390,147 609,422 481,5802,993 130 3,775 161 3,287 147
© 2015 - 2016 Houston Association of Realtors Certain information contained herein is derived from information which is the licensed property of, and copyrighted by, Houston Association of Realtors
2 02/01/152 ofBrokerMetrics®Information not guaranteed. © 2015 - 2016 Terradatum and its suppliers and licensors (http://www.terradatum.com/metrics/licensors).
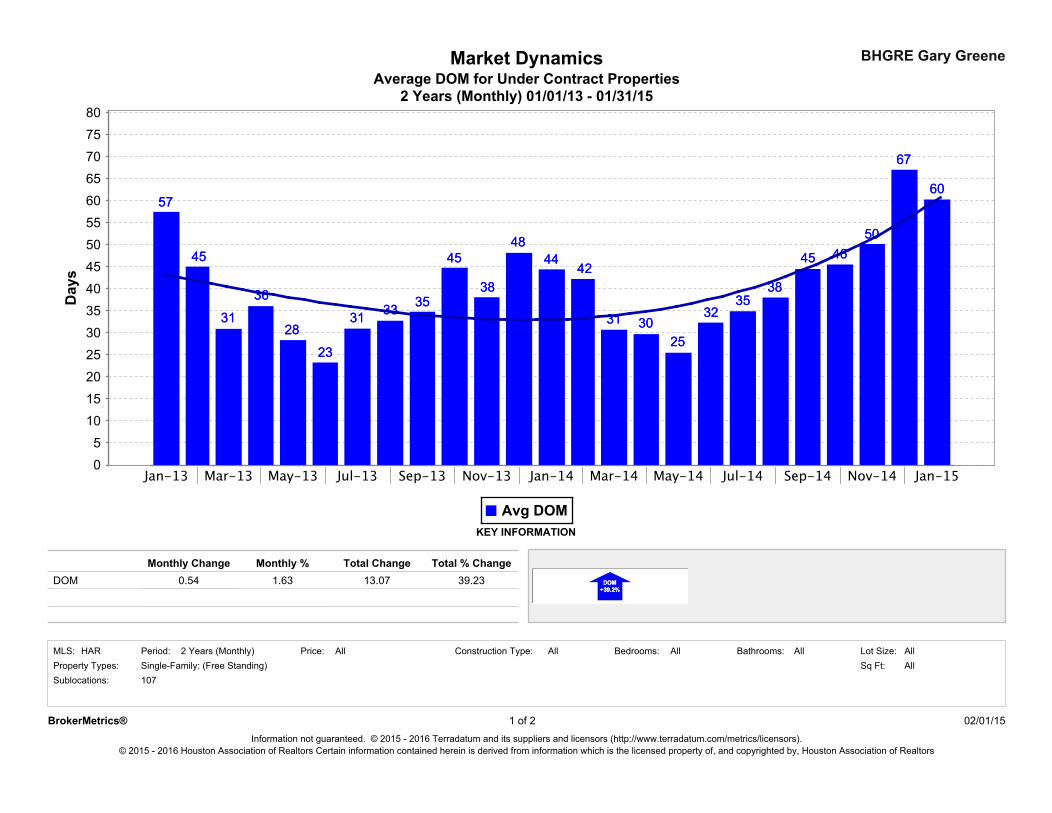
BHGRE Gary GreeneMarket Dynamics
2 Years (Monthly) 01/01/13 - 01/31/15Average DOM for Under Contract Properties
Monthly %0.54
107
Total % Change
Sq Ft:Bathrooms:All All
DOM
Construction Type:
Sublocations:
Period:Property Types:
13.07 39.23Monthly Change
1.63
Lot Size:All
KEY INFORMATION
Single-Family: (Free Standing) AllHAR AllBedrooms:
Total Change
AllMLS: Price:2 Years (Monthly)
Information not guaranteed. © 2015 - 2016 Terradatum and its suppliers and licensors (http://www.terradatum.com/metrics/licensors).
BrokerMetrics® 1 of 2
© 2015 - 2016 Houston Association of Realtors Certain information contained herein is derived from information which is the licensed property of, and copyrighted by, Houston Association of Realtors
02/01/15

Average DOM for Under Contract PropertiesMarket Dynamics BHGRE Gary Greene
2 Years (Monthly) 01/01/13 - 01/31/15
Period Avg DOM Avg CDOMContract# UnderTime
60Jan-15 8717367Dec-14 9514750Nov-14 7614246Oct-14 6418045Sep-14 6213538Aug-14 4921635Jul-14 4319532Jun-14 4227125May-14 3025530Apr-14 4627331Mar-14 4825742Feb-14 5718144Jan-14 7117748Dec-13 6111938Nov-13 5413445Oct-13 6219035Sep-13 5816133Aug-13 4520731Jul-13 4724223Jun-13 4327028May-13 3833936Apr-13 6428231Mar-13 5125545Feb-13 6821557Jan-13 86175
2
© 2015 - 2016 Houston Association of Realtors Certain information contained herein is derived from information which is the licensed property of, and copyrighted by, Houston Association of Realtors
02/01/15Information not guaranteed. © 2015 - 2016 Terradatum and its suppliers and licensors (http://www.terradatum.com/metrics/licensors).
BrokerMetrics® 2 of

! Page 1 9000 Forest Crossing The Woodlands, Texas 77381 Office: 281.367.3531 or 800.932.7253
The Woodlands Texas Real Estate Report Months Supply Of “For Sale” Listing Inventory – February 2nd, 2015
Q. Is it a Seller’s Market? According to real estate economists a six-month supply of For Sale Inventory represents a balanced market. Over six months of For Sale Inventory indicates a buyer’s market. Less than six months of inventory in considered a seller’s market. As we can see from these inventory numbers below, sellers priced under $900,000 enjoy a seller’s market. Here’s a break down by price. PRICE RANGE. . . . . . . . . . . . . . . MONTHS SUPPLY OF LISTING INVENTORY
$000,000 – $200,000 . . . . . . . . . . . . . . . . . . . . 25 Days
$200,001 – $300,000 . . . . . . . . . . . . . . . . . . . . 1.8 Months $300,001 – $400,000 . . . . . . . . . . . . . . . . . . . . 2.4 Months $400,001 – $500,000 . . . . . . . . . . . . . . . . . . . . 3.1 Months $500,001 – $600,000 . . . . . . . . . . . . . . . . . . . . 3.0 Months $600,001 – $700,000 . . . . . . . . . . . . . . . . . . . . 4.6 Months $700,001 – $800,000 . . . . . . . . . . . . . . . . . . . . 5.5 Months $800,001 – $900,000 . . . . . . . . . . . . . . . . . . . . 5.2 Months $900,001 – $1,000,000 . . . . . . . . . . . . . . . . . . . 8.8 Months
$1,000,001 - $1,500,000 . . . . . . . . . . . . . . . . . 9.3 Months $1,500,001 - $2,000,000 . . . . . . . . . . . . . . . . 10.0 Months
$2,000,001+ . . . . . . . . . . . . . . . . . . . . . . . . . . 21.6 Months All Price Ranges . . . . . . . . . . . . . . . . . . . . . . . . 3.1 Months
What does this mean? For Buyers: in a seller’s market, when you find something you love, don’t hesitate to submit an offer. If you snooze you lose out. For Sellers: Any amateur can sell a property in a screaming seller’s market. To sell your property for HIGHEST possible price and the BEST possible terms call us today. Closing Thoughts: While mulling over these inventory numbers, keep in mind these figures represent big averages across The Woodlands. Real estate is hyper local in nature and market conditions for your specific property, in your specific neighborhood may be different that the big average you see above. To find out what’s happening in your neighborhood, contact us and we’ll provide you with an up to the minute, on-target Months Supply of Inventory report. Give us a call and we’ll send you your free report – pronto.

Months Supply of Inventory (UC Calculation)Market Dynamics
2 Years (Monthly) 01/01/13 - 01/31/15
BHGRE Gary Greene
Sublocations:
141.29
Price:HAR Bedrooms:Period:
Monthly %MSI-UC
2 Years (Monthly)
107
5.89
Single-Family: (Free Standing)
Total % Change
Property Types:
KEY INFORMATION
AllAll Lot Size:All
2.46Monthly Change
0.10Total Change
Sq Ft:AllAll Bathrooms:MLS: AllConstruction Type:
Information not guaranteed. © 2015 - 2016 Terradatum and its suppliers and licensors (http://www.terradatum.com/metrics/licensors).
BrokerMetrics® 1 of 2
© 2015 - 2016 Houston Association of Realtors Certain information contained herein is derived from information which is the licensed property of, and copyrighted by, Houston Association of Realtors
02/01/15

BHGRE Gary GreeneMarket DynamicsMonths Supply of Inventory (UC Calculation)
2 Years (Monthly) 01/01/13 - 01/31/15
Period NAR MSI # SoldMSI# For Sale Last
Day of Month# UnderContract
Time
5.5Jan-15 173 1146243.6
3.0Dec-14 147 2066164.2
5.8Nov-14 142 1257225.1
4.6Oct-14 180 1627424.1
4.2Sep-14 135 1837765.7
3.4Aug-14 216 2227613.5
2.6Jul-14 195 2977714.0
2.5Jun-14 271 2676782.5
2.5May-14 255 2636562.6
2.5Apr-14 273 2275662.1
2.5Mar-14 257 1995022.0
3.2Feb-14 181 1404552.5
3.6Jan-14 177 1224382.5
2.5Dec-13 119 1704333.6
2.7Nov-13 134 1754753.5
2.9Oct-13 190 1664852.6
2.8Sep-13 161 1865263.3
2.0Aug-13 207 2725432.6
1.8Jul-13 242 3075432.2
1.6Jun-13 270 3185181.9
1.7May-13 339 2985181.5
2.3Apr-13 282 2245221.9
2.3Mar-13 255 2074821.9
2.8Feb-13 215 1644532.1
3.6Jan-13 175 1294632.6
2
© 2015 - 2016 Houston Association of Realtors Certain information contained herein is derived from information which is the licensed property of, and copyrighted by, Houston Association of Realtors
02/01/15Information not guaranteed. © 2015 - 2016 Terradatum and its suppliers and licensors (http://www.terradatum.com/metrics/licensors).
BrokerMetrics® 2 of