Embed Size (px)
Citation preview
Q44
1
2
LEE OVERVIEW
NATIONAL OVERVIEW
SIGNIFICANT TRANSACTIONS
5 LEE NETWORK
3 KEY MARKET SNAPSHOTS
The Lee Industrial Brief
2016
1Lee & Associates Overview
agentsand growingnationwide
887transaction volume
2015
$12+ billionincrease
in transactionvolume over 5 years
155%
LOCAL EXPERTISE. NATIONAL REACH. WORLD CLASS.
At Lee & Associates® our reach is national but our expertise is local market implementation. This translates into seamless, consistent execution and value driven market-to-market services.
Our agents understand real estate and accountability. They provide an integrated approach to leasing, operational efficiencies, capital markets, property management, valuation, disposition, development, research and consulting.
We are creative strategists who provide value and custom solutions, enabling our clients to make profitable decisions.
INDUSTRIALOFFICE
RETAILINVESTMENT
MULTI-FAMILYLANDPROPERTY MANAGEMENT
APPRAISAL
VALUATION & CONSULTING
WESTMIDWEST
SOUTH
SOUTH-WEST
EAST
BCCANADA
THE POWER OF THE LEE NETWORK
Irvine, CAOrange, CANewport Beach, CAOntario, CARiverside, CALos Angeles, CAIndustry, CACarlsbad, CAStockton, CAPleasanton, CAWest LA, CA
Sherman Oaks, CACentral LA, CATemecula Valley, CAVictorville, CACalabasas, CALos Olivos, CASan Luis Obispo, CAVentura, CASan Diego, CAReno, NV Oakland, CA
Antelope Valley, CASanta Barbara, CAPalm Desert, CAISG- LA, CABoise, IDLong Beach, CADenver, COPasadena, CAWalnut Creek, CASeattle, WA
Phoenix, AZDallas/Ft Worth, TXHouston, TX
Chicago, IL,St. Louis, MOSouthfield, MIMadison, WIIndianapolis, INGreenwood, INCleveland, OHColumbus, OHTwin Cities, MN
Atlanta, GAGreenville, SCFort Myers, FLOrlando, FLCharleston, SCValuation, Atlanta
Elwood,NJ Manhattan, NYEdison, NJChesapeake RegionLI/Queens , NYEastern Pennsylvania
Vancouver, BCCanada
Ranked 2ndjune 2016
Commercial Property Executive(2016 Top Brokerage Firms)
lee-associates.com 31 LEE OVERVIEW KEY MARKET SNAPSHOTS 5 LEE NETWORKNATIONAL OVERVIEW2 4 SIGNIFICANT TRANSACTIONS
WESTMIDWEST
SOUTH
SOUTH-WEST
EAST
BCCANADA
lee-associates.com 31 LEE OVERVIEW KEY MARKET SNAPSHOTS 5 LEE NETWORKNATIONAL OVERVIEW2 4 SIGNIFICANT TRANSACTIONS
National Economic Overview2
US INDUSTRIAL MARKET 2016 ENDS ON A HIGH NOTE
Vaca
ncy
Rat
e
0%
2%
4%
6%
8%
10%
12%
14%
16%Flex Warehouse Total Market
2002Q4
2003Q4
2004Q4
2005Q4
2006Q4
2007Q4
2008Q4
2009Q4
2010Q4
2011Q4
2012Q4
2013Q4
2014Q4
2015Q4
2016Q4
VACANCY RATES BY BUILDING TYPE 2001 - 2016
ECONOMICDRIVERS
20
40
60
80
100
120
140
0
PreleasedUn-Leased
FS snoilliM 2017
Q32016Q4
2017Q1
2017Q2
160
FUTURE DELIVERIESPRELEASED & UN-LEASED SF IN PROPERTIES SCHEDULED TO DELIVER
Leased
FS snoilliM
2012 2013 2014 2015 2016
125
200
225
250
275
0
100
150
175
300Un-Leased
RECENT DELIVERIESLEASED & UN-LEASED SF IN DELIVERIES LAST 5 YEARS
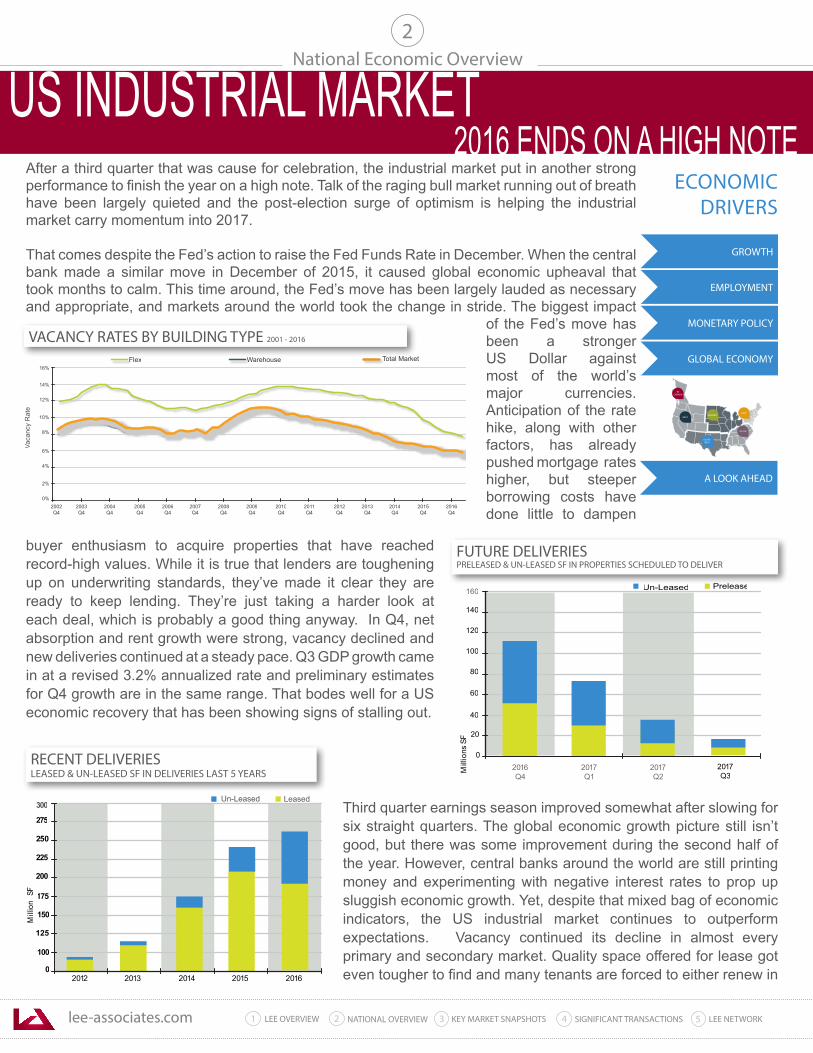
buyer enthusiasm to acquire properties that have reached record-high values. While it is true that lenders are toughening up on underwriting standards, they’ve made it clear they are ready to keep lending. They’re just taking a harder look at each deal, which is probably a good thing anyway. In Q4, net absorption and rent growth were strong, vacancy declined and new deliveries continued at a steady pace. Q3 GDP growth came in at a revised 3.2% annualized rate and preliminary estimates for Q4 growth are in the same range. That bodes well for a US economic recovery that has been showing signs of stalling out.
Third quarter earnings season improved somewhat after slowing for six straight quarters. The global economic growth picture still isn’t good, but there was some improvement during the second half of the year. However, central banks around the world are still printing money and experimenting with negative interest rates to prop up sluggish economic growth. Yet, despite that mixed bag of economic indicators, the US industrial market continues to outperform expectations. Vacancy continued its decline in almost every primary and secondary market. Quality space offered for lease got even tougher to find and many tenants are forced to either renew in
EMPLOYMENT
GROWTH
MONETARY POLICY
GLOBAL ECONOMY
A LOOK AHEAD
GDP
After a third quarter that was cause for celebration, the industrial market put in another strong performance to finish the year on a high note. Talk of the raging bull market running out of breath have been largely quieted and the post-election surge of optimism is helping the industrial market carry momentum into 2017.
That comes despite the Fed’s action to raise the Fed Funds Rate in December. When the central bank made a similar move in December of 2015, it caused global economic upheaval that took months to calm. This time around, the Fed’s move has been largely lauded as necessary and appropriate, and markets around the world took the change in stride. The biggest impact
of the Fed’s move has been a stronger US Dollar against most of the world’s major currencies. Anticipation of the rate hike, along with other factors, has already pushed mortgage rates higher, but steeper borrowing costs have done little to dampen
lee-associates.com 31 LEE OVERVIEW KEY MARKET SNAPSHOTS 5 LEE NETWORKNATIONAL OVERVIEW2 4 SIGNIFICANT TRANSACTIONS
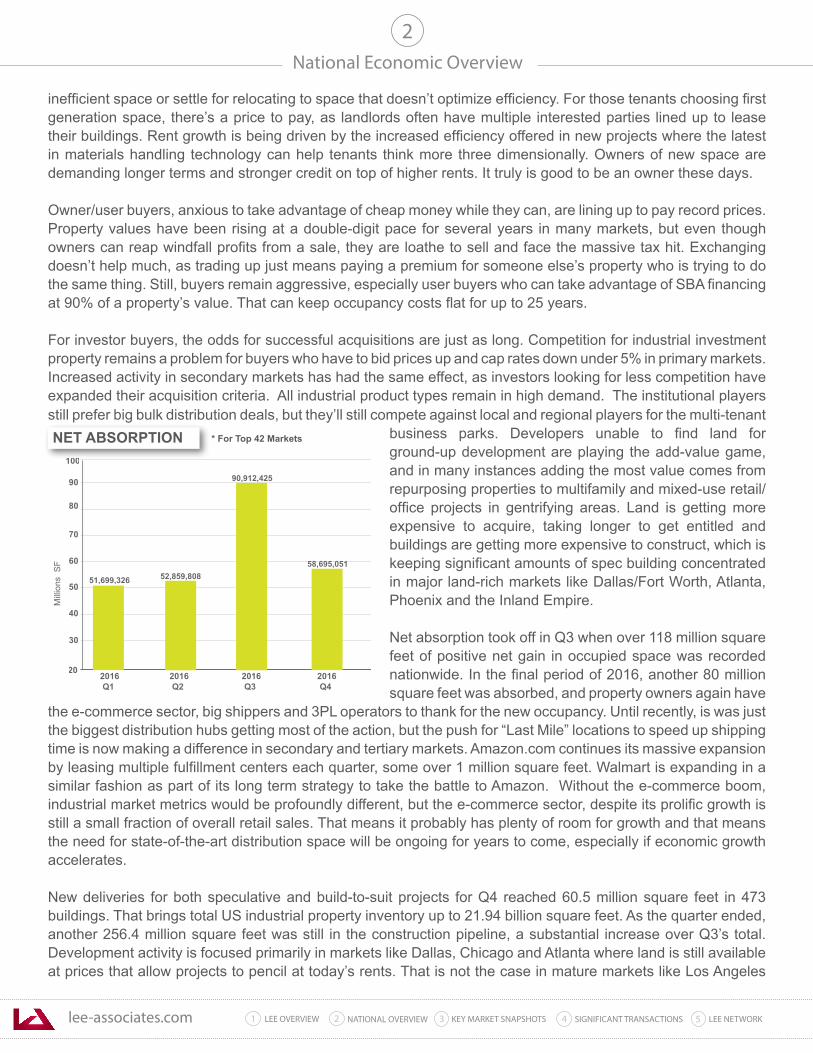
still prefer big bulk distribution deals, but they’ll still compete against local and regional players for the multi-tenant business parks. Developers unable to find land for ground-up development are playing the add-value game, and in many instances adding the most value comes from repurposing properties to multifamily and mixed-use retail/office projects in gentrifying areas. Land is getting more expensive to acquire, taking longer to get entitled and buildings are getting more expensive to construct, which is keeping significant amounts of spec building concentrated in major land-rich markets like Dallas/Fort Worth, Atlanta, Phoenix and the Inland Empire.
Net absorption took off in Q3 when over 118 million square feet of positive net gain in occupied space was recorded nationwide. In the final period of 2016, another 80 million square feet was absorbed, and property owners again have
the e-commerce sector, big shippers and 3PL operators to thank for the new occupancy. Until recently, is was just the biggest distribution hubs getting most of the action, but the push for “Last Mile” locations to speed up shipping time is now making a difference in secondary and tertiary markets. Amazon.com continues its massive expansion by leasing multiple fulfillment centers each quarter, some over 1 million square feet. Walmart is expanding in a similar fashion as part of its long term strategy to take the battle to Amazon. Without the e-commerce boom, industrial market metrics would be profoundly different, but the e-commerce sector, despite its prolific growth is still a small fraction of overall retail sales. That means it probably has plenty of room for growth and that means the need for state-of-the-art distribution space will be ongoing for years to come, especially if economic growth accelerates.
New deliveries for both speculative and build-to-suit projects for Q4 reached 60.5 million square feet in 473 buildings. That brings total US industrial property inventory up to 21.94 billion square feet. As the quarter ended, another 256.4 million square feet was still in the construction pipeline, a substantial increase over Q3’s total. Development activity is focused primarily in markets like Dallas, Chicago and Atlanta where land is still available at prices that allow projects to pencil at today’s rents. That is not the case in mature markets like Los Angeles
National Economic Overview
2
inefficient space or settle for relocating to space that doesn’t optimize efficiency. For those tenants choosing first generation space, there’s a price to pay, as landlords often have multiple interested parties lined up to lease their buildings. Rent growth is being driven by the increased efficiency offered in new projects where the latest in materials handling technology can help tenants think more three dimensionally. Owners of new space are demanding longer terms and stronger credit on top of higher rents. It truly is good to be an owner these days.
Owner/user buyers, anxious to take advantage of cheap money while they can, are lining up to pay record prices. Property values have been rising at a double-digit pace for several years in many markets, but even though owners can reap windfall profits from a sale, they are loathe to sell and face the massive tax hit. Exchanging doesn’t help much, as trading up just means paying a premium for someone else’s property who is trying to do the same thing. Still, buyers remain aggressive, especially user buyers who can take advantage of SBA financing at 90% of a property’s value. That can keep occupancy costs flat for up to 25 years.
For investor buyers, the odds for successful acquisitions are just as long. Competition for industrial investment property remains a problem for buyers who have to bid prices up and cap rates down under 5% in primary markets. Increased activity in secondary markets has had the same effect, as investors looking for less competition have expanded their acquisition criteria. All industrial product types remain in high demand. The institutional players
60
80
70
50
40
30
Mill
ions
SF
90
20
100
90,912,425
2016Q1
52,859,808
2016Q2
51,699,326
2016Q3
58,695,051
2016Q4
NET ABSORPTION * For Top 42 Markets
lee-associates.com 31 LEE OVERVIEW KEY MARKET SNAPSHOTS 5 LEE NETWORKNATIONAL OVERVIEW2 4 SIGNIFICANT TRANSACTIONS
National Economic Overview2
LOOKING AHEAD
The US industrial market heads into 2017 firing on all cylinders. High demand, low supply, rising prices and declining vacancy are still driving market dynamics, just as they did as 2016 began. Stronger economic growth, more direction on monetary policy and minor economic improvement around the globe could give the US industrial market growth another boost this year. Our central bankers have given themselves some maneuvering room by raising the Fed Funds Rate in December. Many economists are relieved as a result and they remain hopeful the Fed will follow through with more rate hikes this year. However, that raises the risk that cap rates will decompress in response to higher yields in other asset classes. For example, the yield on 10-Year Treasuries, the so-called riskless investment, has risen over 100 basis points since March of 2016.
Internationally, the news is not as bad as it was three months ago. The global economy is still in tough shape, but the post-Brexit scare was short-lived the markets have gotten used to the idea of an EU without the United Kingdom. China and other emerging economies are still facing big challenges, but stock market volatility has subsided and the doomsayers have been largely silenced by those who see the global economy as showing signs of stability, albeit with the assistance of massive monetary intervention in Europe, Japan, China and other emerging markets.
The US economy is doing better, relatively speaking. GDP numbers are improving, job creation is trending down, but still in healthy territory and wage growth hit an annualized rate of 2.9% in December, highest in several years. Barring a “significant” economic event, the industrial property market should continue to expand. The US is still the preferred safe haven for foreign investment, as well, and owning US Dollar-denominated assets is a priority for foreign investors, big and small. So, capital will keep flowing into the US, which could serve to mitigate cap rate decompression by keeping demand for industrial running ahead of supply.
Vacancy will keep moving lower, as the bulk of new construction is concentrated in distribution hub markets with strong, ongoing positive net absorption. Net absorption should remain positive and healthy in 2017, but may moderate in markets that lack quality options for expanding tenants. More tenants in those areas will be forced to renew in place at higher lease rates, even for functionally obsolete space. Construction will remain at current levels in areas with ample supplies of land, but will decline further in markets with fewer available sites.
where what little land remains is too expensive for conventional industrial development. Infill markets like LA are in danger of losing industrial inventory to repurposing to other product types that make more economic sense.
As we reported last quarter, the balance between spec and build-to-suit construction has helped keep market metrics in balance and the risks of overbuilding at a minimum. New deliveries continue to run short of net absorption, which has maintained market equilibrium even in markets with substantial construction. Speculative buildings are leasing quickly to fast growing tenants who like not having to wait for build-to-suit space.
The national vacancy rate for warehouse and flex space continued to decline in Q4, shedding another 10 basis points to finish the period at 5.5%. In the past three quarters, the vacancy rate has fallen by 40 basis points, and several major market areas still have vacancy rates in the 2% range, including Central Los Angeles, Long Island, New York and California’s Orange County.
Average asking lease rates across the country moved higher again in Q4, ending the period up $.07 to $6.05. Markets with the highest levels of construction are still seeing the most rent growth, as tenants remain willing to pay a premium for efficient, first generation space. Rising land and construction costs are becoming more of challenge, as some developers and lenders are getting more cautious about projecting rents for projects that might be years away from completion. Protracted and expensive entitlement processes have contributed to the problem.

lee-associates.com 31 LEE OVERVIEW KEY MARKET SNAPSHOTS 5 LEE NETWORKNATIONAL OVERVIEW2 4 SIGNIFICANT TRANSACTIONS
National Economic Overview2
QUARTER-TO-QUARTER GROWTH IN REAL GDP
GDP GROWTH
Unfortunately, the first estimate of Q4 growth came in at just 1.9%, which left 2016 with a growth rate of just 1.6%. That is good relative to the rest of the world. Europe and Japan are still in tough shape, despite drastic monetary and fiscal measures to keep their economies from sliding into recession.
GDPNow, the Atlanta Fed’s weekly index measuring GDP, currently estimates 2.9% growth for Q4. If that proves true, the US economy will at least surpass 2% growth for the year, which is weak, but still on the right side of the line. In 2015, GDP grew at a 2.4% clip.
Even with that decline, the US looks relatively good. Europe and Japan are still in tough shape, despite drastic monetary and fiscal measures to keep their economies from sliding into recession. The central banks in both regions continue their experiment in NIRP (Negative Interest Rate Policy) and they have ongoing and bond-buying programs to encourage businesses to borrow at low or negative rates. Even with
US GDP, the primary metric for tracking the total output of US goods and services, is perhaps the most closely watched statistic in the world. Our economy is, by far, the largest on the planet and we also consume more foreign goods and services than any other nation. Whatever happens here at home, is felt and observed the world over. Fortunately, US GDP growth picked up in Q3 after several dismal quarterly performances that had the domestic economy running just above stall speed. In Q1, the economy expanded by just .9%, followed by a disappointing 1.4% rate in Q2. The third and final estimate of Q3 growth came in at 3.2%, which had investors breathing a collective sigh of relief. However, a rather obscure but important fact is that the export of soy beans resulting from a poor harvest in South America accounted for more than a fourth of that number.
lee-associates.com 31 LEE OVERVIEW KEY MARKET SNAPSHOTS 5 LEE NETWORKNATIONAL OVERVIEW2 4 SIGNIFICANT TRANSACTIONS
National Economic Overview2
GDP GROWTH all that meddling, GDP growth remains well under 2% in the Euro Area, and the unknown danger associated with unwinding the European Central Bank’s monetary experiment is still looming. The Bank of Japan keeps printing money and buying bonds in such volume that it is running out of bonds to buy. So, it has resorted to buying equities to get the stimulus money placed.
There is no denying the reality of globalization and things are not going well outside our borders. Political turmoil, civil unrest and economic challenges around the world weigh heavy on the minds of domestic investors, and most definitely figure into the strategy of our central bankers. The question that remains is whether or not US companies and consumers will accept the slower growth model as the “new normal” and act in a way that promotes further growth.
No discussion on economics can be had without considering the newest wild card in global economics: Donald Trump. The US President-Elect stunned the globe with a victory that odds-makers didn’t see coming. Neither did Hillary Clinton and her followers, who woke up on November 9th in a world they least expected. Regardless of your political persuasion, there’s no denying the immediate effects of the election. Equities markets soared on the expectation of lower corporate and personal income tax rates, reduced regulations and a huge infrastructure spending program. Of course, none of that has yet happened. Mr. Trump will have just taken the oath of office as this writing is released and he will only be beginning to navigate a political system designed to have big change occur over time. Checks and balances built into the US Constitution give the minority protection against being steamrolled. So, our new leader, who is used to calling all the shots when making business decisions, will need some time to acclimate to a different set of rules. But, the preliminary indication from the business world has been positive now that the reality of his victory is sinking in. What impact he can have on GDP in the short run is a complete unknown at this point, but the psychology of decision making going forward may be influenced by the prospects of a more business-friendly President. Volatility in equities has been on the rise in 2016, as US companies grapple with sluggish market conditions. Corporate earnings have declined repeatedly the last six quarters and companies have been resorting to cost-cutting and stock buyback programs to increase profits and earnings per share. Reducing operating costs means job cuts and that means reduced consumer spending, which accounts for roughly 70% of GDP. Though, it is important to note that the most recent earnings cycle did show signs of improvement. As we have pointed out all year, US consumers have been riding the brakes on spending. Retail sales growth, a large component of consumer spending, has been a problem and wage growth has been lagging behind previous economic recoveries, though it did spike in December to 2.9% year-over-year. Auto sales set a record, but most of a December increase can attributed to incentives to move slow selling vehicles off the lots before the year ended. The bottom line on GDP is that it could go either way. If the Trump effect lasts for a while, business investment and consumer spending could build some momentum and those are the two main components of GDP. If that happens, however, the Fed will make more interest rate moves and that will strengthen the US Dollar and hurt exports, another key component of GDP.
lee-associates.com 31 LEE OVERVIEW KEY MARKET SNAPSHOTS 5 LEE NETWORKNATIONAL OVERVIEW2 4 SIGNIFICANT TRANSACTIONS
Job growth is one the most perplexing of economic indicators, especially due to the fact that the U3 unemployment rate is the most widely quoted rate. The base for the U3 rate includes those who are employed and those who are unemployed but have actively sought employment in the last five weeks. We are not sure who made that one up, but we would sure like to know what the logic was. The U3 equation often produces counter-intuitive results. When job creation is good, those who have not been looking for work, re-engage in their search and are added to the total of those who are actively looking, increasing the number of unemployed workers and thereby raising the unemployment rate.
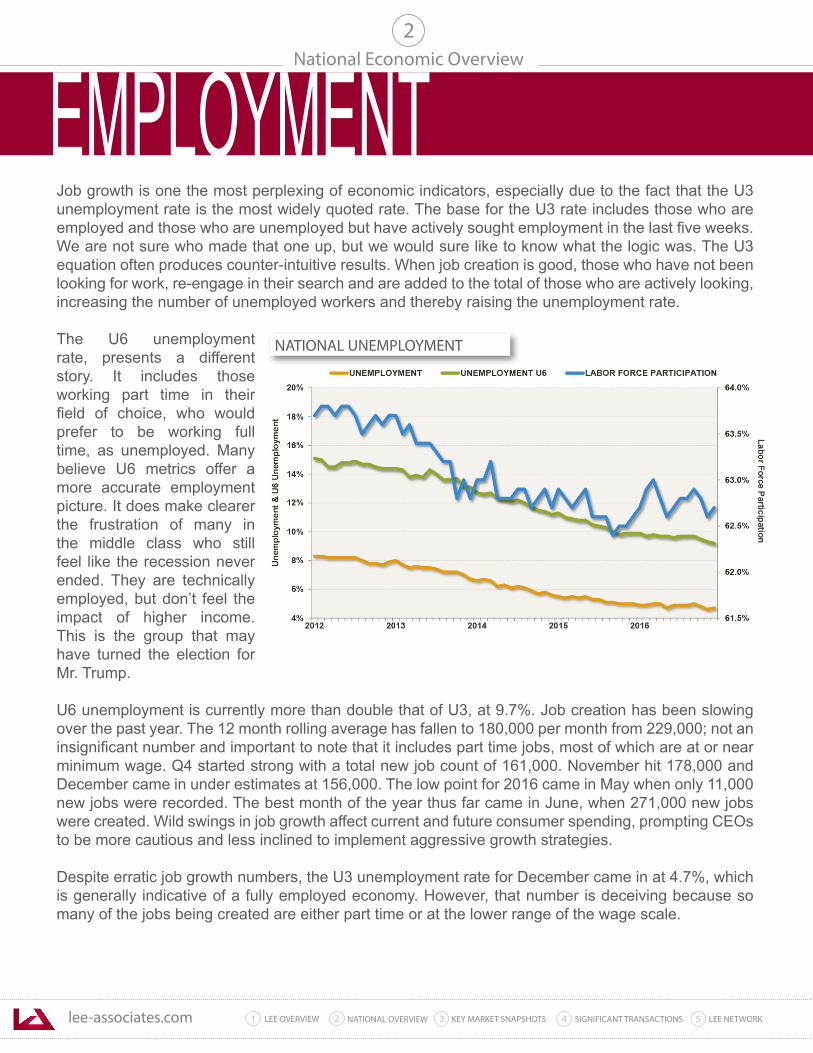
The U6 unemployment rate, presents a different story. It includes those working part time in their field of choice, who would prefer to be working full time, as unemployed. Many believe U6 metrics offer a more accurate employment picture. It does make clearer the frustration of many in the middle class who still feel like the recession never ended. They are technically employed, but don’t feel the impact of higher income. This is the group that may have turned the election for Mr. Trump.
U6 unemployment is currently more than double that of U3, at 9.7%. Job creation has been slowing over the past year. The 12 month rolling average has fallen to 180,000 per month from 229,000; not an insignificant number and important to note that it includes part time jobs, most of which are at or near minimum wage. Q4 started strong with a total new job count of 161,000. November hit 178,000 and December came in under estimates at 156,000. The low point for 2016 came in May when only 11,000 new jobs were recorded. The best month of the year thus far came in June, when 271,000 new jobs were created. Wild swings in job growth affect current and future consumer spending, prompting CEOs to be more cautious and less inclined to implement aggressive growth strategies.
Despite erratic job growth numbers, the U3 unemployment rate for December came in at 4.7%, which is generally indicative of a fully employed economy. However, that number is deceiving because so many of the jobs being created are either part time or at the lower range of the wage scale.
National Economic Overview2
NATIONAL UNEMPLOYMENT
EMPLOYMENT
lee-associates.com 31 LEE OVERVIEW KEY MARKET SNAPSHOTS 5 LEE NETWORKNATIONAL OVERVIEW2 4 SIGNIFICANT TRANSACTIONS
The cost of health care pursuant to the Affordable Care Act (ACA) is also contributing to part time employment problem, as employers are inclined to hire workers just under the 30 hour per week threshold that would require them to provide health benefits. The new administration has vowed to repeal and replace the landmark legislation, but that could take years to make happen, if it ever does. Too much water may have flowed under that bridge already.
The Labor Participation Rate, the metric that measures the percentage of those eligible for employment between the ages of 16 and 64 who are currently working, also remains stagnant. Choppy job growth reports and the early exit of Baby Boomers, have combined to keep just 62.7% of potential workers in active production. It is important to note that Labor Participation has moved off a five decade low, but it may head down again in the next few years as the rate of early-retiring Baby Boomers increases. Lagging wage growth is another problem that has dogged the US economy in this recovery. Full-time, high-paying jobs are in short supply and wage growth overall is tracking at a rate that finally rose to 2.9% in December. If you are making a middle income wage, a 3% increase may not change your spending habits. Half of that increase will cover inflation, leaving the other half for discretionary spending. That kind of wage growth offers little relief to workers at or near the minimum wage level who are struggling to make ends meet. It’s no wonder that so many middle class workers are disillusioned with a recovery that they feel has left them behind. Layoffs in the energy sector have not helped the job picture, either. More than 700,000 full time positions have been eliminated since oil prices declined sharply back in 2014. Many of those jobs were high-paying technical positions that are not easily replaced in other business sectors like technology and business services that have contributed most to recent job gains.
National Economic Overview2
EMPLOYMENT
lee-associates.com 31 LEE OVERVIEW KEY MARKET SNAPSHOTS 5 LEE NETWORKNATIONAL OVERVIEW2 4 SIGNIFICANT TRANSACTIONS
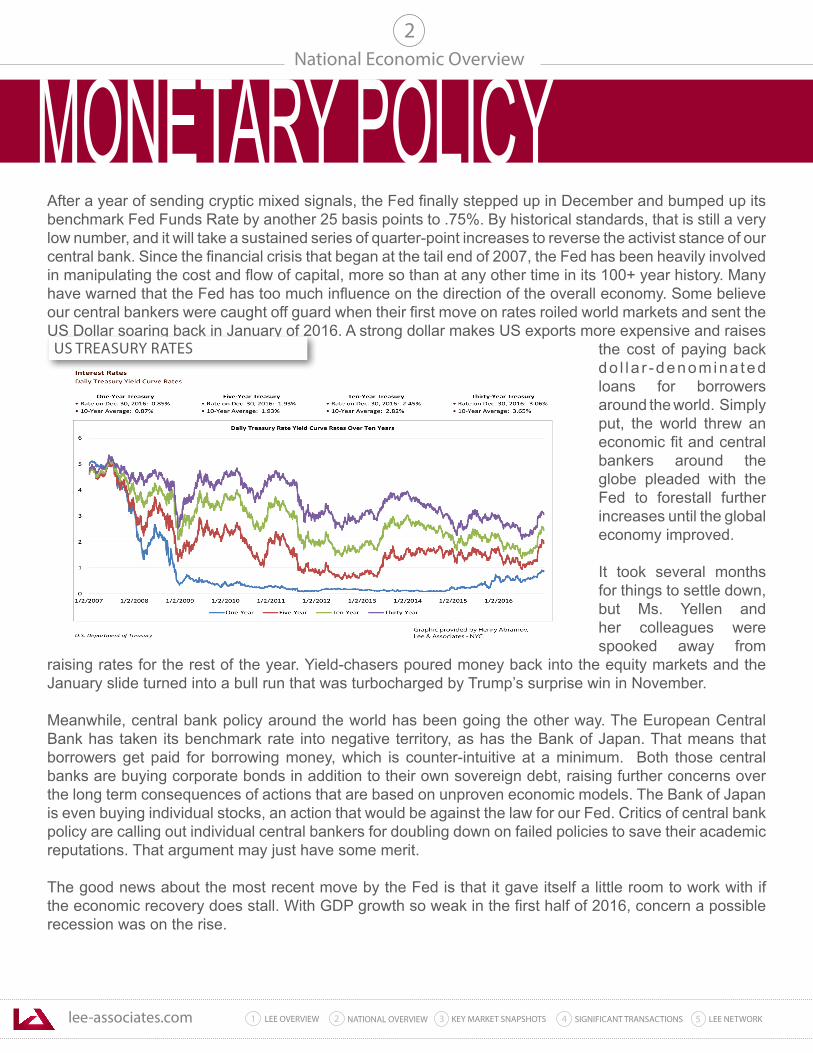
After a year of sending cryptic mixed signals, the Fed finally stepped up in December and bumped up its benchmark Fed Funds Rate by another 25 basis points to .75%. By historical standards, that is still a very low number, and it will take a sustained series of quarter-point increases to reverse the activist stance of our central bank. Since the financial crisis that began at the tail end of 2007, the Fed has been heavily involved in manipulating the cost and flow of capital, more so than at any other time in its 100+ year history. Many have warned that the Fed has too much influence on the direction of the overall economy. Some believe our central bankers were caught off guard when their first move on rates roiled world markets and sent the US Dollar soaring back in January of 2016. A strong dollar makes US exports more expensive and raises
the cost of paying back do l l a r -denomina ted loans for borrowers around the world. Simply put, the world threw an economic fit and central bankers around the globe pleaded with the Fed to forestall further increases until the global economy improved.
It took several months for things to settle down, but Ms. Yellen and her colleagues were spooked away from
raising rates for the rest of the year. Yield-chasers poured money back into the equity markets and the January slide turned into a bull run that was turbocharged by Trump’s surprise win in November.
Meanwhile, central bank policy around the world has been going the other way. The European Central Bank has taken its benchmark rate into negative territory, as has the Bank of Japan. That means that borrowers get paid for borrowing money, which is counter-intuitive at a minimum. Both those central banks are buying corporate bonds in addition to their own sovereign debt, raising further concerns over the long term consequences of actions that are based on unproven economic models. The Bank of Japan is even buying individual stocks, an action that would be against the law for our Fed. Critics of central bank policy are calling out individual central bankers for doubling down on failed policies to save their academic reputations. That argument may just have some merit.
The good news about the most recent move by the Fed is that it gave itself a little room to work with if the economic recovery does stall. With GDP growth so weak in the first half of 2016, concern a possible recession was on the rise.
National Economic Overview2
MONETARY POLICYUS TREASURY RATES
lee-associates.com 31 LEE OVERVIEW KEY MARKET SNAPSHOTS 5 LEE NETWORKNATIONAL OVERVIEW2 4 SIGNIFICANT TRANSACTIONS
Fortunately, Q3 growth improved, but the first estimates for Q4 came in at a disappointing 1.9%. Hopefully, the Fed can follow through with further rate hikes in 2017 to move further out of the corner it painted itself in to over the past 10 years. If not, it could run out of ammunition to stimulate growth and be forced into the uncharted waters of negative interest rates.
Trump’s promise of a massive infrastructure investment has buoyed hopes that the Federal government will help out on the fiscal side of the equation, and not continue to leave all the heavy lifting up to the Fed. But, that means bigger federal deficits that are already on their way back to over $1 Trillion per year. Bottom line: the Fed still has itself in a pickle and is short on ideas to get the economy back on a track of healthy growth. The takeaway might be that the Fed has reached the limits of its effectiveness, and that might get investors more focused on markets themselves rather than what impact Fed action will have on those markets. We’ll just have to see if we are really open to learning that lesson.
Real estate borrowers are still the beneficiaries of the Fed’s current monetary policy direction. Mortgage rates have remained at historic lows, but they have begun to move up. Most commercial property lenders use a spread over the yield on the 10 Year T-bill to set mortgage rates, and that yield has risen by over 50 basis points since the election. Long-term loans are still readily available, but underwriting is tightening up and interest rates have already moved higher. The Fed’s willingness to make another move up in the short term will be a signal for long term lenders to get more aggressive with further rate hikes of their own. For the moment, it’s still a good time to borrow money.
Nothing against Ms. Yellen and her Board of Governors, but it would sure be nice if they were off the front page every day.
National Economic Overview2
MONETARY POLICY
lee-associates.com 31 LEE OVERVIEW KEY MARKET SNAPSHOTS 5 LEE NETWORKNATIONAL OVERVIEW2 4 SIGNIFICANT TRANSACTIONS
National Economic Overview
GLOBAL ECONOMYIn the past two quarters we have been describing the global economic outlook as troublesome. We still do, but we can point to at least some improvement around the world. The panic over the Brexit vote was short-lived. It didn’t take long for world markets to absorb the news. There’s a long way to go, but the UK’s exit from the EU is drawing much less attention now. The British Pound took a beating, but that may also be short-lived, once the actual process ramps up this spring.
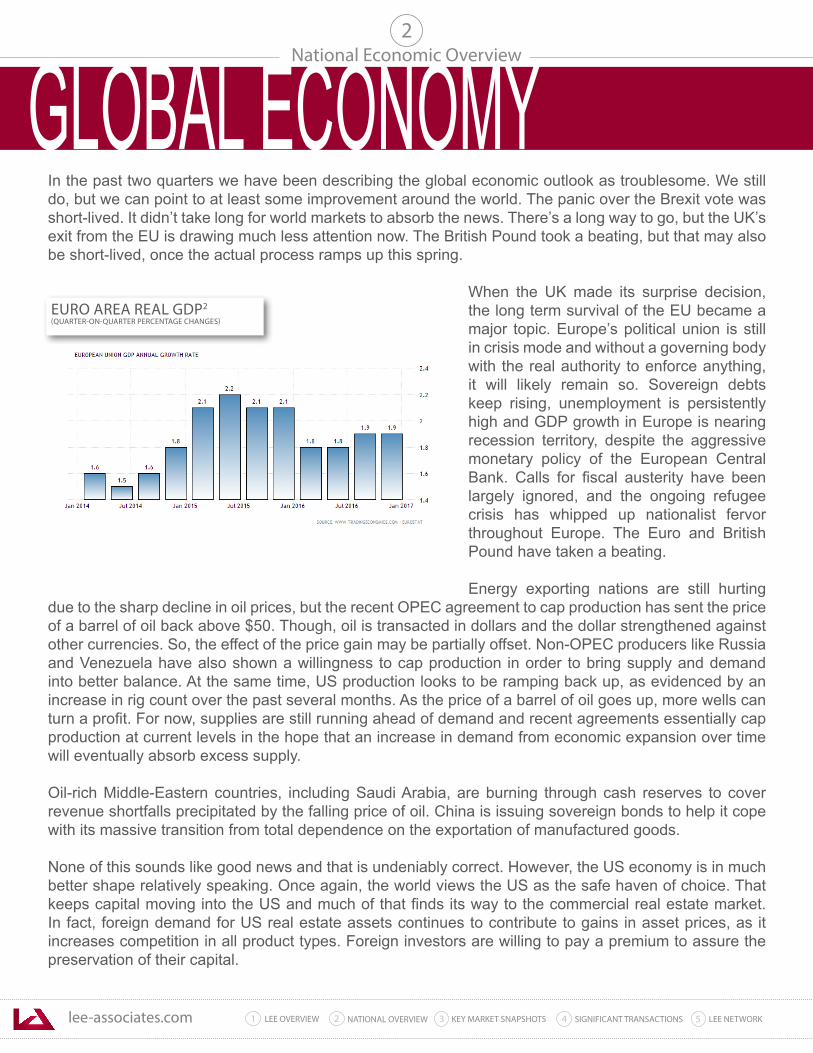
When the UK made its surprise decision, the long term survival of the EU became a major topic. Europe’s political union is still in crisis mode and without a governing body with the real authority to enforce anything, it will likely remain so. Sovereign debts keep rising, unemployment is persistently high and GDP growth in Europe is nearing recession territory, despite the aggressive monetary policy of the European Central Bank. Calls for fiscal austerity have been largely ignored, and the ongoing refugee crisis has whipped up nationalist fervor throughout Europe. The Euro and British Pound have taken a beating.
Energy exporting nations are still hurting due to the sharp decline in oil prices, but the recent OPEC agreement to cap production has sent the price of a barrel of oil back above $50. Though, oil is transacted in dollars and the dollar strengthened against other currencies. So, the effect of the price gain may be partially offset. Non-OPEC producers like Russia and Venezuela have also shown a willingness to cap production in order to bring supply and demand into better balance. At the same time, US production looks to be ramping back up, as evidenced by an increase in rig count over the past several months. As the price of a barrel of oil goes up, more wells can turn a profit. For now, supplies are still running ahead of demand and recent agreements essentially cap production at current levels in the hope that an increase in demand from economic expansion over time will eventually absorb excess supply. Oil-rich Middle-Eastern countries, including Saudi Arabia, are burning through cash reserves to cover revenue shortfalls precipitated by the falling price of oil. China is issuing sovereign bonds to help it cope with its massive transition from total dependence on the exportation of manufactured goods. None of this sounds like good news and that is undeniably correct. However, the US economy is in much better shape relatively speaking. Once again, the world views the US as the safe haven of choice. That keeps capital moving into the US and much of that finds its way to the commercial real estate market. In fact, foreign demand for US real estate assets continues to contribute to gains in asset prices, as it increases competition in all product types. Foreign investors are willing to pay a premium to assure the preservation of their capital.
EURO AREA REAL GDP2
(QUARTER-ON-QUARTER PERCENTAGE CHANGES)
2
BCCANADA
lee-associates.com 31 LEE OVERVIEW KEY MARKET SNAPSHOTS 5 LEE NETWORKNATIONAL OVERVIEW2 4 SIGNIFICANT TRANSACTIONS
Key Market Snapshots3
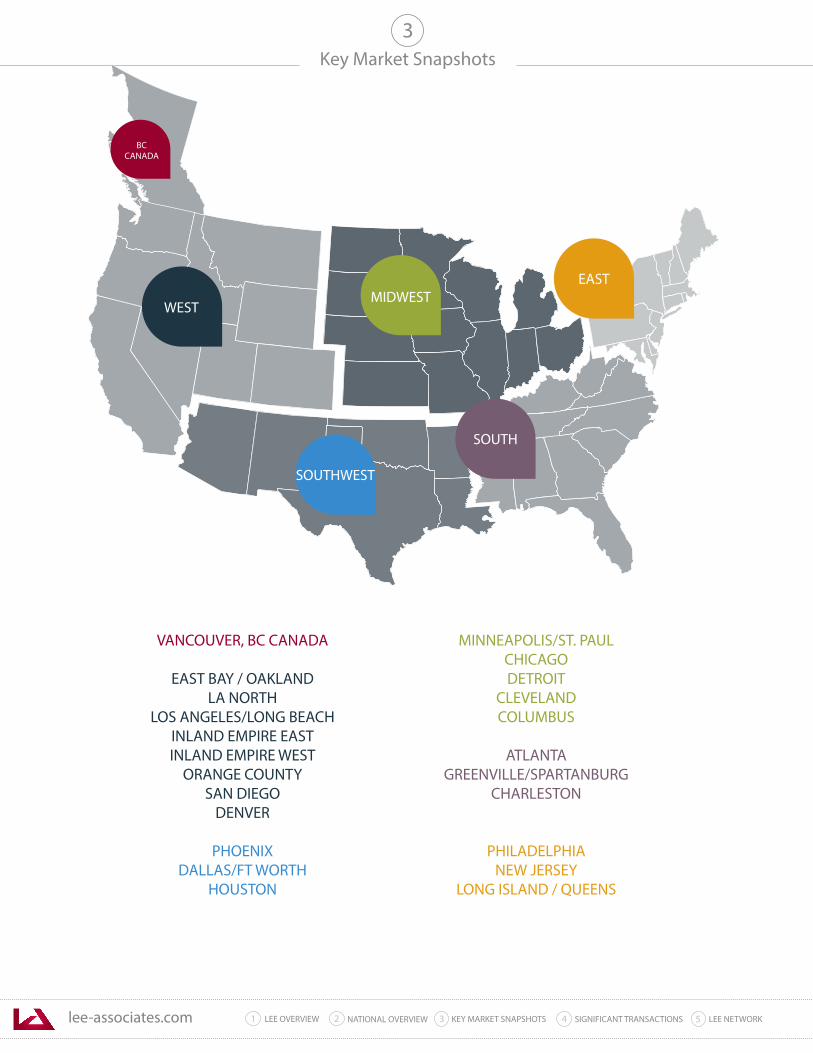
VANCOUVER, BC CANADA
EAST BAY / OAKLANDLA NORTH
LOS ANGELES/LONG BEACHINLAND EMPIRE EASTINLAND EMPIRE WEST
ORANGE COUNTYSAN DIEGO
DENVER
PHOENIXDALLAS/FT WORTH
HOUSTON
MINNEAPOLIS/ST. PAULCHICAGODETROIT
CLEVELANDCOLUMBUS
ATLANTAGREENVILLE/SPARTANBURG
CHARLESTON
PHILADELPHIANEW JERSEY
LONG ISLAND / QUEENS
WESTMIDWEST
SOUTHWEST
EAST
SOUTH

lee-associates.com 31 LEE OVERVIEW KEY MARKET SNAPSHOTS 5 LEE NETWORKNATIONAL OVERVIEW2 4 SIGNIFICANT TRANSACTIONS
Key Market Snapshots
4.0%VACANCY
$10.48AVG. SF RENTAL RATES
2,788,327NET SF ABSORPTION
263,621,305INDUSTRIAL SF INVENTORY
1,987,442SF UNDER CONSTRUCTION
3
0
500,000
1,000,000
1,500,000
2,000,000
2,500,000
3,000,000
3,500,000
2015 Q4
2016 Q1
2016 Q2
2016 Q3
2016 Q4
Squa
re F
eet
728,326
2,482,275
771,459
2,788,327
927,613
4.0%
5.2%
4.9%
3.50%
4.00%
4.50%
5.00%
5.50%
2015 Q4
2015 Q1
2016 Q2
2016 Q3
2016 Q4
4.8%
4.9%
NET SF ABSORPTION
VACANCY RATE
TRENDING NOW
The entire Bay Area enjoyed strong economic growth in 2016, mainly due to the resurgence of the tech and automotive sectors along with strong consumer demand for products and services. Rents in all product types have risen, the housing market is one of the most active in the country and job growth continues to outpace the rate of workforce expansion. The East Bay 880 Corridor, located across the bay from San Francisco and the Silicon Valley, has benefited directly from the tech boom and that has given the industrial market a boost and shifted the balance of supply and demand. Q4 net absorption was sharply higher, vacancy declined substantially and average asking lease rates moved up again. Development of speculative industrial space is ongoing, allowing major users to respond to growth needs more quickly.
Net absorption totaled 2,788,325 square feet, more than the total for the previous three quarters combined. For the year, over 5.2 million square feet of gains in occupied space were recorded. Significant transactions contributing to that strong performance include Tesla’s leases of 635,533 square feet and 367,734 square feet respectively, and a 354,316-square-foot lease to Living Spaces. The market is healthy across the industrial product spectrum, but large distribution deals are dominating in terms of leasing activity.
With such a strong net absorption number in Q4, vacancy moved down by 90 basis points to 4.0%, after two flat quarters. Landlords of available properties, emboldened by the shrinking supply of quality space, continue to push for longer lease terms, stronger credit and fewer concessions.
EAST BAY / OAKLAND
lee-associates.com 31 LEE OVERVIEW KEY MARKET SNAPSHOTS 5 LEE NETWORKNATIONAL OVERVIEW2 4 SIGNIFICANT TRANSACTIONS
• Gross sale and lease activity will be strong through 2017
• Net absorption should remain near current levels due to supply limitations
• Construction activity will continue, but rents will have to move higher to cover higher land and building costs
• Lease rates and sales prices will continue to spike, with many spaces marketed without pricing
• Higher mortgage interest rates could dampen sale demand if the Fed continues to tighten its monetary policy
• Vacancy will move even lower in 2017
Key Market Snapshots
EAST BAY/OAKLAND - TRENDING NOW(continued)
3
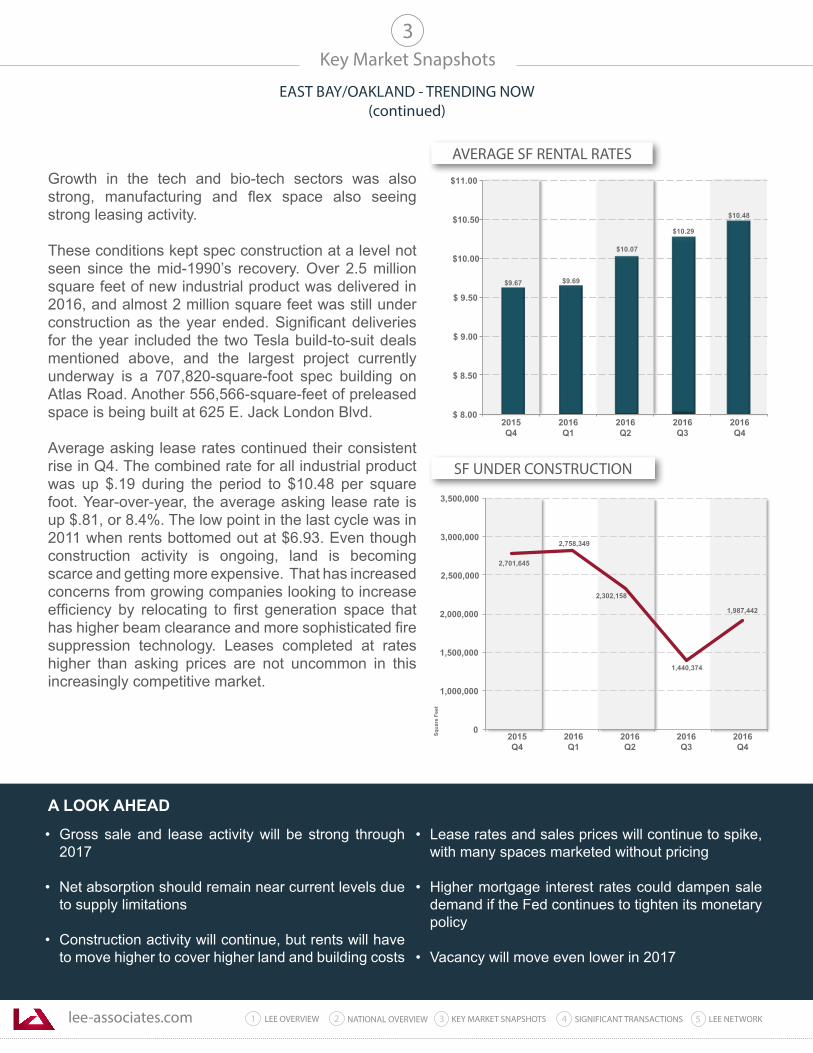
Growth in the tech and bio-tech sectors was also strong, manufacturing and flex space also seeing strong leasing activity.
These conditions kept spec construction at a level not seen since the mid-1990’s recovery. Over 2.5 million square feet of new industrial product was delivered in 2016, and almost 2 million square feet was still under construction as the year ended. Significant deliveries for the year included the two Tesla build-to-suit deals mentioned above, and the largest project currently underway is a 707,820-square-foot spec building on Atlas Road. Another 556,566-square-feet of preleased space is being built at 625 E. Jack London Blvd.
Average asking lease rates continued their consistent rise in Q4. The combined rate for all industrial product was up $.19 during the period to $10.48 per square foot. Year-over-year, the average asking lease rate is up $.81, or 8.4%. The low point in the last cycle was in 2011 when rents bottomed out at $6.93. Even though construction activity is ongoing, land is becoming scarce and getting more expensive. That has increased concerns from growing companies looking to increase efficiency by relocating to first generation space that has higher beam clearance and more sophisticated fire suppression technology. Leases completed at rates higher than asking prices are not uncommon in this increasingly competitive market.
A LOOK AHEAD
$ 8.00
$ 8.50
$ 9.00
$ 9.50
$10.00
$10.50
$11.00
2015 Q4
2016 Q1
2016 Q2
2016 Q3
2016 Q4
$10.29
$10.48
$9.69$9.67
$10.07
1,440,374
1,987,442
2,701,645
2,758,349
0
1,000,000
1,500,000
2,000,000
2,500,000
3,000,000
3,500,000
Squa
re F
eet
2,302,158
2015 Q4
2016 Q1
2016 Q2
2016 Q3
2016Q4
SF UNDER CONSTRUCTION
AVERAGE SF RENTAL RATES
lee-associates.com 31 LEE OVERVIEW KEY MARKET SNAPSHOTS 5 LEE NETWORKNATIONAL OVERVIEW2 4 SIGNIFICANT TRANSACTIONS
Key Market Snapshots
1.7%VACANCY
$9.60AVG. SF RENTAL RATES
217,226NET SF ABSORPTION
117,280,000INDUSTRIAL SF INVENTORY
1,107,823SF UNDER CONSTRUCTION
3
-600,000
-500,000
-300,000
0
100,000
200,000
300,000
400,000
500,000
Squa
re F
eet
2015 Q4
2016 Q1
2016 Q2
2016 Q3
2016 Q4
217,226
460,459
-400,000
(93,198)
(520,369)
483,603
1.8%
2.2% 2.2%
1.00%
1.50%
2.00%
2.50%
3.00%
2015 Q4
2016 Q1
2016 Q2
2016Q3
2016 Q4
1.8% 1.7%
NET SF ABSORPTION
VACANCY RATE
TRENDING NOW
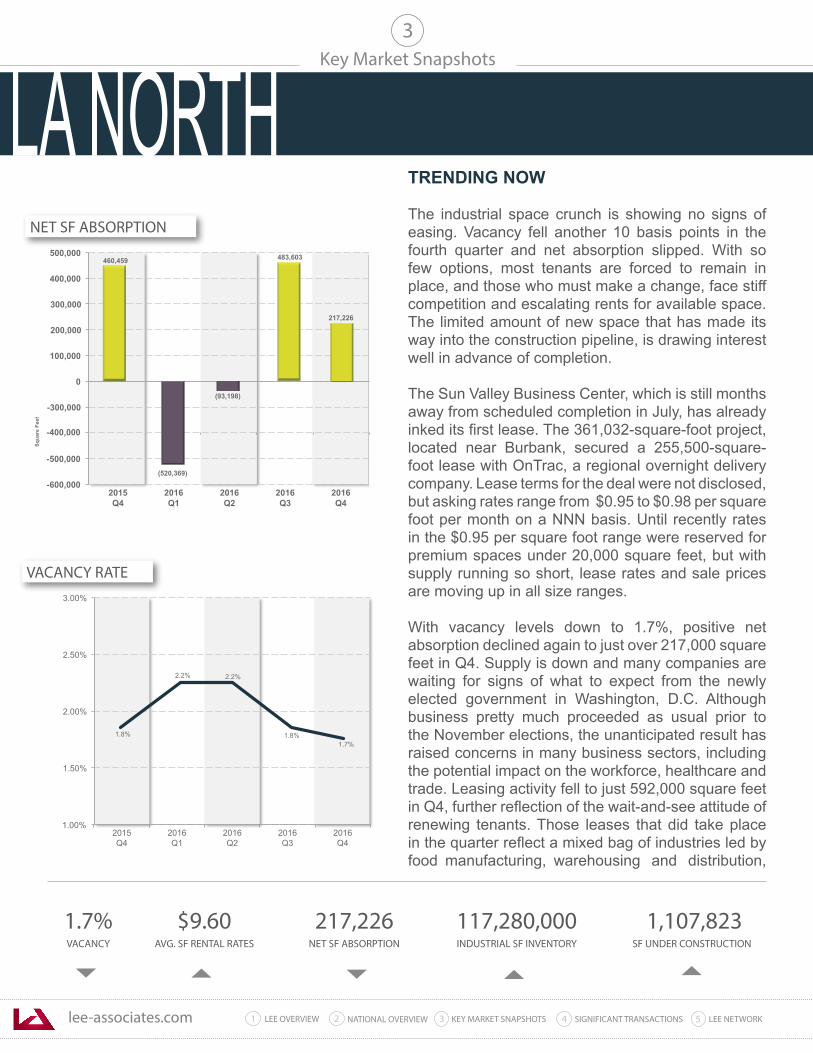
The industrial space crunch is showing no signs of easing. Vacancy fell another 10 basis points in the fourth quarter and net absorption slipped. With so few options, most tenants are forced to remain in place, and those who must make a change, face stiff competition and escalating rents for available space. The limited amount of new space that has made its way into the construction pipeline, is drawing interest well in advance of completion.
The Sun Valley Business Center, which is still months away from scheduled completion in July, has already inked its first lease. The 361,032-square-foot project, located near Burbank, secured a 255,500-square-foot lease with OnTrac, a regional overnight delivery company. Lease terms for the deal were not disclosed, but asking rates range from $0.95 to $0.98 per square foot per month on a NNN basis. Until recently rates in the $0.95 per square foot range were reserved for premium spaces under 20,000 square feet, but with supply running so short, lease rates and sale prices are moving up in all size ranges.
With vacancy levels down to 1.7%, positive net absorption declined again to just over 217,000 square feet in Q4. Supply is down and many companies are waiting for signs of what to expect from the newly elected government in Washington, D.C. Although business pretty much proceeded as usual prior to the November elections, the unanticipated result has raised concerns in many business sectors, including the potential impact on the workforce, healthcare and trade. Leasing activity fell to just 592,000 square feet in Q4, further reflection of the wait-and-see attitude of renewing tenants. Those leases that did take place in the quarter reflect a mixed bag of industries led by food manufacturing, warehousing and distribution,
LA NORTH
lee-associates.com 31 LEE OVERVIEW KEY MARKET SNAPSHOTS 5 LEE NETWORKNATIONAL OVERVIEW2 4 SIGNIFICANT TRANSACTIONS
• Average asking lease rates will likely rise another 10% or more in 2017, driven by strong demand and a limited amount of new construction
• Limited inventory will curtail investment activity and push asking prices even higher
• Expect little change in record-low vacancy rates. New construction will continue to be limited by land availability
• Owner/user demand will remain strong, but occupancy costs will rise as mortgage rates are expected to rise further
• Net absorption and leasing activity will be restrained by the ongoing supply shortage
Key Market Snapshots
LA NORTH - TRENDING NOW(continued)
3
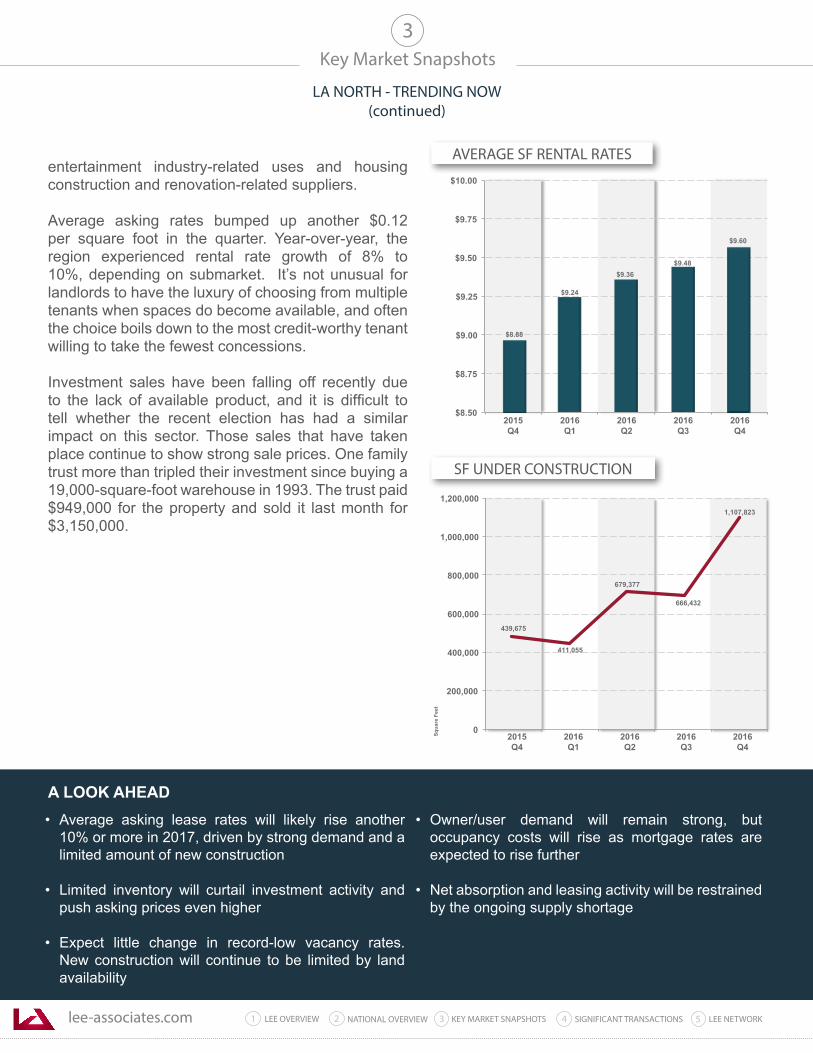
entertainment industry-related uses and housing construction and renovation-related suppliers.
Average asking rates bumped up another $0.12 per square foot in the quarter. Year-over-year, the region experienced rental rate growth of 8% to 10%, depending on submarket. It’s not unusual for landlords to have the luxury of choosing from multiple tenants when spaces do become available, and often the choice boils down to the most credit-worthy tenant willing to take the fewest concessions.
Investment sales have been falling off recently due to the lack of available product, and it is difficult to tell whether the recent election has had a similar impact on this sector. Those sales that have taken place continue to show strong sale prices. One family trust more than tripled their investment since buying a 19,000-square-foot warehouse in 1993. The trust paid $949,000 for the property and sold it last month for $3,150,000.
A LOOK AHEAD
$8.50
$8.75
$9.00
$9.25
$9.50
$9.75
$10.00
2015 Q4
2016 Q1
2016 Q2
2016 Q3
2016 Q4
$8.88
$9.24
$9.48$9.36
$9.60
1,107,823
439,675
411,055
679,377
0
200,000
400,000
600,000
800,000
1,000,000
1,200,000
Squa
re F
eet
666,432
2015 Q4
2016 Q1
2016 Q2
2016 Q3
2016Q4
SF UNDER CONSTRUCTION
AVERAGE SF RENTAL RATES
lee-associates.com 31 LEE OVERVIEW KEY MARKET SNAPSHOTS 5 LEE NETWORKNATIONAL OVERVIEW2 4 SIGNIFICANT TRANSACTIONS
Key Market Snapshots
1.1%VACANCY
$9.72AVG. SF RENTAL RATES
819,013NET SF ABSORPTION
207,269,462INDUSTRIAL SF INVENTORY
1,006,192SF UNDER CONSTRUCTION
3
-500,000
-300,000
0
100,000
300,000
500,000
700,000
900,000
1,100,000
Squa
re F
eet
2015 Q4
2016 Q1
2016 Q2
2016 Q3
2016 Q4
-388,320
682,639
-100,000
243,408 165,476
819,013
1.1%
0.9%
0.8%
0.50%
0.70%
0.90%
1.10%
1.30%
2015 Q4
2015 Q1
2016 Q2
2016 Q3
2016 Q4
0.7%
0.9%
NET SF ABSORPTION
VACANCY RATE
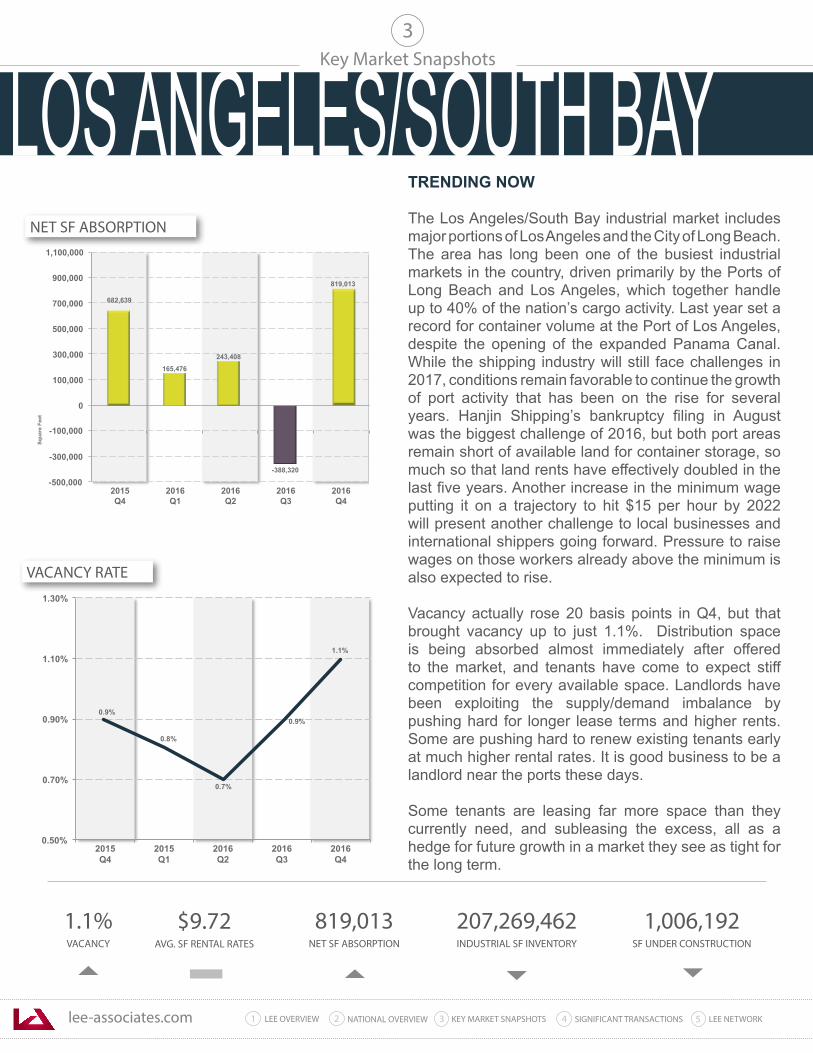
TRENDING NOW The Los Angeles/South Bay industrial market includes major portions of Los Angeles and the City of Long Beach. The area has long been one of the busiest industrial markets in the country, driven primarily by the Ports of Long Beach and Los Angeles, which together handle up to 40% of the nation’s cargo activity. Last year set a record for container volume at the Port of Los Angeles, despite the opening of the expanded Panama Canal. While the shipping industry will still face challenges in 2017, conditions remain favorable to continue the growth of port activity that has been on the rise for several years. Hanjin Shipping’s bankruptcy filing in August was the biggest challenge of 2016, but both port areas remain short of available land for container storage, so much so that land rents have effectively doubled in the last five years. Another increase in the minimum wage putting it on a trajectory to hit $15 per hour by 2022 will present another challenge to local businesses and international shippers going forward. Pressure to raise wages on those workers already above the minimum is also expected to rise. Vacancy actually rose 20 basis points in Q4, but that brought vacancy up to just 1.1%. Distribution space is being absorbed almost immediately after offered to the market, and tenants have come to expect stiff competition for every available space. Landlords have been exploiting the supply/demand imbalance by pushing hard for longer lease terms and higher rents. Some are pushing hard to renew existing tenants early at much higher rental rates. It is good business to be a landlord near the ports these days.
Some tenants are leasing far more space than they currently need, and subleasing the excess, all as a hedge for future growth in a market they see as tight for the long term.
LOS ANGELES/SOUTH BAY
lee-associates.com 31 LEE OVERVIEW KEY MARKET SNAPSHOTS 5 LEE NETWORKNATIONAL OVERVIEW2 4 SIGNIFICANT TRANSACTIONS
• Overall market activity will be limited by short supply
• Vacancy will stay in the 1% range throughout 2017
• Tenants will be forced to renew existing leases at much higher rates throughout 2017
• Lease rates will keep moving higher
• Average asking sale prices for limited amount of new product will exceed $200 psf
• As rents rise further, developers will be able to demolish functionally obsolete buildings and build new project
Key Market Snapshots
LOS ANGELES/SOUTH BAY - TRENDING NOW(continued)
3
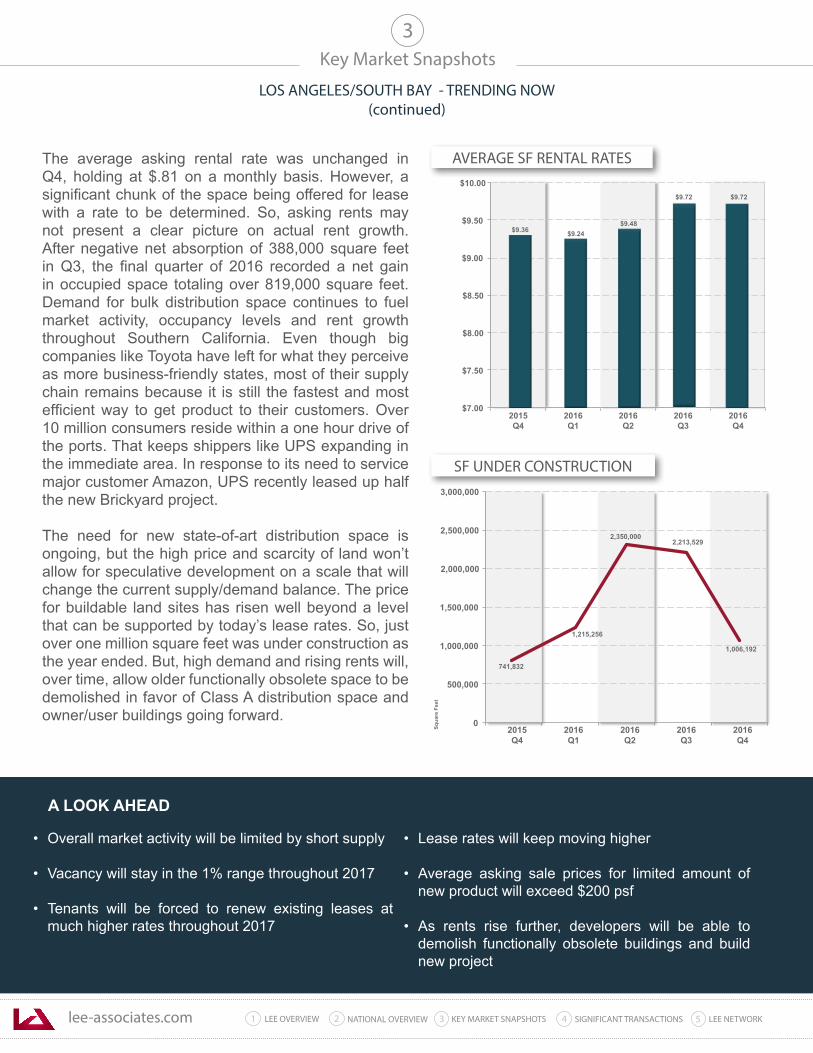
The average asking rental rate was unchanged in Q4, holding at $.81 on a monthly basis. However, a significant chunk of the space being offered for lease with a rate to be determined. So, asking rents may not present a clear picture on actual rent growth. After negative net absorption of 388,000 square feet in Q3, the final quarter of 2016 recorded a net gain in occupied space totaling over 819,000 square feet. Demand for bulk distribution space continues to fuel market activity, occupancy levels and rent growth throughout Southern California. Even though big companies like Toyota have left for what they perceive as more business-friendly states, most of their supply chain remains because it is still the fastest and most efficient way to get product to their customers. Over 10 million consumers reside within a one hour drive of the ports. That keeps shippers like UPS expanding in the immediate area. In response to its need to service major customer Amazon, UPS recently leased up half the new Brickyard project. The need for new state-of-art distribution space is ongoing, but the high price and scarcity of land won’t allow for speculative development on a scale that will change the current supply/demand balance. The price for buildable land sites has risen well beyond a level that can be supported by today’s lease rates. So, just over one million square feet was under construction as the year ended. But, high demand and rising rents will, over time, allow older functionally obsolete space to be demolished in favor of Class A distribution space and owner/user buildings going forward.
A LOOK AHEAD
$7.00
$7.50
$8.00
$8.50
$9.00
$9.50
$10.00
2015 Q4
2016 Q1
2016 Q2
2016 Q3
2016 Q4
$9.72 $9.72
$9.24$9.36$9.48
2,213,529
1,006,192
741,832
1,215,256
0
500,000
1,000,000
1,500,000
2,000,000
2,500,000
3,000,000
Squa
re F
eet
2,350,000
2015 Q4
2016 Q1
2016 Q2
2016 Q3
2016Q4
SF UNDER CONSTRUCTION
AVERAGE SF RENTAL RATES
lee-associates.com 31 LEE OVERVIEW KEY MARKET SNAPSHOTS 5 LEE NETWORKNATIONAL OVERVIEW2 4 SIGNIFICANT TRANSACTIONS
Key Market Snapshots
5.37%VACANCY
$7.21AVG. SF RENTAL RATES
4,456,904GROSS SF ABSORPTION
194,990,078INDUSTRIAL SF INVENTORY
11,860,821SF UNDER CONSTRUCTION
3
0
1,500,000
2,500,000
3,500,000
4,500,000
5,500,000
6,500,000
2016 Q4
2015 Q4
2016 Q1
2016 Q2
2016 Q3
Squa
re F
eet
6,133,982
3,662,928
4,456,904
4,875,783 5,061,834
6.32%
5.37%
5.09%
4.90%
4.50%
5.00%
5.50%
6.00%
6.50%
2015 Q4
2016 Q1
2016 Q2
2016 Q3
2016 Q4
5.26%
GROSS SF ABSORPTION
VACANCY RATE
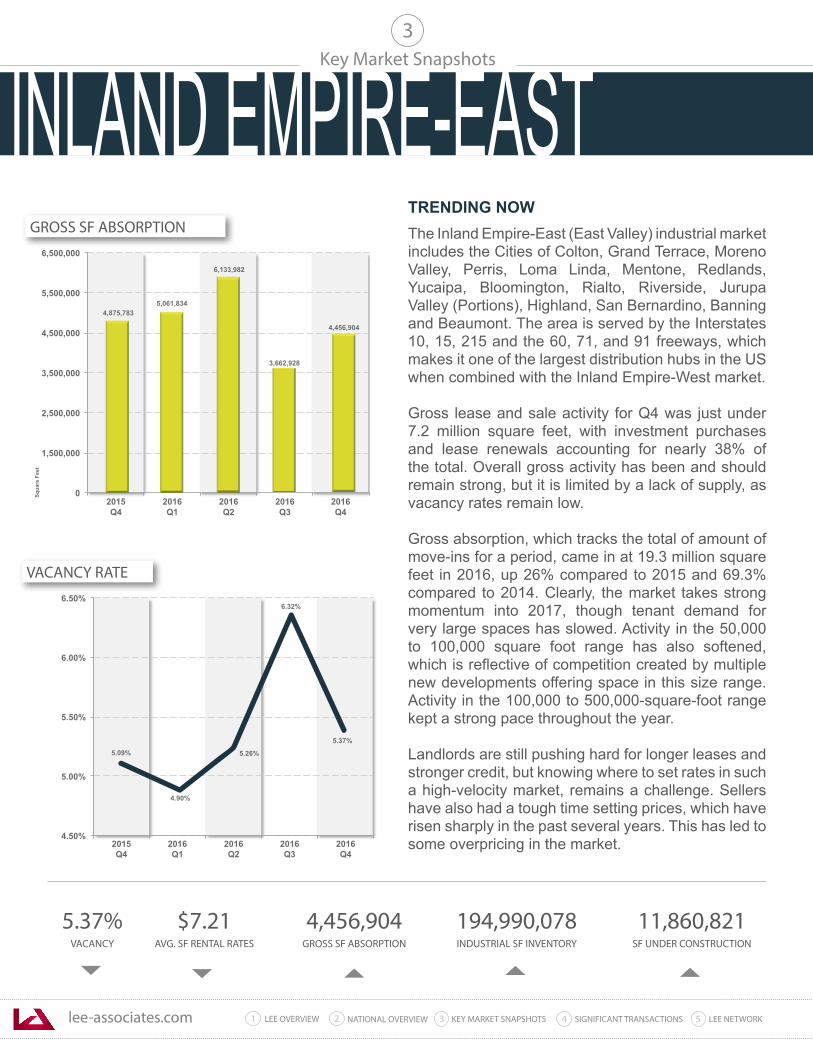
TRENDING NOW The Inland Empire-East (East Valley) industrial market includes the Cities of Colton, Grand Terrace, Moreno Valley, Perris, Loma Linda, Mentone, Redlands, Yucaipa, Bloomington, Rialto, Riverside, Jurupa Valley (Portions), Highland, San Bernardino, Banning and Beaumont. The area is served by the Interstates 10, 15, 215 and the 60, 71, and 91 freeways, which makes it one of the largest distribution hubs in the US when combined with the Inland Empire-West market. Gross lease and sale activity for Q4 was just under 7.2 million square feet, with investment purchases and lease renewals accounting for nearly 38% of the total. Overall gross activity has been and should remain strong, but it is limited by a lack of supply, as vacancy rates remain low.
Gross absorption, which tracks the total of amount of move-ins for a period, came in at 19.3 million square feet in 2016, up 26% compared to 2015 and 69.3% compared to 2014. Clearly, the market takes strong momentum into 2017, though tenant demand for very large spaces has slowed. Activity in the 50,000 to 100,000 square foot range has also softened, which is reflective of competition created by multiple new developments offering space in this size range. Activity in the 100,000 to 500,000-square-foot range kept a strong pace throughout the year.
Landlords are still pushing hard for longer leases and stronger credit, but knowing where to set rates in such a high-velocity market, remains a challenge. Sellers have also had a tough time setting prices, which have risen sharply in the past several years. This has led to some overpricing in the market.
INLAND EMPIRE-EAST
lee-associates.com 31 LEE OVERVIEW KEY MARKET SNAPSHOTS 5 LEE NETWORKNATIONAL OVERVIEW2 4 SIGNIFICANT TRANSACTIONS
• Overall gross activity should carry current momentum into next year
• Vacancy will remain near current levels due to steady flow of new deliveries
• Sales prices for owner/user buildings may soften if interest rates keep moving up
• Lease rates will keep moving up, especially for quality spaces pursued by multiple tenants
• Construction activity will stay on current pace in
2017
• Net absorption will remain positive, but may moderate due to tightening supply
Key Market Snapshots
INLAND EMPIRE (EAST) - TRENDING NOW(continued)
3
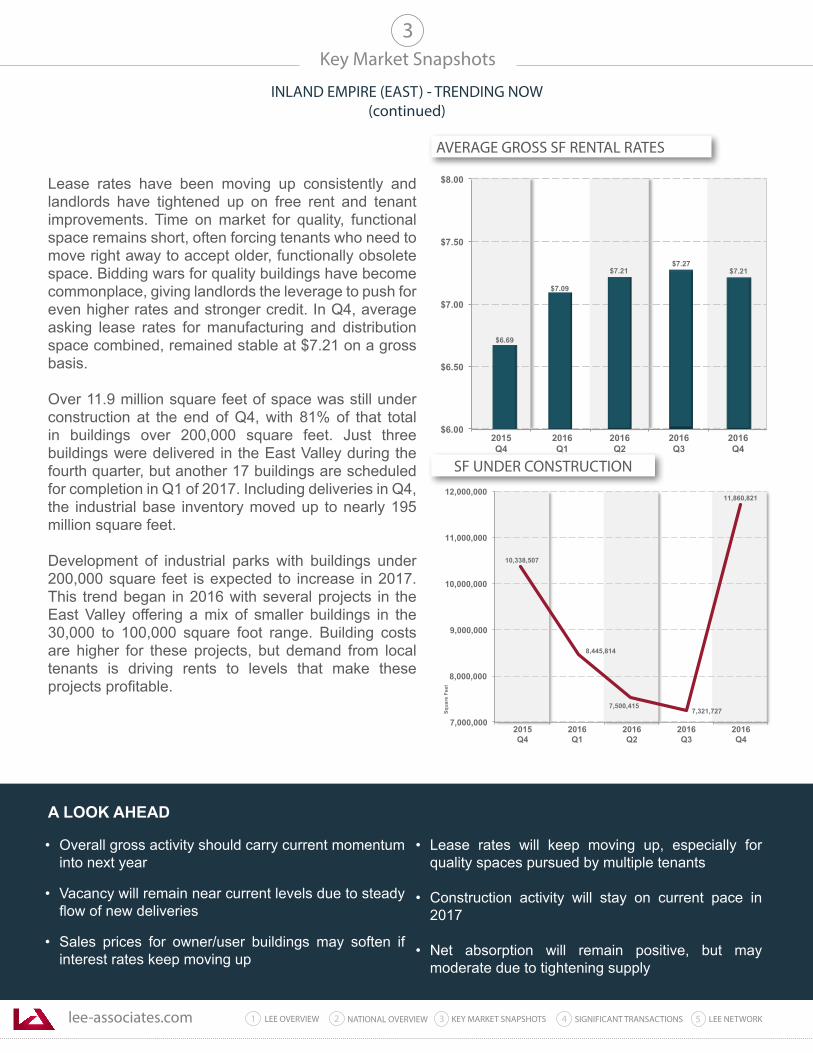
Lease rates have been moving up consistently and landlords have tightened up on free rent and tenant improvements. Time on market for quality, functional space remains short, often forcing tenants who need to move right away to accept older, functionally obsolete space. Bidding wars for quality buildings have become commonplace, giving landlords the leverage to push for even higher rates and stronger credit. In Q4, average asking lease rates for manufacturing and distribution space combined, remained stable at $7.21 on a gross basis.
Over 11.9 million square feet of space was still under construction at the end of Q4, with 81% of that total in buildings over 200,000 square feet. Just three buildings were delivered in the East Valley during the fourth quarter, but another 17 buildings are scheduled for completion in Q1 of 2017. Including deliveries in Q4, the industrial base inventory moved up to nearly 195 million square feet.
Development of industrial parks with buildings under 200,000 square feet is expected to increase in 2017. This trend began in 2016 with several projects in the East Valley offering a mix of smaller buildings in the 30,000 to 100,000 square foot range. Building costs are higher for these projects, but demand from local tenants is driving rents to levels that make these projects profitable.
A LOOK AHEAD
$6.00
$6.50
$7.00
$7.50
$8.00
2015 Q4
2016 Q1
2016 Q2
2016 Q3
2016Q4
$7.27$7.21
$6.69
$7.09
$7.21
7,321,727
11,860,821
10,338,507
8,445,814
7,000,000
8,000,000
9,000,000
10,000,000
11,000,000
12,000,000
Squa
re F
eet
7,500,415
2015 Q4
2016 Q1
2016 Q2
2016 Q3
2016 Q4
SF UNDER CONSTRUCTION
AVERAGE GROSS SF RENTAL RATES
lee-associates.com 31 LEE OVERVIEW KEY MARKET SNAPSHOTS 5 LEE NETWORKNATIONAL OVERVIEW2 4 SIGNIFICANT TRANSACTIONS
Key Market Snapshots
1.74%VACANCY
$7.06AVG. SF NNN RENTAL
300,521,411INDUSTRIAL SF INVENTORY
12,055,505SF UNDER CONSTRUCTION
3
0
2,000,000
4,000,000
6,000,000
8,000,000
10,000,000
12,000,000
2016 Q4
2015 Q4
2016 Q1
2016 Q2
2016 Q3
Squa
re F
eet
8,567,635 8,181,168
9,756,473
11,482,780 11,766,159
1.80%
1.74%
1.56%
1.73%
1.00%
1.25%
1.50%
1.75%
2.00%
2015 Q4
2016 Q1
2016 Q2
2016 Q3
2016 Q4
1.32%
GROSS SF ABSORPTION
VACANCY RATE
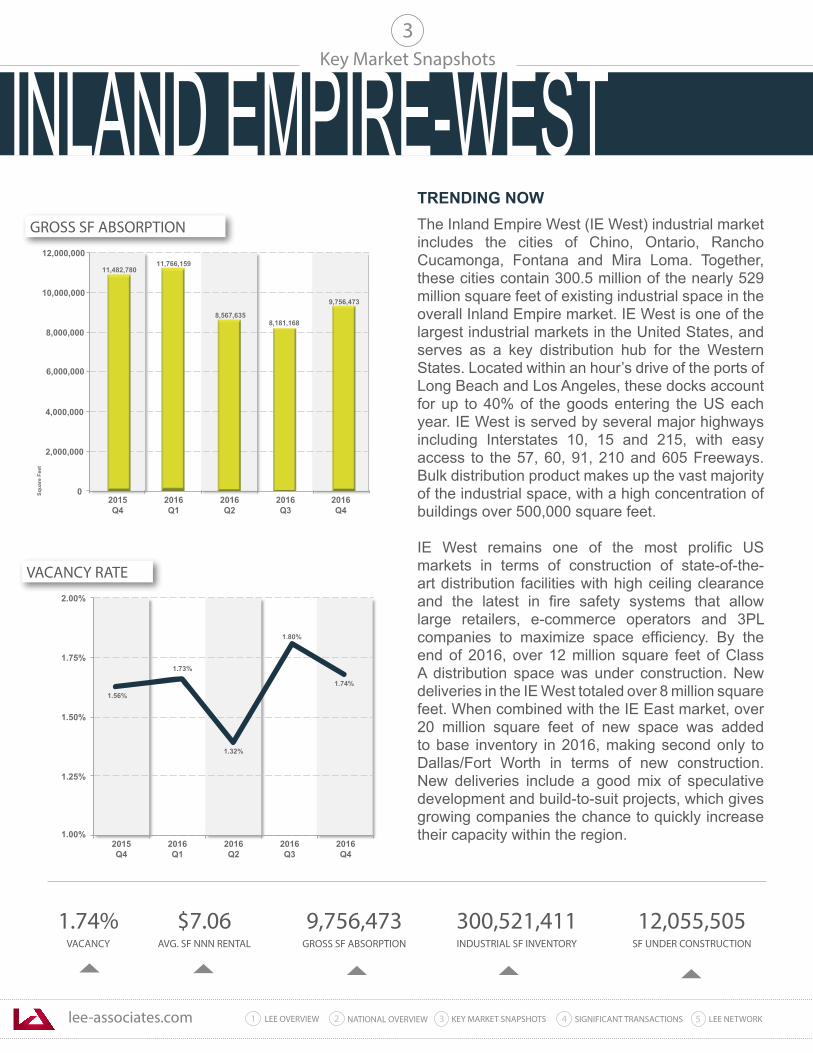
TRENDING NOW The Inland Empire West (IE West) industrial market includes the cities of Chino, Ontario, Rancho Cucamonga, Fontana and Mira Loma. Together, these cities contain 300.5 million of the nearly 529 million square feet of existing industrial space in the overall Inland Empire market. IE West is one of the largest industrial markets in the United States, and serves as a key distribution hub for the Western States. Located within an hour’s drive of the ports of Long Beach and Los Angeles, these docks account for up to 40% of the goods entering the US each year. IE West is served by several major highways including Interstates 10, 15 and 215, with easy access to the 57, 60, 91, 210 and 605 Freeways. Bulk distribution product makes up the vast majority of the industrial space, with a high concentration of buildings over 500,000 square feet.
IE West remains one of the most prolific US markets in terms of construction of state-of-the-art distribution facilities with high ceiling clearance and the latest in fire safety systems that allow large retailers, e-commerce operators and 3PL companies to maximize space efficiency. By the end of 2016, over 12 million square feet of Class A distribution space was under construction. New deliveries in the IE West totaled over 8 million square feet. When combined with the IE East market, over 20 million square feet of new space was added to base inventory in 2016, making second only to Dallas/Fort Worth in terms of new construction. New deliveries include a good mix of speculative development and build-to-suit projects, which gives growing companies the chance to quickly increase their capacity within the region.
9,756,473GROSS SF ABSORPTION
INLAND EMPIRE-WEST
lee-associates.com 31 LEE OVERVIEW KEY MARKET SNAPSHOTS 5 LEE NETWORKNATIONAL OVERVIEW2 4 SIGNIFICANT TRANSACTIONS
• Overall gross leasing activity should remain strong as tenants chase limited inventory
• Overall rent growth will be in the 4% to 5% range for the year
• Net absorption will stay strong as long as enough new space is delivered to accommodate further expansion
• Possible change in international trade policy is a “wild card” issue for 2017
• Vacancy could move slightly higher because more
of construction pipeline will be speculative space
• Construction activity should run near current levels in 2017
Key Market Snapshots
INLAND EMPIRE (WEST) - TRENDING NOW(continued)
3
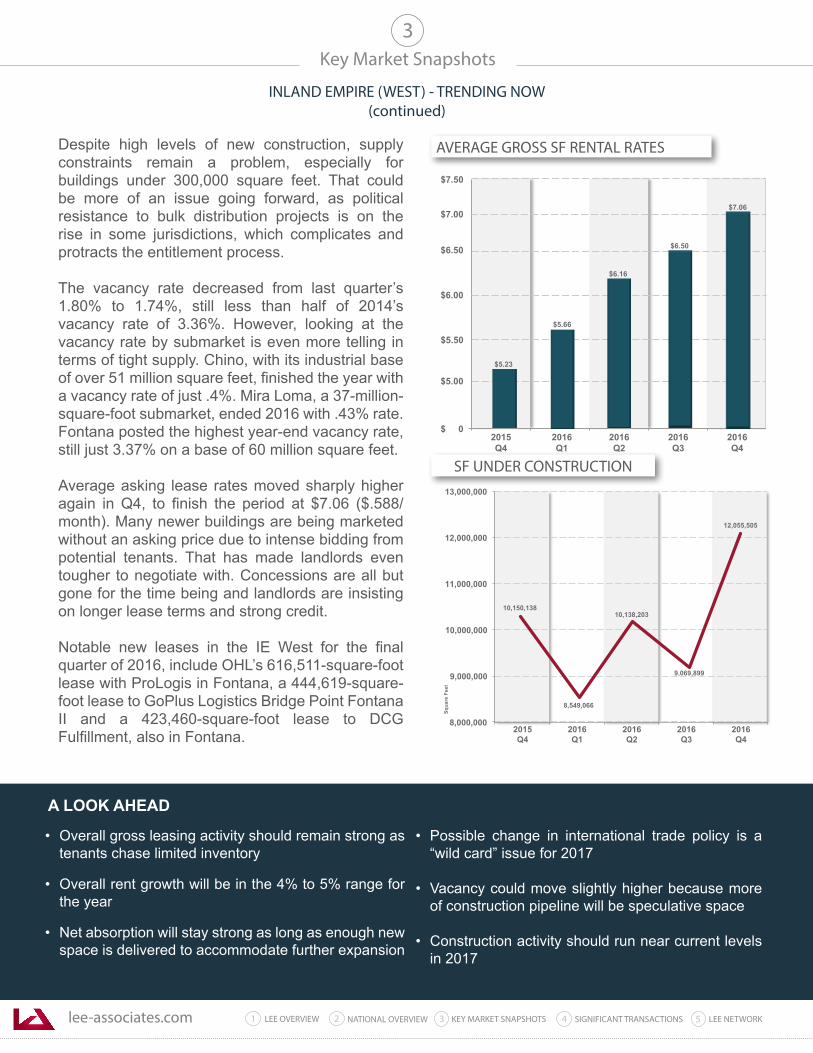
Despite high levels of new construction, supply constraints remain a problem, especially for buildings under 300,000 square feet. That could be more of an issue going forward, as political resistance to bulk distribution projects is on the rise in some jurisdictions, which complicates and protracts the entitlement process.
The vacancy rate decreased from last quarter’s 1.80% to 1.74%, still less than half of 2014’s vacancy rate of 3.36%. However, looking at the vacancy rate by submarket is even more telling in terms of tight supply. Chino, with its industrial base of over 51 million square feet, finished the year with a vacancy rate of just .4%. Mira Loma, a 37-million-square-foot submarket, ended 2016 with .43% rate. Fontana posted the highest year-end vacancy rate, still just 3.37% on a base of 60 million square feet.
Average asking lease rates moved sharply higher again in Q4, to finish the period at $7.06 ($.588/month). Many newer buildings are being marketed without an asking price due to intense bidding from potential tenants. That has made landlords even tougher to negotiate with. Concessions are all but gone for the time being and landlords are insisting on longer lease terms and strong credit.
Notable new leases in the IE West for the final quarter of 2016, include OHL’s 616,511-square-foot lease with ProLogis in Fontana, a 444,619-square-foot lease to GoPlus Logistics Bridge Point Fontana II and a 423,460-square-foot lease to DCG Fulfillment, also in Fontana.
A LOOK AHEAD
$ 0
$5.00
$6.00
$6.50
$7.00
2015 Q4
2016 Q1
2016 Q2
2016 Q3
2016Q4
$6.50
$7.06
$5.23
$5.66
$6.16
$5.50
$7.50
9,069,899
12,055,505
10,150,138
8,549,066
8,000,000
9,000,000
10,000,000
11,000,000
12,000,000
13,000,000
Squa
re F
eet
10,138,203
2015 Q4
2016 Q1
2016 Q2
2016 Q3
2016 Q4
SF UNDER CONSTRUCTION
AVERAGE GROSS SF RENTAL RATES
lee-associates.com 31 LEE OVERVIEW KEY MARKET SNAPSHOTS 5 LEE NETWORKNATIONAL OVERVIEW2 4 SIGNIFICANT TRANSACTIONS
Key Market Snapshots3
NET SF ABSORPTION
VACANCY RATE
2.4%VACANCY
$10.44AVG. SF RENTAL RATES
631,549NET SF ABSORPTION
278,179,501INDUSTRIAL SF INVENTORY
274,187SF UNDER CONSTRUCTION
-700,000
-500,000
-100,000
0
100,000
300,000
500,000
700,000
900,000
Squa
re F
eet
2015 Q4
2016 Q1
2016 Q2
2016 Q3
2016 Q4
631,549 659,483
-300,000 (158,980)
(213,946)
701,391
2.8% 2.9%
3.0%
1.50%
2.00%
2.50%
3.00%
3.50%
2015 Q4
2016 Q1
2016 Q2
2016Q3
2016 Q4
2.6%
2.4%
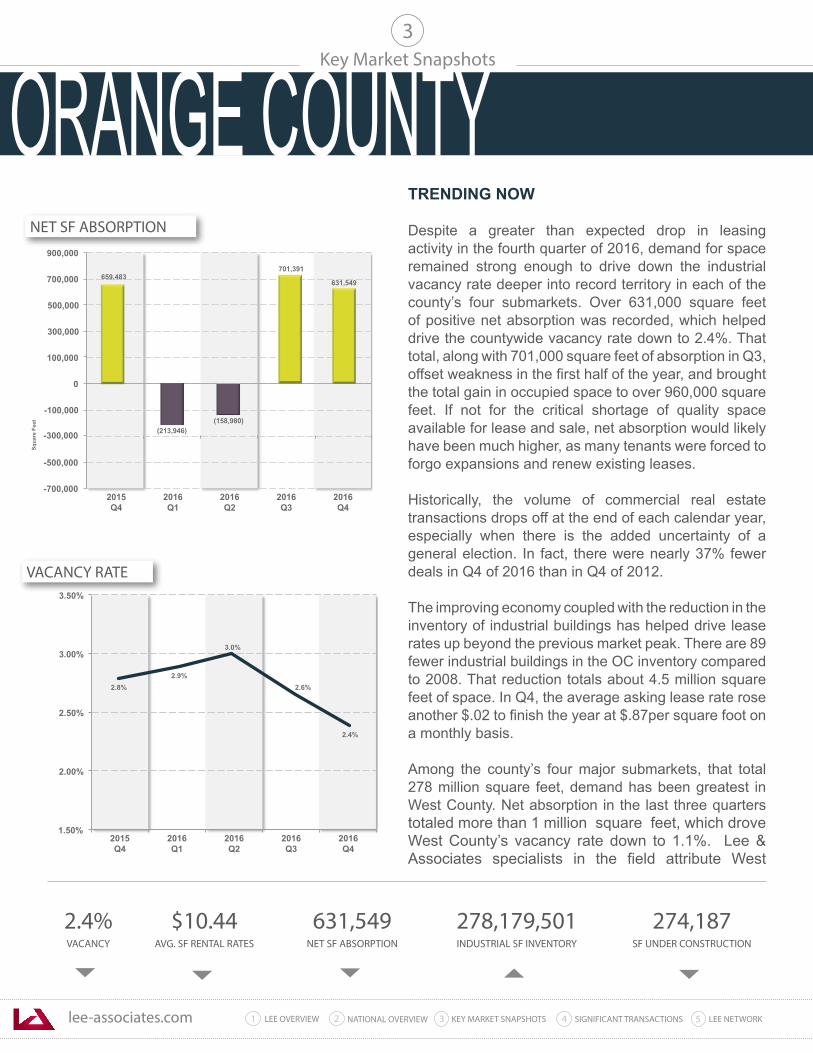
TRENDING NOW Despite a greater than expected drop in leasing activity in the fourth quarter of 2016, demand for space remained strong enough to drive down the industrial vacancy rate deeper into record territory in each of the county’s four submarkets. Over 631,000 square feet of positive net absorption was recorded, which helped drive the countywide vacancy rate down to 2.4%. That total, along with 701,000 square feet of absorption in Q3, offset weakness in the first half of the year, and brought the total gain in occupied space to over 960,000 square feet. If not for the critical shortage of quality space available for lease and sale, net absorption would likely have been much higher, as many tenants were forced to forgo expansions and renew existing leases.
Historically, the volume of commercial real estate transactions drops off at the end of each calendar year, especially when there is the added uncertainty of a general election. In fact, there were nearly 37% fewer deals in Q4 of 2016 than in Q4 of 2012.
The improving economy coupled with the reduction in the inventory of industrial buildings has helped drive lease rates up beyond the previous market peak. There are 89 fewer industrial buildings in the OC inventory compared to 2008. That reduction totals about 4.5 million square feet of space. In Q4, the average asking lease rate rose another $.02 to finish the year at $.87per square foot on a monthly basis.
Among the county’s four major submarkets, that total 278 million square feet, demand has been greatest in West County. Net absorption in the last three quarters totaled more than 1 million square feet, which drove West County’s vacancy rate down to 1.1%. Lee & Associates specialists in the field attribute West
ORANGE COUNTY
lee-associates.com 31 LEE OVERVIEW KEY MARKET SNAPSHOTS 5 LEE NETWORKNATIONAL OVERVIEW2 4 SIGNIFICANT TRANSACTIONS
• Transaction activity will continue to be restricted by a critical shortage of good functional space
• Net absorption will remain in positive territory, but will moderate further due to short supply
• Average asking lease rates will keep moving up at the
current pace
• Sales prices will keep moving up, but at a more modest pace due to higher interest rates for SBA financing
• Construction will be limited due to the scarcity and high cost of land
• More tenants will be renewing existing leases early
due to ongoing supply constraints
Key Market SnapshotsORANGE COUNTY - TRENDING NOW
(continued)
3
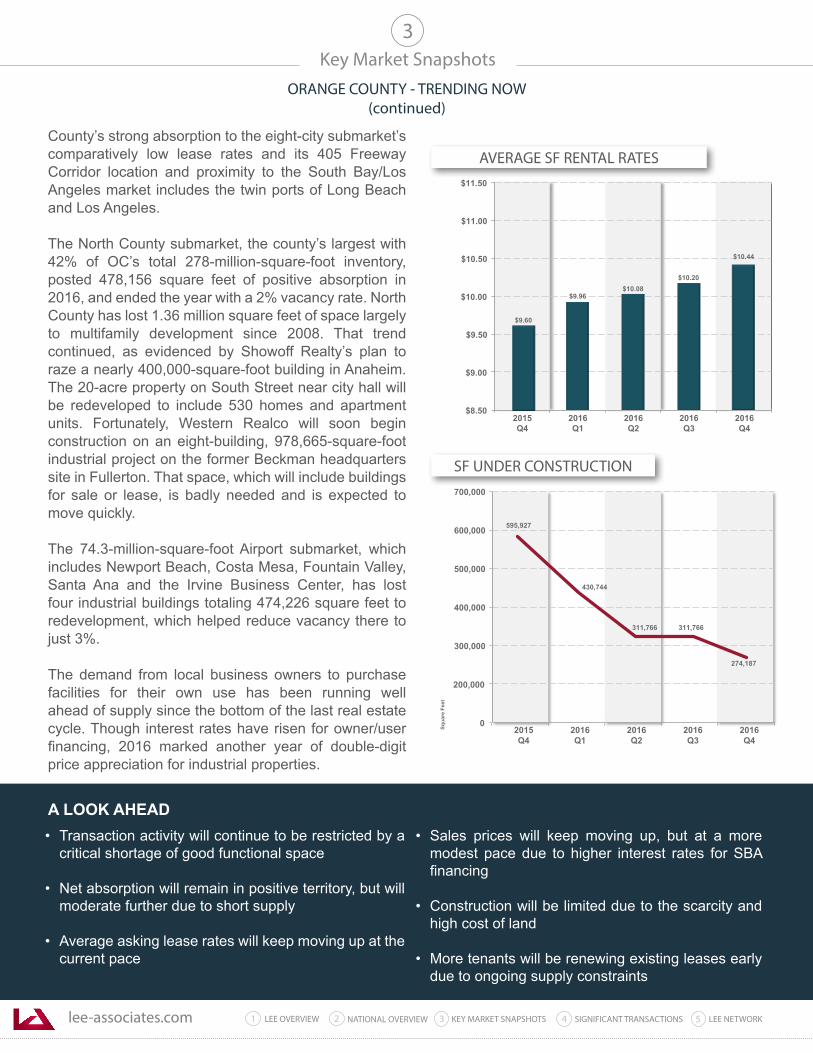
County’s strong absorption to the eight-city submarket’s comparatively low lease rates and its 405 Freeway Corridor location and proximity to the South Bay/Los Angeles market includes the twin ports of Long Beach and Los Angeles.
The North County submarket, the county’s largest with 42% of OC’s total 278-million-square-foot inventory, posted 478,156 square feet of positive absorption in 2016, and ended the year with a 2% vacancy rate. North County has lost 1.36 million square feet of space largely to multifamily development since 2008. That trend continued, as evidenced by Showoff Realty’s plan to raze a nearly 400,000-square-foot building in Anaheim. The 20-acre property on South Street near city hall will be redeveloped to include 530 homes and apartment units. Fortunately, Western Realco will soon begin construction on an eight-building, 978,665-square-foot industrial project on the former Beckman headquarters site in Fullerton. That space, which will include buildings for sale or lease, is badly needed and is expected to move quickly.
The 74.3-million-square-foot Airport submarket, which includes Newport Beach, Costa Mesa, Fountain Valley, Santa Ana and the Irvine Business Center, has lost four industrial buildings totaling 474,226 square feet to redevelopment, which helped reduce vacancy there to just 3%.
The demand from local business owners to purchase facilities for their own use has been running well ahead of supply since the bottom of the last real estate cycle. Though interest rates have risen for owner/user financing, 2016 marked another year of double-digit price appreciation for industrial properties.
A LOOK AHEAD
SF UNDER CONSTRUCTION
AVERAGE SF RENTAL RATES
$8.50
$9.00
$9.50
$10.00
$10.50
$11.00
$11.50
2015 Q4
2016 Q1
2016 Q2
2016 Q3
2016 Q4
$9.60
$9.96
$10.20$10.08
$10.44
274,187
595,927
430,744
311,766
0
200,000
300,000
400,000
500,000
600,000
700,000
Squa
re F
eet
311,766
2015 Q4
2016 Q1
2016 Q2
2016 Q3
2016Q4
lee-associates.com 31 LEE OVERVIEW KEY MARKET SNAPSHOTS 5 LEE NETWORKNATIONAL OVERVIEW2 4 SIGNIFICANT TRANSACTIONS
Key Market Snapshots3
NET SF ABSORPTION
VACANCY RATE
5.10%VACANCY
$12.35AVG. SF RENTAL RATES
748,294NET SF ABSORPTION
189,860,756INDUSTRIAL SF INVENTORY
1,161,242SF UNDER CONSTRUCTION
-600,000
-400,000
0
200,000
400,000
600,000
800,000
1,000,000
1,200,000
Squa
re F
eet
2015 Q4
2016 Q1
2016 Q2
2016 Q3
2016 Q4
(65,749)
272,397
-200,000
1,071,188
(52,111)
748,294
5.1%
5.4%
5.7%
4.50%
5.00%
5.50%
6.00%
6.50%
2015 Q4
2015 Q1
2016 Q2
2016 Q3
2016 Q4
5.7%
5.2%
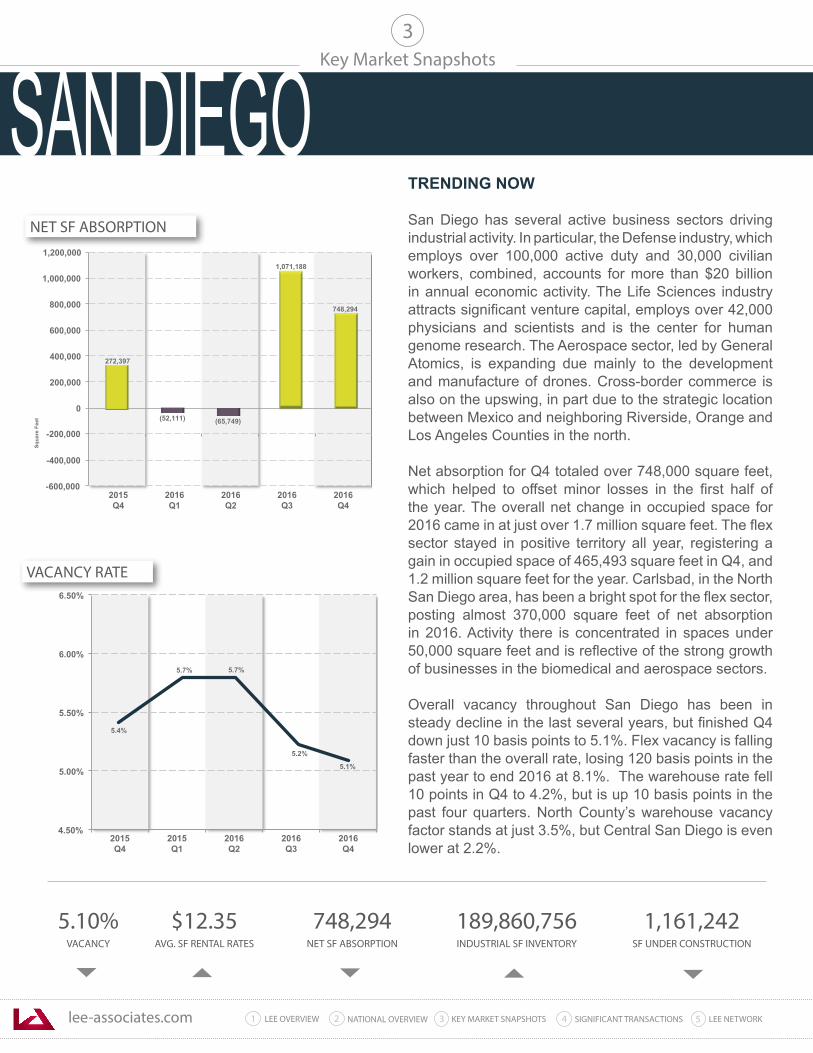
TRENDING NOW San Diego has several active business sectors driving industrial activity. In particular, the Defense industry, which employs over 100,000 active duty and 30,000 civilian workers, combined, accounts for more than $20 billion in annual economic activity. The Life Sciences industry attracts significant venture capital, employs over 42,000 physicians and scientists and is the center for human genome research. The Aerospace sector, led by General Atomics, is expanding due mainly to the development and manufacture of drones. Cross-border commerce is also on the upswing, in part due to the strategic location between Mexico and neighboring Riverside, Orange and Los Angeles Counties in the north. Net absorption for Q4 totaled over 748,000 square feet, which helped to offset minor losses in the first half of the year. The overall net change in occupied space for 2016 came in at just over 1.7 million square feet. The flex sector stayed in positive territory all year, registering a gain in occupied space of 465,493 square feet in Q4, and 1.2 million square feet for the year. Carlsbad, in the North San Diego area, has been a bright spot for the flex sector, posting almost 370,000 square feet of net absorption in 2016. Activity there is concentrated in spaces under 50,000 square feet and is reflective of the strong growth of businesses in the biomedical and aerospace sectors.
Overall vacancy throughout San Diego has been in steady decline in the last several years, but finished Q4 down just 10 basis points to 5.1%. Flex vacancy is falling faster than the overall rate, losing 120 basis points in the past year to end 2016 at 8.1%. The warehouse rate fell 10 points in Q4 to 4.2%, but is up 10 basis points in the past four quarters. North County’s warehouse vacancy factor stands at just 3.5%, but Central San Diego is even lower at 2.2%.
SAN DIEGO
lee-associates.com 31 LEE OVERVIEW KEY MARKET SNAPSHOTS 5 LEE NETWORKNATIONAL OVERVIEW2 4 SIGNIFICANT TRANSACTIONS
• Lease rates should move up another 5% to 10% in 2017
• Net absorption will remain positive in 2017, but will be slowed by limited availability
• It is too early to tell what impact the marijuana industry
will have on industrial activity, as the law will not be fully implemented until 2018
• Biotech expansion will continue to drive activity in the flex sector
• Owner/user prices could be topping out, especially if mortgage rates move even higher
• Construction will continue at a moderate pace,
limited by the scarcity and high cost of land
Key Market SnapshotsSAN DIEGO - TRENDING NOW
(continued)
3
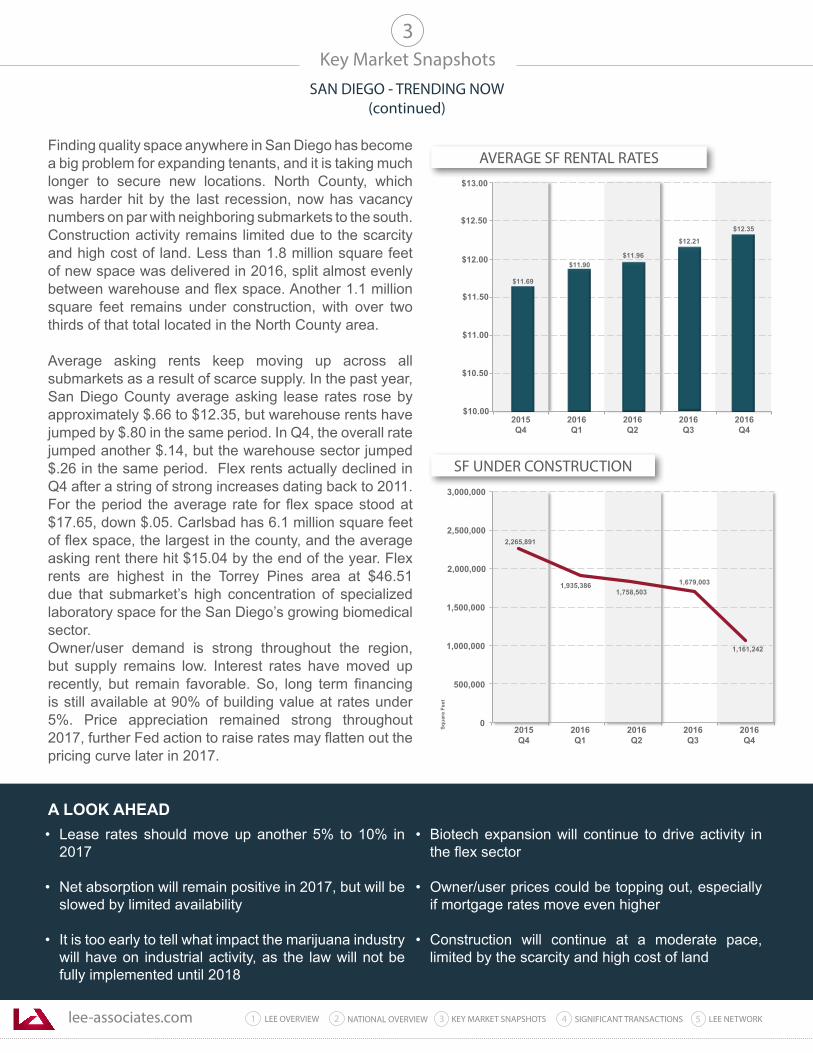
Finding quality space anywhere in San Diego has become a big problem for expanding tenants, and it is taking much longer to secure new locations. North County, which was harder hit by the last recession, now has vacancy numbers on par with neighboring submarkets to the south. Construction activity remains limited due to the scarcity and high cost of land. Less than 1.8 million square feet of new space was delivered in 2016, split almost evenly between warehouse and flex space. Another 1.1 million square feet remains under construction, with over two thirds of that total located in the North County area.
Average asking rents keep moving up across all submarkets as a result of scarce supply. In the past year, San Diego County average asking lease rates rose by approximately $.66 to $12.35, but warehouse rents have jumped by $.80 in the same period. In Q4, the overall rate jumped another $.14, but the warehouse sector jumped $.26 in the same period. Flex rents actually declined in Q4 after a string of strong increases dating back to 2011. For the period the average rate for flex space stood at $17.65, down $.05. Carlsbad has 6.1 million square feet of flex space, the largest in the county, and the average asking rent there hit $15.04 by the end of the year. Flex rents are highest in the Torrey Pines area at $46.51 due that submarket’s high concentration of specialized laboratory space for the San Diego’s growing biomedical sector. Owner/user demand is strong throughout the region, but supply remains low. Interest rates have moved up recently, but remain favorable. So, long term financing is still available at 90% of building value at rates under 5%. Price appreciation remained strong throughout 2017, further Fed action to raise rates may flatten out the pricing curve later in 2017.
A LOOK AHEAD
SF UNDER CONSTRUCTION
AVERAGE SF RENTAL RATES
$10.00
$10.50
$11.00
$11.50
$12.00
$12.50
$13.00
2015 Q4
2016 Q1
2016 Q2
2016 Q3
2016 Q4
$12.21
$12.35
$11.90
$11.69
$11.96
1,679,003
1,161,242
2,265,891
1,935,386
0
500,000
1,000,000
1,500,000
2,000,000
2,500,000
3,000,000
Squa
re F
eet
1,758,503
2015 Q4
2016 Q1
2016 Q2
2016 Q3
2016Q4
lee-associates.com 31 LEE OVERVIEW KEY MARKET SNAPSHOTS 5 LEE NETWORKNATIONAL OVERVIEW2 4 SIGNIFICANT TRANSACTIONS
Key Market Snapshots3
NET SF ABSORPTION
VACANCY RATE
4.8%VACANCY
$8.31AVG. SF RENTAL RATES
506,367NET SF ABSORPTION
294,629,905INDUSTRIAL SF INVENTORY
3,227,764SF UNDER CONSTRUCTION
-500,000
-250,000
250,000
500,000
750,000
1,000,000
1,250,000
1,500,000
1,750,000
Squa
re F
eet
2015 Q4
2016 Q1
2016 Q2
2016 Q3
2016 Q4
781,574
506,367
0
(357,111)
628,489
1,319,751
4.5%
4.3% 4.3%
3.50%
4.00%
4.50%
5.00%
5.50%
2015 Q4
2016 Q1
2016 Q2
2016 Q3
2016 Q4
4.8%
4.5%
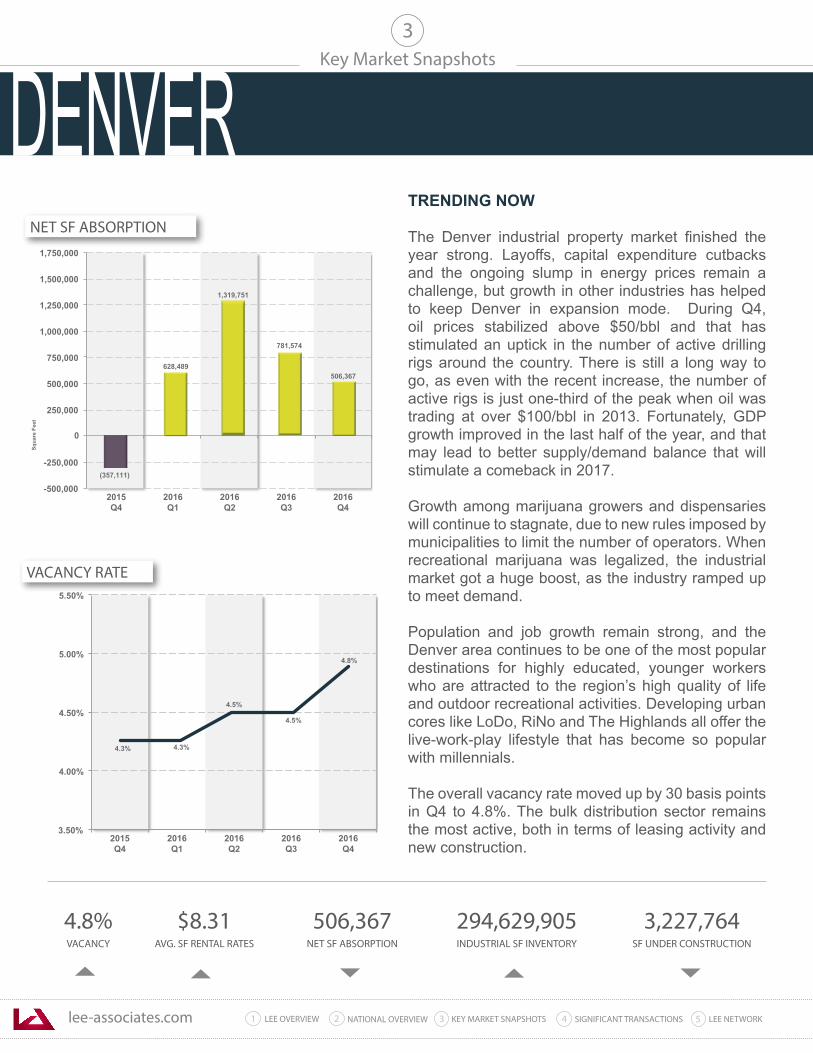
TRENDING NOW The Denver industrial property market finished the year strong. Layoffs, capital expenditure cutbacks and the ongoing slump in energy prices remain a challenge, but growth in other industries has helped to keep Denver in expansion mode. During Q4, oil prices stabilized above $50/bbl and that has stimulated an uptick in the number of active drilling rigs around the country. There is still a long way to go, as even with the recent increase, the number of active rigs is just one-third of the peak when oil was trading at over $100/bbl in 2013. Fortunately, GDP growth improved in the last half of the year, and that may lead to better supply/demand balance that will stimulate a comeback in 2017.
Growth among marijuana growers and dispensaries will continue to stagnate, due to new rules imposed by municipalities to limit the number of operators. When recreational marijuana was legalized, the industrial market got a huge boost, as the industry ramped up to meet demand.
Population and job growth remain strong, and the Denver area continues to be one of the most popular destinations for highly educated, younger workers who are attracted to the region’s high quality of life and outdoor recreational activities. Developing urban cores like LoDo, RiNo and The Highlands all offer the live-work-play lifestyle that has become so popular with millennials.
The overall vacancy rate moved up by 30 basis points in Q4 to 4.8%. The bulk distribution sector remains the most active, both in terms of leasing activity and new construction.
DENVER
lee-associates.com 31 LEE OVERVIEW KEY MARKET SNAPSHOTS 5 LEE NETWORKNATIONAL OVERVIEW2 4 SIGNIFICANT TRANSACTIONS
• Vacancy will continue its slight rise as large amounts of new space are added to inventory
• Vacancy will be concentrated in new product for the next several quarters
• Net absorption will remain near current levels
• Owner/user prices and transaction activity will slow as interest rates rise
• Average asking lease rates could see a slight decline in 2017
• Construction of spec projects will decline until
current pipeline of new space gets absorbed
Key Market Snapshots
DENVER - TRENDING NOW(continued)
3
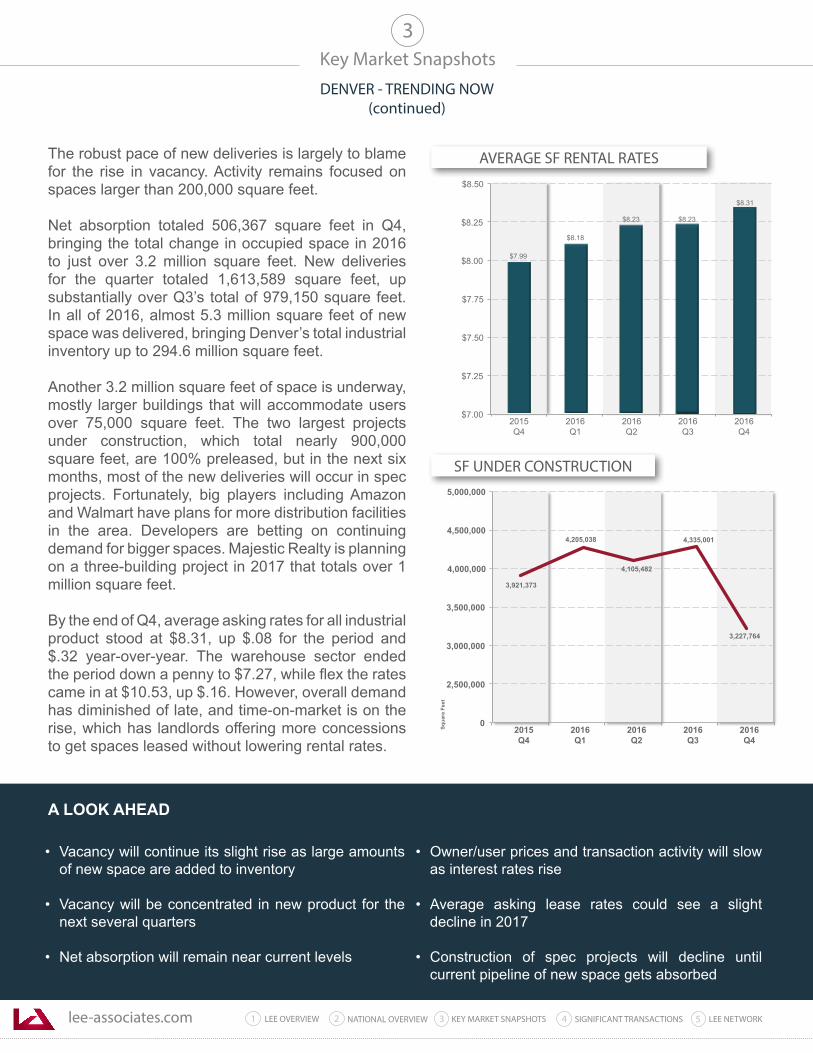
The robust pace of new deliveries is largely to blame for the rise in vacancy. Activity remains focused on spaces larger than 200,000 square feet.
Net absorption totaled 506,367 square feet in Q4, bringing the total change in occupied space in 2016 to just over 3.2 million square feet. New deliveries for the quarter totaled 1,613,589 square feet, up substantially over Q3’s total of 979,150 square feet. In all of 2016, almost 5.3 million square feet of new space was delivered, bringing Denver’s total industrial inventory up to 294.6 million square feet.
Another 3.2 million square feet of space is underway, mostly larger buildings that will accommodate users over 75,000 square feet. The two largest projects under construction, which total nearly 900,000 square feet, are 100% preleased, but in the next six months, most of the new deliveries will occur in spec projects. Fortunately, big players including Amazon and Walmart have plans for more distribution facilities in the area. Developers are betting on continuing demand for bigger spaces. Majestic Realty is planning on a three-building project in 2017 that totals over 1 million square feet.
By the end of Q4, average asking rates for all industrial product stood at $8.31, up $.08 for the period and $.32 year-over-year. The warehouse sector ended the period down a penny to $7.27, while flex the rates came in at $10.53, up $.16. However, overall demand has diminished of late, and time-on-market is on the rise, which has landlords offering more concessions to get spaces leased without lowering rental rates.
A LOOK AHEAD
SF UNDER CONSTRUCTION
AVERAGE SF RENTAL RATES
$7.00
$7.25
$7.50
$7.75
$8.00
$8.25
$8.50
2015 Q4
2016 Q1
2016 Q2
2016 Q3
2016 Q4
$8.23
$8.31
$8.18
$7.99
$8.23
4,335,001
3,227,764
3,921,373
4,205,038
0
2,500,000
3,000,000
3,500,000
4,000,000
4,500,000
5,000,000
Squa
re F
eet
4,105,482
2015 Q4
2016 Q1
2016 Q2
2016 Q3
2016Q4
lee-associates.com 31 LEE OVERVIEW KEY MARKET SNAPSHOTS 5 LEE NETWORKNATIONAL OVERVIEW2 4 SIGNIFICANT TRANSACTIONS
Key Market Snapshots
10.0%VACANCY
$6.84AVG. SF RENTAL RATES
2,305,766NET SF ABSORPTION
297,059,308INDUSTRIAL SF INVENTORY
3,858,105SF UNDER CONSTRUCTION
3
0
500,000
1,000,000
1,500,000
2,000,000
2,500,000
3,000,000
3,500,000
2015 Q3
2015 Q4
2016 Q1
2016 Q2
2016 Q3
Squa
re F
eet
769,768
1,860,934
3,100,698
1,159,965
1,633,655
10.0%
10.7%
11.0%
9.5%
10.0%
10.5%
11.0%
11.5%
2015 Q4
2016 Q1
2016 Q2
2016 Q3
2016 Q4
10.7% 10.6%
NET SF ABSORPTION
VACANCY RATE
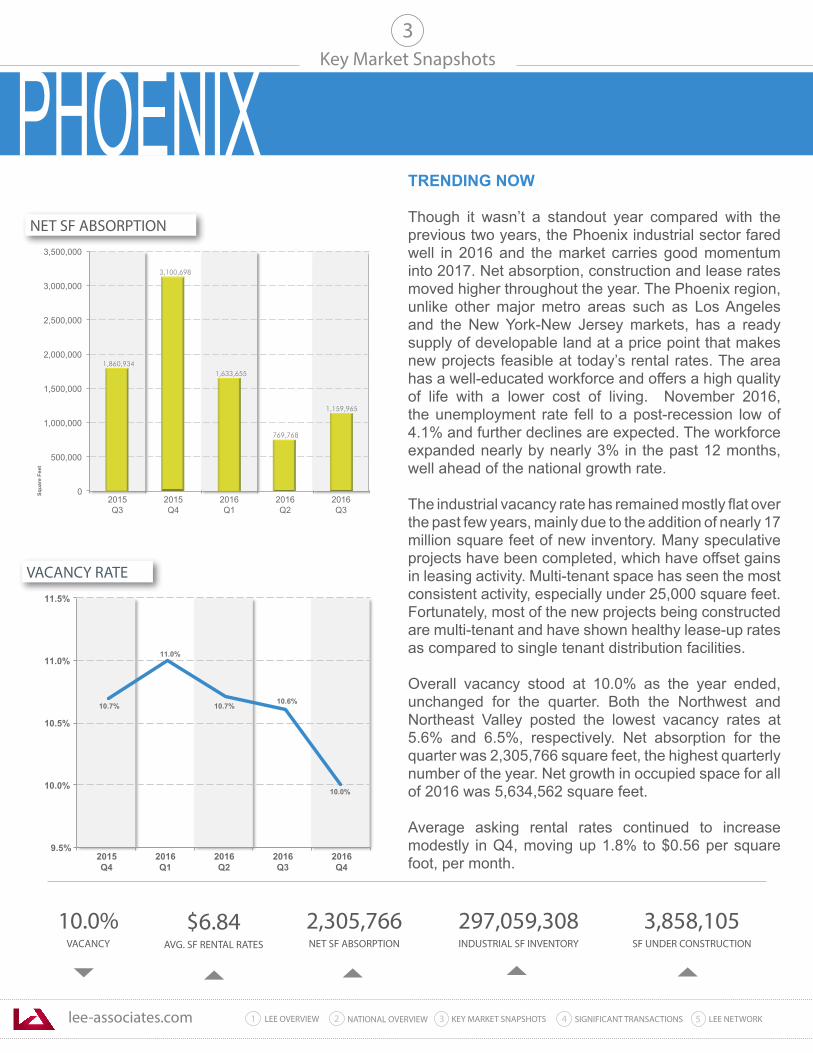
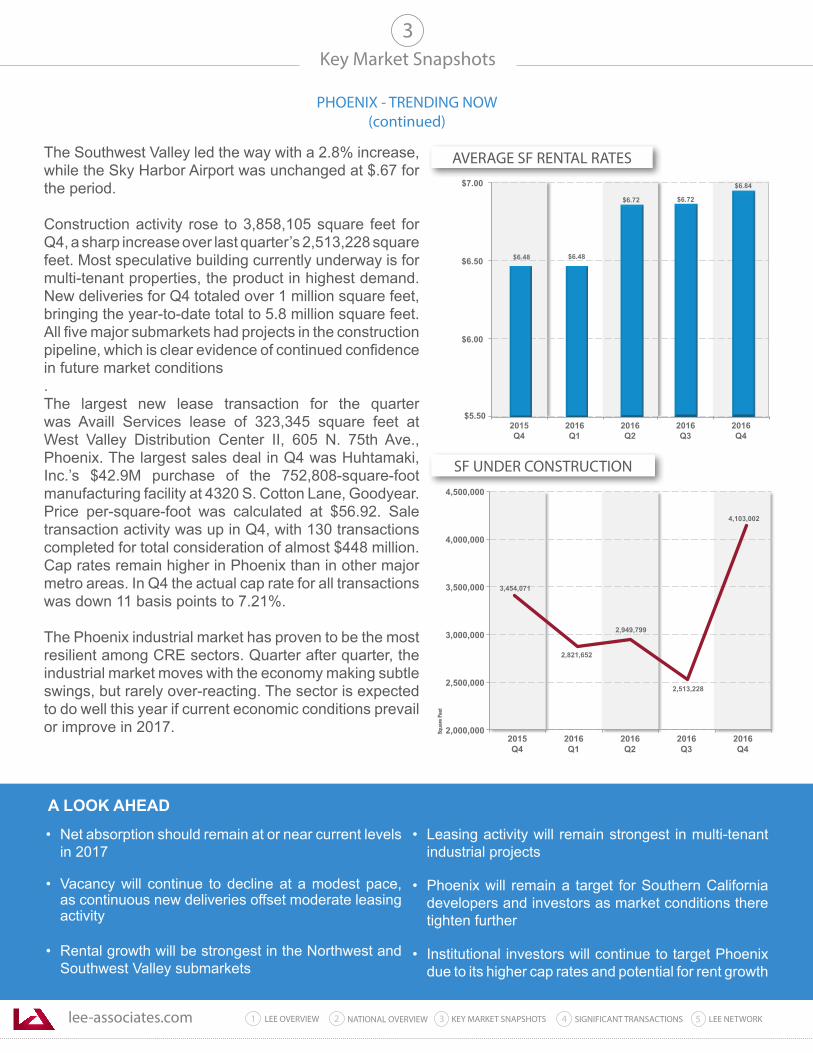
TRENDING NOW Though it wasn’t a standout year compared with the previous two years, the Phoenix industrial sector fared well in 2016 and the market carries good momentum into 2017. Net absorption, construction and lease rates moved higher throughout the year. The Phoenix region, unlike other major metro areas such as Los Angeles and the New York-New Jersey markets, has a ready supply of developable land at a price point that makes new projects feasible at today’s rental rates. The area has a well-educated workforce and offers a high quality of life with a lower cost of living. November 2016, the unemployment rate fell to a post-recession low of 4.1% and further declines are expected. The workforce expanded nearly by nearly 3% in the past 12 months, well ahead of the national growth rate.
The industrial vacancy rate has remained mostly flat over the past few years, mainly due to the addition of nearly 17 million square feet of new inventory. Many speculative projects have been completed, which have offset gains in leasing activity. Multi-tenant space has seen the most consistent activity, especially under 25,000 square feet. Fortunately, most of the new projects being constructed are multi-tenant and have shown healthy lease-up rates as compared to single tenant distribution facilities.
Overall vacancy stood at 10.0% as the year ended, unchanged for the quarter. Both the Northwest and Northeast Valley posted the lowest vacancy rates at 5.6% and 6.5%, respectively. Net absorption for the quarter was 2,305,766 square feet, the highest quarterly number of the year. Net growth in occupied space for all of 2016 was 5,634,562 square feet.
Average asking rental rates continued to increase modestly in Q4, moving up 1.8% to $0.56 per square foot, per month.
PHOENIX
lee-associates.com 31 LEE OVERVIEW KEY MARKET SNAPSHOTS 5 LEE NETWORKNATIONAL OVERVIEW2 4 SIGNIFICANT TRANSACTIONS
• Net absorption should remain at or near current levels in 2017
• Vacancy will continue to decline at a modest pace, as continuous new deliveries offset moderate leasing activity
• Rental growth will be strongest in the Northwest and Southwest Valley submarkets
• Leasing activity will remain strongest in multi-tenant industrial projects
• Phoenix will remain a target for Southern California developers and investors as market conditions there tighten further
• Institutional investors will continue to target Phoenix due to its higher cap rates and potential for rent growth
Key Market Snapshots
PHOENIX - TRENDING NOW(continued)
3
The Southwest Valley led the way with a 2.8% increase, while the Sky Harbor Airport was unchanged at $.67 for the period.
Construction activity rose to 3,858,105 square feet for Q4, a sharp increase over last quarter’s 2,513,228 square feet. Most speculative building currently underway is for multi-tenant properties, the product in highest demand. New deliveries for Q4 totaled over 1 million square feet, bringing the year-to-date total to 5.8 million square feet. All five major submarkets had projects in the construction pipeline, which is clear evidence of continued confidence in future market conditions. The largest new lease transaction for the quarter was Availl Services lease of 323,345 square feet at West Valley Distribution Center II, 605 N. 75th Ave., Phoenix. The largest sales deal in Q4 was Huhtamaki, Inc.’s $42.9M purchase of the 752,808-square-foot manufacturing facility at 4320 S. Cotton Lane, Goodyear. Price per-square-foot was calculated at $56.92. Sale transaction activity was up in Q4, with 130 transactions completed for total consideration of almost $448 million. Cap rates remain higher in Phoenix than in other major metro areas. In Q4 the actual cap rate for all transactions was down 11 basis points to 7.21%.
The Phoenix industrial market has proven to be the most resilient among CRE sectors. Quarter after quarter, the industrial market moves with the economy making subtle swings, but rarely over-reacting. The sector is expected to do well this year if current economic conditions prevail or improve in 2017.
$5.50
$6.00
$6.50
$7.00
2015 Q4
2016 Q1
2016 Q2
2016 Q3
2016 Q4
$6.48 $6.48
$6.84
$6.72 $6.72
2,513,228
4,103,002
3,454,071
2,821,652
2,000,000
2,500,000
3,000,000
3,500,000
4,000,000
4,500,000
2015 Q4
2016 Q1
2016 Q2
2016 Q3
2016 Q4
Squa
re F
eet
2,949,799
SF UNDER CONSTRUCTION
AVERAGE SF RENTAL RATES
A LOOK AHEAD
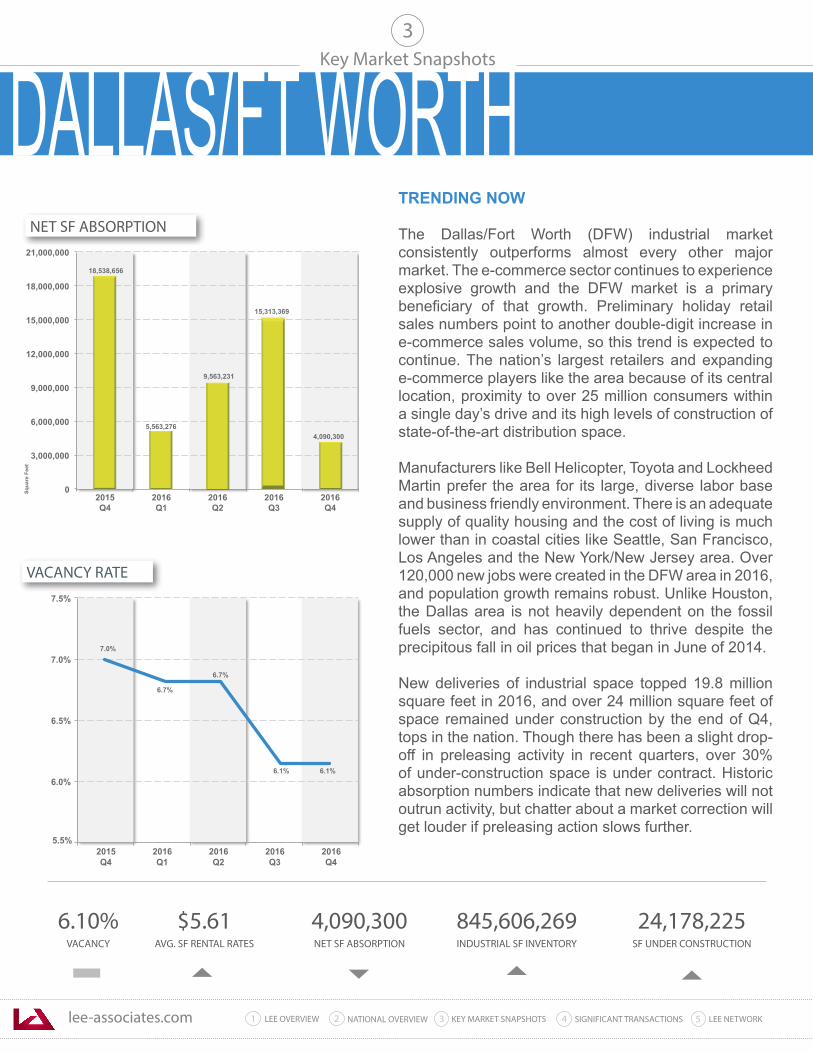
lee-associates.com 31 LEE OVERVIEW KEY MARKET SNAPSHOTS 5 LEE NETWORKNATIONAL OVERVIEW2 4 SIGNIFICANT TRANSACTIONS
Key Market Snapshots
6.10%VACANCY
$5.61AVG. SF RENTAL RATES
4,090,300NET SF ABSORPTION
845,606,269INDUSTRIAL SF INVENTORY
24,178,225SF UNDER CONSTRUCTION
3
0
3,000,000
6,000,000
9,000,000
12,000,000
15,000,000
18,000,000
21,000,000
2015 Q4
2016 Q1
2016 Q2
2016 Q3
2016 Q4
Squa
re F
eet
15,313,369
18,538,656
5,563,276 4,090,300
9,563,231
6.1%
7.0%
6.7%
5.5%
6.0%
6.5%
7.0%
7.5%
2015 Q4
2016 Q1
2016 Q2
2016 Q3
2016 Q4
6.7%
6.1%
NET SF ABSORPTION
VACANCY RATE
TRENDING NOW
The Dallas/Fort Worth (DFW) industrial market consistently outperforms almost every other major market. The e-commerce sector continues to experience explosive growth and the DFW market is a primary beneficiary of that growth. Preliminary holiday retail sales numbers point to another double-digit increase in e-commerce sales volume, so this trend is expected to continue. The nation’s largest retailers and expanding e-commerce players like the area because of its central location, proximity to over 25 million consumers within a single day’s drive and its high levels of construction of state-of-the-art distribution space.
Manufacturers like Bell Helicopter, Toyota and Lockheed Martin prefer the area for its large, diverse labor base and business friendly environment. There is an adequate supply of quality housing and the cost of living is much lower than in coastal cities like Seattle, San Francisco, Los Angeles and the New York/New Jersey area. Over 120,000 new jobs were created in the DFW area in 2016, and population growth remains robust. Unlike Houston, the Dallas area is not heavily dependent on the fossil fuels sector, and has continued to thrive despite the precipitous fall in oil prices that began in June of 2014.
New deliveries of industrial space topped 19.8 million square feet in 2016, and over 24 million square feet of space remained under construction by the end of Q4, tops in the nation. Though there has been a slight drop-off in preleasing activity in recent quarters, over 30% of under-construction space is under contract. Historic absorption numbers indicate that new deliveries will not outrun activity, but chatter about a market correction will get louder if preleasing action slows further.
DALLAS/FT WORTH
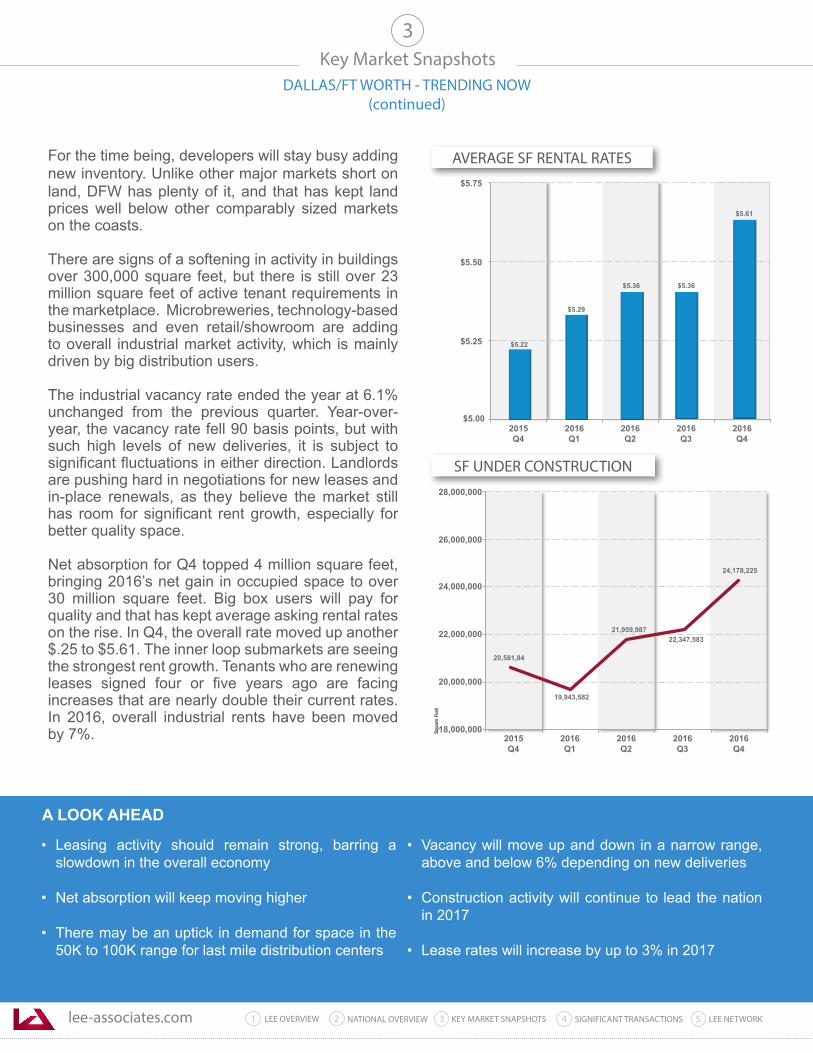
lee-associates.com 31 LEE OVERVIEW KEY MARKET SNAPSHOTS 5 LEE NETWORKNATIONAL OVERVIEW2 4 SIGNIFICANT TRANSACTIONS
• Leasing activity should remain strong, barring a slowdown in the overall economy
• Net absorption will keep moving higher
• There may be an uptick in demand for space in the 50K to 100K range for last mile distribution centers
• Vacancy will move up and down in a narrow range, above and below 6% depending on new deliveries
• Construction activity will continue to lead the nation in 2017
• Lease rates will increase by up to 3% in 2017
Key Market SnapshotsDALLAS/FT WORTH - TRENDING NOW
(continued)
3
For the time being, developers will stay busy adding new inventory. Unlike other major markets short on land, DFW has plenty of it, and that has kept land prices well below other comparably sized markets on the coasts. There are signs of a softening in activity in buildings over 300,000 square feet, but there is still over 23 million square feet of active tenant requirements in the marketplace. Microbreweries, technology-based businesses and even retail/showroom are adding to overall industrial market activity, which is mainly driven by big distribution users. The industrial vacancy rate ended the year at 6.1% unchanged from the previous quarter. Year-over-year, the vacancy rate fell 90 basis points, but with such high levels of new deliveries, it is subject to significant fluctuations in either direction. Landlords are pushing hard in negotiations for new leases and in-place renewals, as they believe the market still has room for significant rent growth, especially for better quality space.
Net absorption for Q4 topped 4 million square feet, bringing 2016’s net gain in occupied space to over 30 million square feet. Big box users will pay for quality and that has kept average asking rental rates on the rise. In Q4, the overall rate moved up another $.25 to $5.61. The inner loop submarkets are seeing the strongest rent growth. Tenants who are renewing leases signed four or five years ago are facing increases that are nearly double their current rates. In 2016, overall industrial rents have been moved by 7%.
$5.00
$5.25
$5.50
$5.75
2015 Q4
2016 Q1
2016 Q2
2016 Q3
2016 Q4
$5.29
$5.22
$5.61
$5.36 $5.36
22,347,583
24,178,225
20,581,84
19,943,582
18,000,000
20,000,000
22,000,000
24,000,000
26,000,000
28,000,000
2015 Q4
2016 Q1
2016 Q2
2016 Q3
2016 Q4
Squa
re F
eet
21,959,987
SF UNDER CONSTRUCTION
AVERAGE SF RENTAL RATES
A LOOK AHEAD
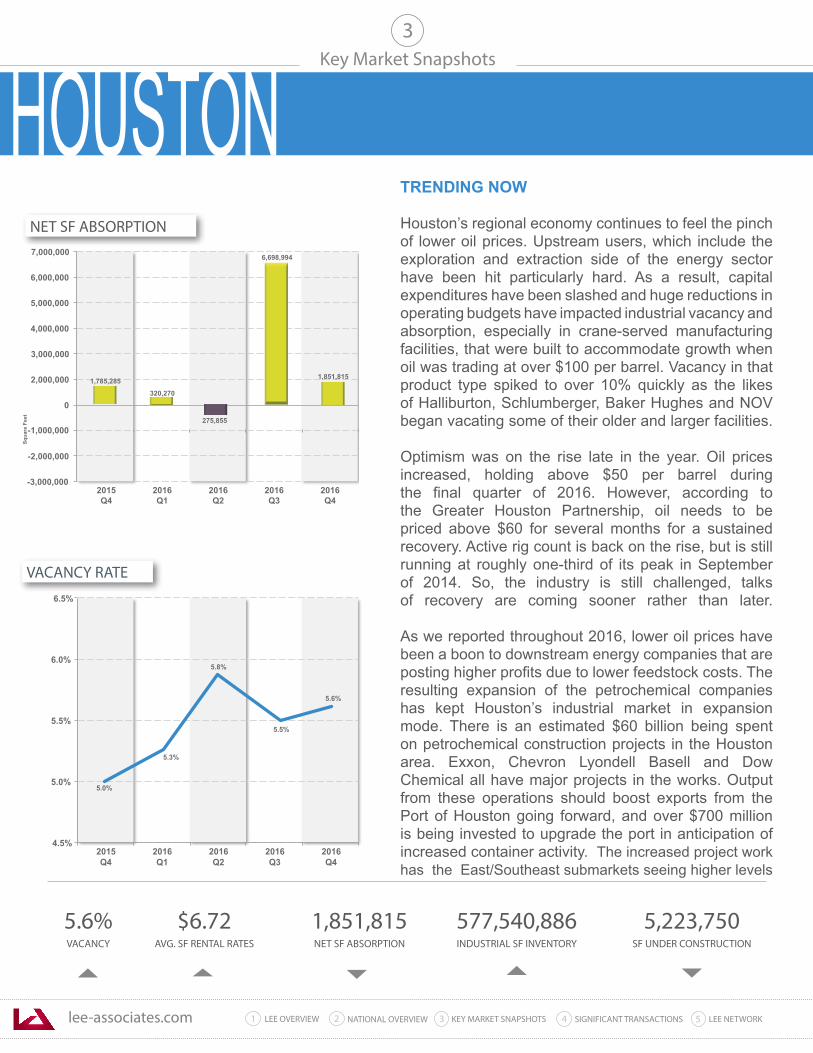
lee-associates.com 31 LEE OVERVIEW KEY MARKET SNAPSHOTS 5 LEE NETWORKNATIONAL OVERVIEW2 4 SIGNIFICANT TRANSACTIONS
Key Market Snapshots
5.6%VACANCY
$6.72AVG. SF RENTAL RATES
1,851,815NET SF ABSORPTION
577,540,886INDUSTRIAL SF INVENTORY
5,223,750SF UNDER CONSTRUCTION
3
-3,000,000
-2,000,000
0
2,000,000
3,000,000
4,000,000
5,000,000
6,000,000
7,000,000
Squa
re F
eet
2015 Q4
2016 Q1
2016 Q2
2016 Q3
2016 Q4
6,698,994
1,785,285
-1,000,000275,855
320,270
1,851,815
5.6%
5.0%
5.3%
4.5%
5.0%
5.5%
6.0%
6.5%
2015 Q4
2016 Q1
2016 Q2
2016 Q3
2016 Q4
5.8%
5.5%
NET SF ABSORPTION
VACANCY RATE
TRENDING NOW Houston’s regional economy continues to feel the pinch of lower oil prices. Upstream users, which include the exploration and extraction side of the energy sector have been hit particularly hard. As a result, capital expenditures have been slashed and huge reductions in operating budgets have impacted industrial vacancy and absorption, especially in crane-served manufacturing facilities, that were built to accommodate growth when oil was trading at over $100 per barrel. Vacancy in that product type spiked to over 10% quickly as the likes of Halliburton, Schlumberger, Baker Hughes and NOV began vacating some of their older and larger facilities.
Optimism was on the rise late in the year. Oil prices increased, holding above $50 per barrel during the final quarter of 2016. However, according to the Greater Houston Partnership, oil needs to be priced above $60 for several months for a sustained recovery. Active rig count is back on the rise, but is still running at roughly one-third of its peak in September of 2014. So, the industry is still challenged, talks of recovery are coming sooner rather than later. As we reported throughout 2016, lower oil prices have been a boon to downstream energy companies that are posting higher profits due to lower feedstock costs. The resulting expansion of the petrochemical companies has kept Houston’s industrial market in expansion mode. There is an estimated $60 billion being spent on petrochemical construction projects in the Houston area. Exxon, Chevron Lyondell Basell and Dow Chemical all have major projects in the works. Output from these operations should boost exports from the Port of Houston going forward, and over $700 million is being invested to upgrade the port in anticipation of increased container activity. The increased project work has the East/Southeast submarkets seeing higher levels
HOUSTON
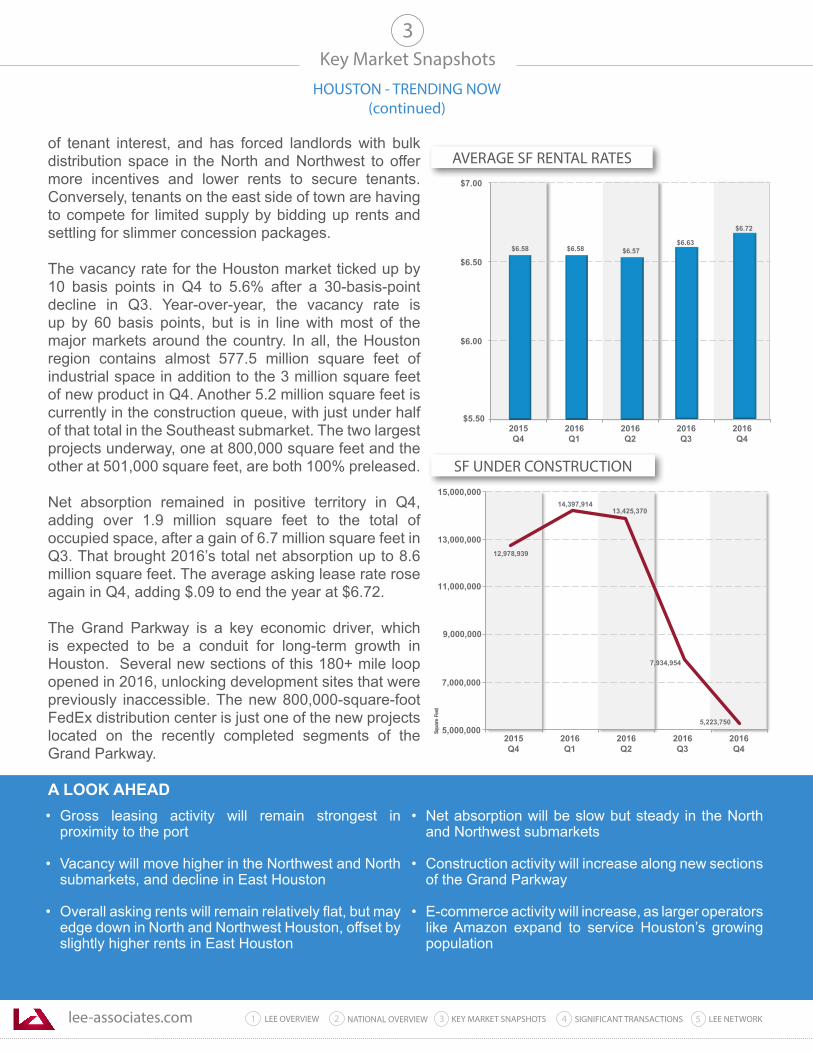
lee-associates.com 31 LEE OVERVIEW KEY MARKET SNAPSHOTS 5 LEE NETWORKNATIONAL OVERVIEW2 4 SIGNIFICANT TRANSACTIONS
• Gross leasing activity will remain strongest in proximity to the port
• Vacancy will move higher in the Northwest and North submarkets, and decline in East Houston
• Overall asking rents will remain relatively flat, but may edge down in North and Northwest Houston, offset by slightly higher rents in East Houston
• Net absorption will be slow but steady in the North and Northwest submarkets
• Construction activity will increase along new sections of the Grand Parkway
• E-commerce activity will increase, as larger operators like Amazon expand to service Houston’s growing population
Key Market Snapshots
HOUSTON - TRENDING NOW(continued)
3
of tenant interest, and has forced landlords with bulk distribution space in the North and Northwest to offer more incentives and lower rents to secure tenants. Conversely, tenants on the east side of town are having to compete for limited supply by bidding up rents and settling for slimmer concession packages.
The vacancy rate for the Houston market ticked up by 10 basis points in Q4 to 5.6% after a 30-basis-point decline in Q3. Year-over-year, the vacancy rate is up by 60 basis points, but is in line with most of the major markets around the country. In all, the Houston region contains almost 577.5 million square feet of industrial space in addition to the 3 million square feet of new product in Q4. Another 5.2 million square feet is currently in the construction queue, with just under half of that total in the Southeast submarket. The two largest projects underway, one at 800,000 square feet and the other at 501,000 square feet, are both 100% preleased.
Net absorption remained in positive territory in Q4, adding over 1.9 million square feet to the total of occupied space, after a gain of 6.7 million square feet in Q3. That brought 2016’s total net absorption up to 8.6 million square feet. The average asking lease rate rose again in Q4, adding $.09 to end the year at $6.72.
The Grand Parkway is a key economic driver, which is expected to be a conduit for long-term growth in Houston. Several new sections of this 180+ mile loop opened in 2016, unlocking development sites that were previously inaccessible. The new 800,000-square-foot FedEx distribution center is just one of the new projects located on the recently completed segments of the Grand Parkway.
A LOOK AHEAD
$5.50
$6.00
$6.50
$7.00
2015 Q4
2016 Q1
2016 Q2
2016 Q3
2016 Q4
$6.58 $6.58
$6.72
$6.57 $6.63
7,934,954
5,223,750
12,978,939
14,397,914
5,000,000
7,000,000
9,000,000
11,000,000
13,000,000
15,000,000
2015 Q4
2016 Q1
2016 Q2
2016 Q3
2016 Q4
Squa
re F
eet
13,425,370
SF UNDER CONSTRUCTION
AVERAGE SF RENTAL RATES
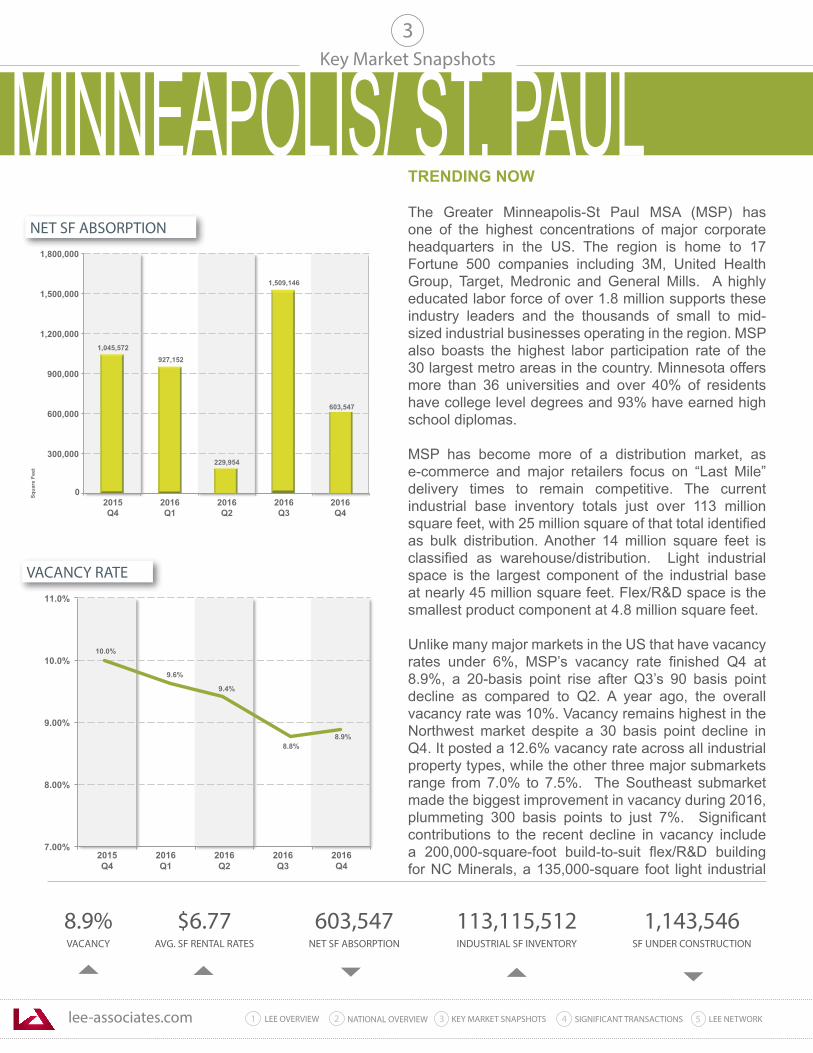
lee-associates.com 31 LEE OVERVIEW KEY MARKET SNAPSHOTS 5 LEE NETWORKNATIONAL OVERVIEW2 4 SIGNIFICANT TRANSACTIONS
TRENDING NOW The Greater Minneapolis-St Paul MSA (MSP) has one of the highest concentrations of major corporate headquarters in the US. The region is home to 17 Fortune 500 companies including 3M, United Health Group, Target, Medronic and General Mills. A highly educated labor force of over 1.8 million supports these industry leaders and the thousands of small to mid-sized industrial businesses operating in the region. MSP also boasts the highest labor participation rate of the 30 largest metro areas in the country. Minnesota offers more than 36 universities and over 40% of residents have college level degrees and 93% have earned high school diplomas.
MSP has become more of a distribution market, as e-commerce and major retailers focus on “Last Mile” delivery times to remain competitive. The current industrial base inventory totals just over 113 million square feet, with 25 million square of that total identified as bulk distribution. Another 14 million square feet is classified as warehouse/distribution. Light industrial space is the largest component of the industrial base at nearly 45 million square feet. Flex/R&D space is the smallest product component at 4.8 million square feet.
Unlike many major markets in the US that have vacancy rates under 6%, MSP’s vacancy rate finished Q4 at 8.9%, a 20-basis point rise after Q3’s 90 basis point decline as compared to Q2. A year ago, the overall vacancy rate was 10%. Vacancy remains highest in the Northwest market despite a 30 basis point decline in Q4. It posted a 12.6% vacancy rate across all industrial property types, while the other three major submarkets range from 7.0% to 7.5%. The Southeast submarket made the biggest improvement in vacancy during 2016, plummeting 300 basis points to just 7%. Significant contributions to the recent decline in vacancy include a 200,000-square-foot build-to-suit flex/R&D building for NC Minerals, a 135,000-square foot light industrial
Key Market Snapshots
8.9%VACANCY
$6.77AVG. SF RENTAL RATES
603,547NET SF ABSORPTION
1,143,546SF UNDER CONSTRUCTION
3
0
300,000
600,000
900,000
1,200,000
1,500,000
1,800,000
2016 Q4
2015 Q4
2016 Q1
2016 Q2
2016 Q3
Squa
re F
eet
1,509,146
603,547
1,045,572 927,152
229,954
10.0%
9.6%
9.4%
8.8%
7.00%
8.00%
9.00%
10.0%
11.0%
2015 Q4
2016 Q1
2016 Q2
2016 Q3
2016 Q4
8.9%
NET SF ABSORPTION
VACANCY RATE
113,115,512INDUSTRIAL SF INVENTORY
MINNEAPOLIS/ ST. PAUL
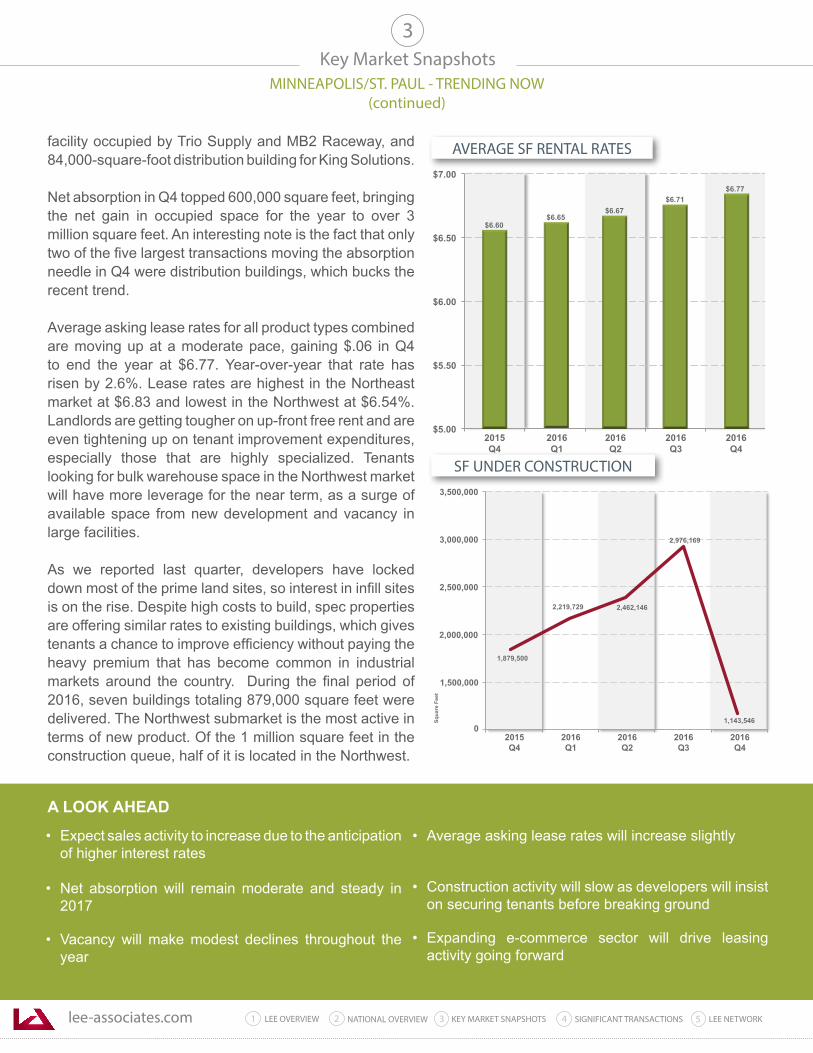
lee-associates.com 31 LEE OVERVIEW KEY MARKET SNAPSHOTS 5 LEE NETWORKNATIONAL OVERVIEW2 4 SIGNIFICANT TRANSACTIONS
• Expect sales activity to increase due to the anticipation of higher interest rates
• Net absorption will remain moderate and steady in 2017
• Vacancy will make modest declines throughout the year
• Average asking lease rates will increase slightly
• Construction activity will slow as developers will insist on securing tenants before breaking ground
• Expanding e-commerce sector will drive leasing activity going forward
Key Market SnapshotsMINNEAPOLIS/ST. PAUL - TRENDING NOW
(continued)
3
facility occupied by Trio Supply and MB2 Raceway, and 84,000-square-foot distribution building for King Solutions.
Net absorption in Q4 topped 600,000 square feet, bringing the net gain in occupied space for the year to over 3 million square feet. An interesting note is the fact that only two of the five largest transactions moving the absorption needle in Q4 were distribution buildings, which bucks the recent trend.
Average asking lease rates for all product types combined are moving up at a moderate pace, gaining $.06 in Q4 to end the year at $6.77. Year-over-year that rate has risen by 2.6%. Lease rates are highest in the Northeast market at $6.83 and lowest in the Northwest at $6.54%. Landlords are getting tougher on up-front free rent and are even tightening up on tenant improvement expenditures, especially those that are highly specialized. Tenants looking for bulk warehouse space in the Northwest market will have more leverage for the near term, as a surge of available space from new development and vacancy in large facilities.
As we reported last quarter, developers have locked down most of the prime land sites, so interest in infill sites is on the rise. Despite high costs to build, spec properties are offering similar rates to existing buildings, which gives tenants a chance to improve efficiency without paying the heavy premium that has become common in industrial markets around the country. During the final period of 2016, seven buildings totaling 879,000 square feet were delivered. The Northwest submarket is the most active in terms of new product. Of the 1 million square feet in the construction queue, half of it is located in the Northwest.
A LOOK AHEAD
$5.00
$5.50
$6.00
$6.50
$7.00
2015 Q4
2016 Q1
2016 Q2
2016Q3
2016Q4
$6.60$6.65
$6.67$6.71
$6.77
1,879,500
2,219,729 2,462,146
2,976,169
0
1,500,000
2,000,000
2,500,000
3,000,000
3,500,000
Squa
re F
eet
1,143,546
2015Q4
2016 Q1
2016 Q2
2016 Q3
2016 Q4
SF UNDER CONSTRUCTION
AVERAGE SF RENTAL RATES
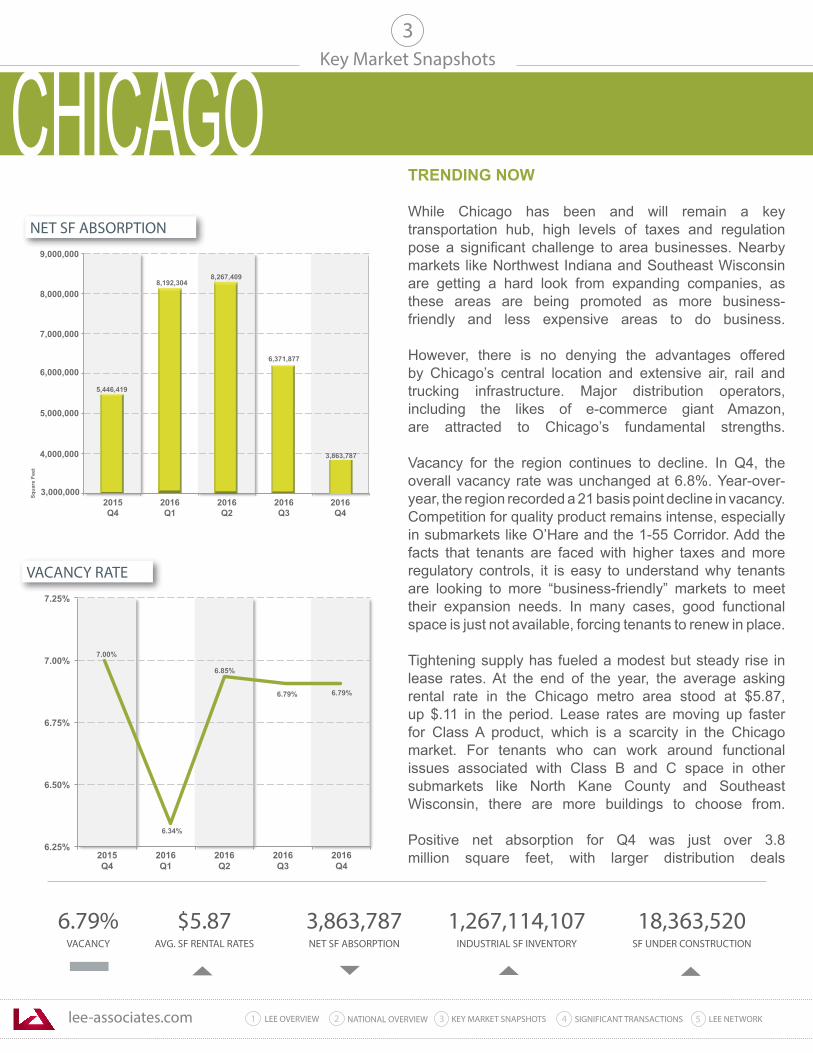
lee-associates.com 31 LEE OVERVIEW KEY MARKET SNAPSHOTS 5 LEE NETWORKNATIONAL OVERVIEW2 4 SIGNIFICANT TRANSACTIONS
TRENDING NOW While Chicago has been and will remain a key transportation hub, high levels of taxes and regulation pose a significant challenge to area businesses. Nearby markets like Northwest Indiana and Southeast Wisconsin are getting a hard look from expanding companies, as these areas are being promoted as more business-friendly and less expensive areas to do business.
However, there is no denying the advantages offered by Chicago’s central location and extensive air, rail and trucking infrastructure. Major distribution operators, including the likes of e-commerce giant Amazon, are attracted to Chicago’s fundamental strengths.
Vacancy for the region continues to decline. In Q4, the overall vacancy rate was unchanged at 6.8%. Year-over-year, the region recorded a 21 basis point decline in vacancy. Competition for quality product remains intense, especially in submarkets like O’Hare and the 1-55 Corridor. Add the facts that tenants are faced with higher taxes and more regulatory controls, it is easy to understand why tenants are looking to more “business-friendly” markets to meet their expansion needs. In many cases, good functional space is just not available, forcing tenants to renew in place.
Tightening supply has fueled a modest but steady rise in lease rates. At the end of the year, the average asking rental rate in the Chicago metro area stood at $5.87, up $.11 in the period. Lease rates are moving up faster for Class A product, which is a scarcity in the Chicago market. For tenants who can work around functional issues associated with Class B and C space in other submarkets like North Kane County and Southeast Wisconsin, there are more buildings to choose from.
Positive net absorption for Q4 was just over 3.8 million square feet, with larger distribution deals
Key Market Snapshots
6.79%VACANCY
$5.87AVG. SF RENTAL RATES
3,863,787NET SF ABSORPTION
1,267,114,107INDUSTRIAL SF INVENTORY
18,363,520SF UNDER CONSTRUCTION
3
3,000,000
4,000,000
5,000,000
6,000,000
7,000,000
8,000,000
9,000,000
2016 Q4
2015 Q4
2016 Q1
2016 Q2
2016 Q3
Squa
re F
eet
6,371,877
3,863,787
5,446,419
8,192,3048,267,409
7.00%
6.34%
6.85%
6.79%
6.25%
6.50%
6.75%
7.00%
7.25%
2015 Q4
2016 Q1
2016 Q2
2016 Q3
2016 Q4
6.79%
NET SF ABSORPTION
VACANCY RATE
CHICAGO
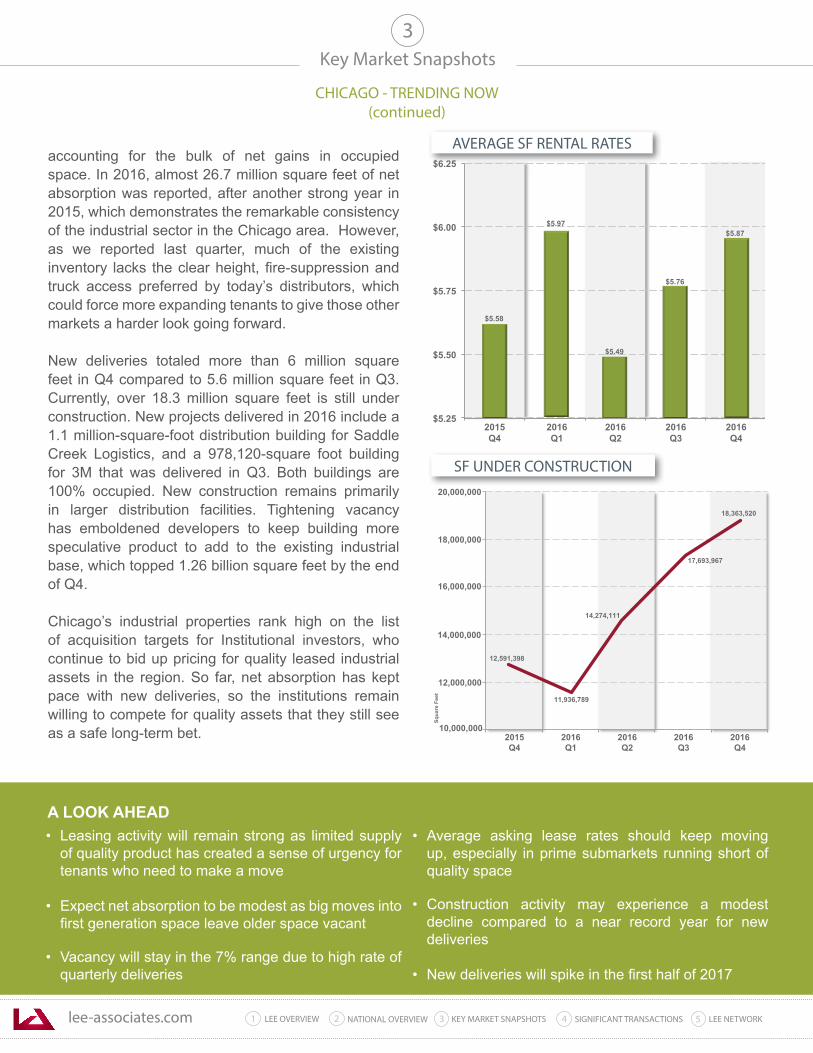
lee-associates.com 31 LEE OVERVIEW KEY MARKET SNAPSHOTS 5 LEE NETWORKNATIONAL OVERVIEW2 4 SIGNIFICANT TRANSACTIONS
• Leasing activity will remain strong as limited supply of quality product has created a sense of urgency for tenants who need to make a move
• Expect net absorption to be modest as big moves into first generation space leave older space vacant
• Vacancy will stay in the 7% range due to high rate of quarterly deliveries
• Average asking lease rates should keep moving up, especially in prime submarkets running short of quality space
• Construction activity may experience a modest decline compared to a near record year for new deliveries
• New deliveries will spike in the first half of 2017
Key Market Snapshots
CHICAGO - TRENDING NOW(continued)
3
accounting for the bulk of net gains in occupied space. In 2016, almost 26.7 million square feet of net absorption was reported, after another strong year in 2015, which demonstrates the remarkable consistency of the industrial sector in the Chicago area. However, as we reported last quarter, much of the existing inventory lacks the clear height, fire-suppression and truck access preferred by today’s distributors, which could force more expanding tenants to give those other markets a harder look going forward.
New deliveries totaled more than 6 million square feet in Q4 compared to 5.6 million square feet in Q3. Currently, over 18.3 million square feet is still under construction. New projects delivered in 2016 include a 1.1 million-square-foot distribution building for Saddle Creek Logistics, and a 978,120-square foot building for 3M that was delivered in Q3. Both buildings are 100% occupied. New construction remains primarily in larger distribution facilities. Tightening vacancy has emboldened developers to keep building more speculative product to add to the existing industrial base, which topped 1.26 billion square feet by the end of Q4.
Chicago’s industrial properties rank high on the list of acquisition targets for Institutional investors, who continue to bid up pricing for quality leased industrial assets in the region. So far, net absorption has kept pace with new deliveries, so the institutions remain willing to compete for quality assets that they still see as a safe long-term bet.
A LOOK AHEAD
$5.25
$5.50
$5.75
$6.00
$6.25
2015 Q4
2016 Q1
2016 Q2
2016Q3
2016Q4
$5.58
$5.97
$5.49
$5.76
$5.87
12,591,398
11,936,789
14,274,111
17,693,967
10,000,000
12,000,000
14,000,000
16,000,000
18,000,000
20,000,000
Squa
re F
eet
18,363,520
2015Q4
2016 Q1
2016 Q2
2016 Q3
2016 Q4
SF UNDER CONSTRUCTION
AVERAGE SF RENTAL RATES
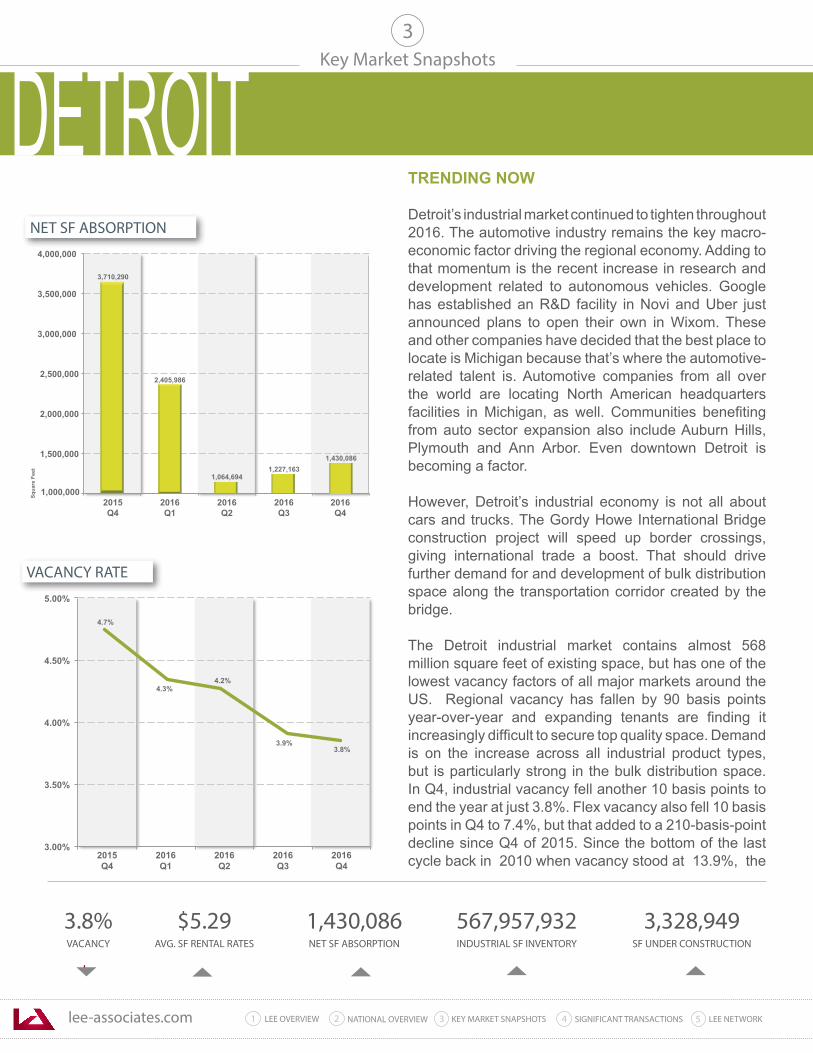
lee-associates.com 31 LEE OVERVIEW KEY MARKET SNAPSHOTS 5 LEE NETWORKNATIONAL OVERVIEW2 4 SIGNIFICANT TRANSACTIONS
TRENDING NOW Detroit’s industrial market continued to tighten throughout 2016. The automotive industry remains the key macro-economic factor driving the regional economy. Adding to that momentum is the recent increase in research and development related to autonomous vehicles. Google has established an R&D facility in Novi and Uber just announced plans to open their own in Wixom. These and other companies have decided that the best place to locate is Michigan because that’s where the automotive-related talent is. Automotive companies from all over the world are locating North American headquarters facilities in Michigan, as well. Communities benefiting from auto sector expansion also include Auburn Hills, Plymouth and Ann Arbor. Even downtown Detroit is becoming a factor.
However, Detroit’s industrial economy is not all about cars and trucks. The Gordy Howe International Bridge construction project will speed up border crossings, giving international trade a boost. That should drive further demand for and development of bulk distribution space along the transportation corridor created by the bridge.
The Detroit industrial market contains almost 568 million square feet of existing space, but has one of the lowest vacancy factors of all major markets around the US. Regional vacancy has fallen by 90 basis points year-over-year and expanding tenants are finding it increasingly difficult to secure top quality space. Demand is on the increase across all industrial product types, but is particularly strong in the bulk distribution space. In Q4, industrial vacancy fell another 10 basis points to end the year at just 3.8%. Flex vacancy also fell 10 basis points in Q4 to 7.4%, but that added to a 210-basis-point decline since Q4 of 2015. Since the bottom of the last cycle back in 2010 when vacancy stood at 13.9%, the
Key Market Snapshots
3.8%VACANCY
$5.29AVG. SF RENTAL RATES
1,430,086NET SF ABSORPTION
3,328,949SF UNDER CONSTRUCTION
3
1,000,000
1,500,000
2,000,000
2,500,000
3,000,000
3,500,000
4,000,000
2016 Q4
2015 Q4
2016 Q1
2016 Q2
2016 Q3
Squa
re F
eet 1,227,163
1,430,086
3,710,290
2,405,986
1,064,694
4.7%
4.3% 4.2%
3.9%
3.00%
3.50%
4.00%
4.50%
5.00%
2015 Q4
2016 Q1
2016 Q2
2016 Q3
2016 Q4
3.8%
NET SF ABSORPTION
VACANCY RATE
567,957,932INDUSTRIAL SF INVENTORY
DETROIT
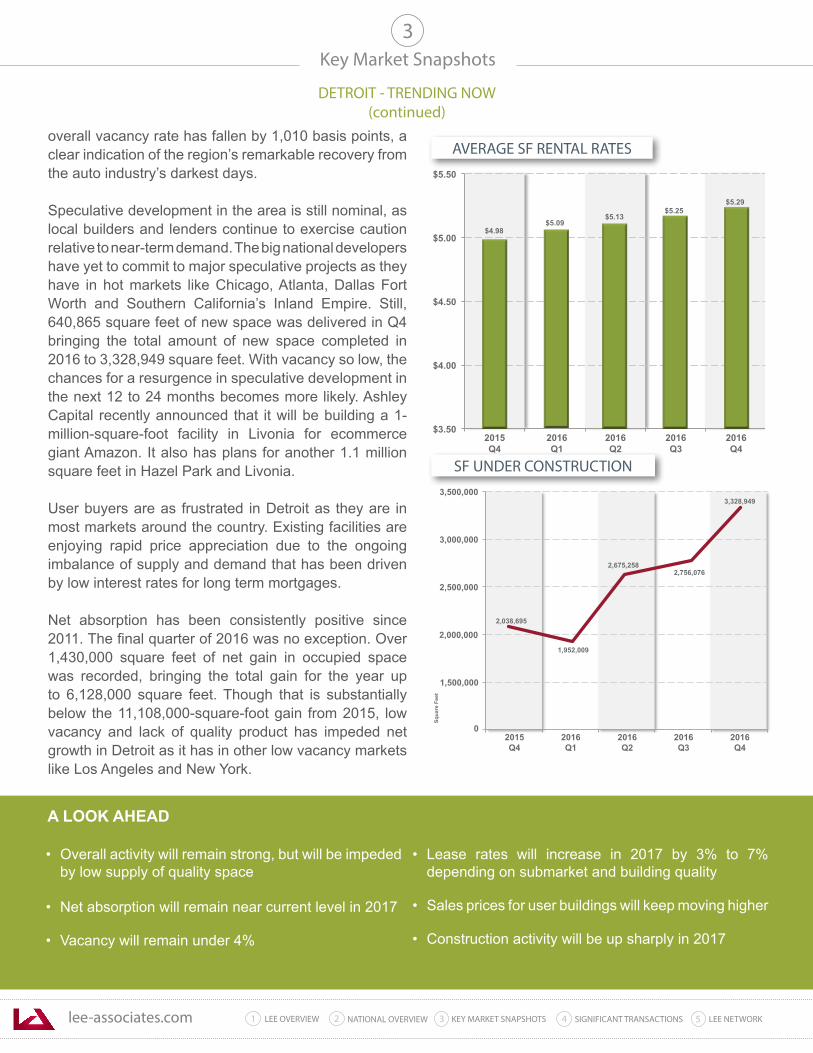
lee-associates.com 31 LEE OVERVIEW KEY MARKET SNAPSHOTS 5 LEE NETWORKNATIONAL OVERVIEW2 4 SIGNIFICANT TRANSACTIONS
• Overall activity will remain strong, but will be impeded by low supply of quality space
• Net absorption will remain near current level in 2017
• Vacancy will remain under 4%
• Lease rates will increase in 2017 by 3% to 7% depending on submarket and building quality
• Sales prices for user buildings will keep moving higher
• Construction activity will be up sharply in 2017
Key Market Snapshots
DETROIT - TRENDING NOW(continued)
3
overall vacancy rate has fallen by 1,010 basis points, a clear indication of the region’s remarkable recovery from the auto industry’s darkest days.
Speculative development in the area is still nominal, as local builders and lenders continue to exercise caution relative to near-term demand. The big national developers have yet to commit to major speculative projects as they have in hot markets like Chicago, Atlanta, Dallas Fort Worth and Southern California’s Inland Empire. Still, 640,865 square feet of new space was delivered in Q4 bringing the total amount of new space completed in 2016 to 3,328,949 square feet. With vacancy so low, the chances for a resurgence in speculative development in the next 12 to 24 months becomes more likely. Ashley Capital recently announced that it will be building a 1- million-square-foot facility in Livonia for ecommerce giant Amazon. It also has plans for another 1.1 million square feet in Hazel Park and Livonia.
User buyers are as frustrated in Detroit as they are in most markets around the country. Existing facilities are enjoying rapid price appreciation due to the ongoing imbalance of supply and demand that has been driven by low interest rates for long term mortgages.
Net absorption has been consistently positive since 2011. The final quarter of 2016 was no exception. Over 1,430,000 square feet of net gain in occupied space was recorded, bringing the total gain for the year up to 6,128,000 square feet. Though that is substantially below the 11,108,000-square-foot gain from 2015, low vacancy and lack of quality product has impeded net growth in Detroit as it has in other low vacancy markets like Los Angeles and New York.
A LOOK AHEAD
$3.50
$4.00
$4.50
$5.00
$5.50
2015 Q4
2016 Q1
2016 Q2
2016Q3
2016Q4
$4.98$5.09
$5.13$5.25
$5.29
2,038,695
1,952,009
2,675,2582,756,076
0
1,500,000
2,000,000
2,500,000
3,000,000
3,500,000
Squa
re F
eet
3,328,949
2015Q4
2016 Q1
2016 Q2
2016 Q3
2016 Q4
SF UNDER CONSTRUCTION
AVERAGE SF RENTAL RATES
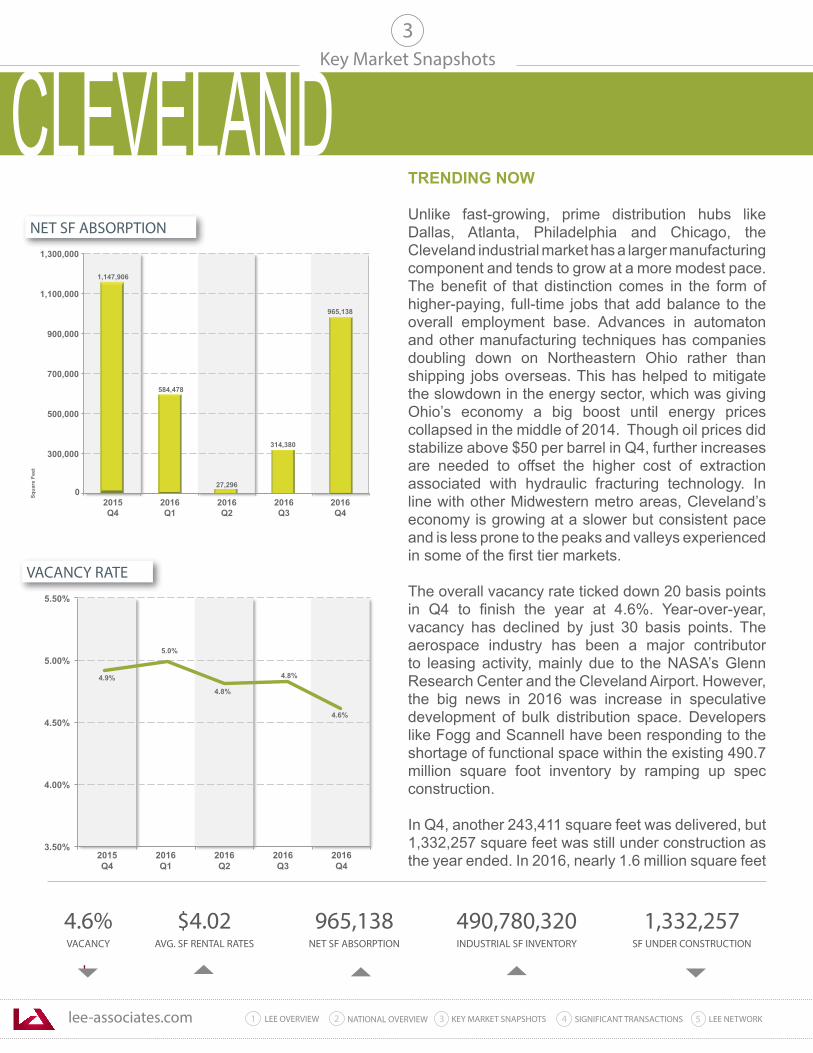
lee-associates.com 31 LEE OVERVIEW KEY MARKET SNAPSHOTS 5 LEE NETWORKNATIONAL OVERVIEW2 4 SIGNIFICANT TRANSACTIONS
TRENDING NOW Unlike fast-growing, prime distribution hubs like Dallas, Atlanta, Philadelphia and Chicago, the Cleveland industrial market has a larger manufacturing component and tends to grow at a more modest pace. The benefit of that distinction comes in the form of higher-paying, full-time jobs that add balance to the overall employment base. Advances in automaton and other manufacturing techniques has companies doubling down on Northeastern Ohio rather than shipping jobs overseas. This has helped to mitigate the slowdown in the energy sector, which was giving Ohio’s economy a big boost until energy prices collapsed in the middle of 2014. Though oil prices did stabilize above $50 per barrel in Q4, further increases are needed to offset the higher cost of extraction associated with hydraulic fracturing technology. In line with other Midwestern metro areas, Cleveland’s economy is growing at a slower but consistent pace and is less prone to the peaks and valleys experienced in some of the first tier markets.
The overall vacancy rate ticked down 20 basis points in Q4 to finish the year at 4.6%. Year-over-year, vacancy has declined by just 30 basis points. The aerospace industry has been a major contributor to leasing activity, mainly due to the NASA’s Glenn Research Center and the Cleveland Airport. However, the big news in 2016 was increase in speculative development of bulk distribution space. Developers like Fogg and Scannell have been responding to the shortage of functional space within the existing 490.7 million square foot inventory by ramping up spec construction.
In Q4, another 243,411 square feet was delivered, but 1,332,257 square feet was still under construction as the year ended. In 2016, nearly 1.6 million square feet
Key Market Snapshots
4.6%VACANCY
$4.02AVG. SF RENTAL RATES
965,138NET SF ABSORPTION
1,332,257SF UNDER CONSTRUCTION
3
0
300,000
500,000
700,000
900,000
1,100,000
1,300,000
2016 Q4
2015 Q4
2016 Q1
2016 Q2
2016 Q3
Squa
re F
eet
314,380
965,138
1,147,906
584,478
27,296
4.9%
5.0%
4.8%
4.8%
3.50%
4.00%
4.50%
5.00%
5.50%
2015 Q4
2016 Q1
2016 Q2
2016 Q3
2016 Q4
4.6%
NET SF ABSORPTION
VACANCY RATE
490,780,320INDUSTRIAL SF INVENTORY
CLEVELAND
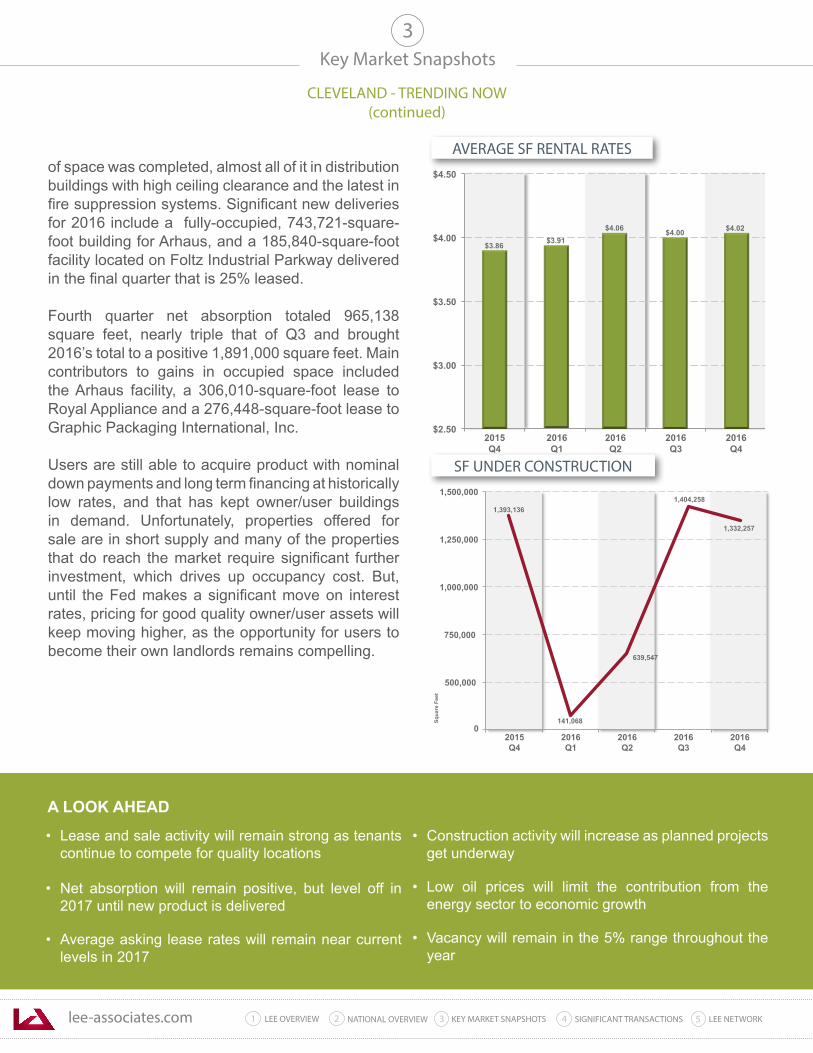
lee-associates.com 31 LEE OVERVIEW KEY MARKET SNAPSHOTS 5 LEE NETWORKNATIONAL OVERVIEW2 4 SIGNIFICANT TRANSACTIONS
• Lease and sale activity will remain strong as tenants continue to compete for quality locations
• Net absorption will remain positive, but level off in 2017 until new product is delivered
• Average asking lease rates will remain near current levels in 2017
• Construction activity will increase as planned projects get underway
• Low oil prices will limit the contribution from the energy sector to economic growth
• Vacancy will remain in the 5% range throughout the year
Key Market Snapshots
CLEVELAND - TRENDING NOW(continued)
3
of space was completed, almost all of it in distribution buildings with high ceiling clearance and the latest in fire suppression systems. Significant new deliveries for 2016 include a fully-occupied, 743,721-square-foot building for Arhaus, and a 185,840-square-foot facility located on Foltz Industrial Parkway delivered in the final quarter that is 25% leased.
Fourth quarter net absorption totaled 965,138 square feet, nearly triple that of Q3 and brought 2016’s total to a positive 1,891,000 square feet. Main contributors to gains in occupied space included the Arhaus facility, a 306,010-square-foot lease to Royal Appliance and a 276,448-square-foot lease to Graphic Packaging International, Inc.
Users are still able to acquire product with nominal down payments and long term financing at historically low rates, and that has kept owner/user buildings in demand. Unfortunately, properties offered for sale are in short supply and many of the properties that do reach the market require significant further investment, which drives up occupancy cost. But, until the Fed makes a significant move on interest rates, pricing for good quality owner/user assets will keep moving higher, as the opportunity for users to become their own landlords remains compelling.
A LOOK AHEAD
$2.50
$3.00
$3.50
$4.00
$4.50
2015 Q4
2016 Q1
2016 Q2
2016Q3
2016Q4
$3.86 $3.91 $4.06 $4.00 $4.02
1,393,136
141,068
639,547
1,404,258
0
500,000
750,000
1,000,000
1,250,000
1,500,000
Squa
re F
eet
1,332,257
2015Q4
2016 Q1
2016 Q2
2016 Q3
2016 Q4
SF UNDER CONSTRUCTION
AVERAGE SF RENTAL RATES
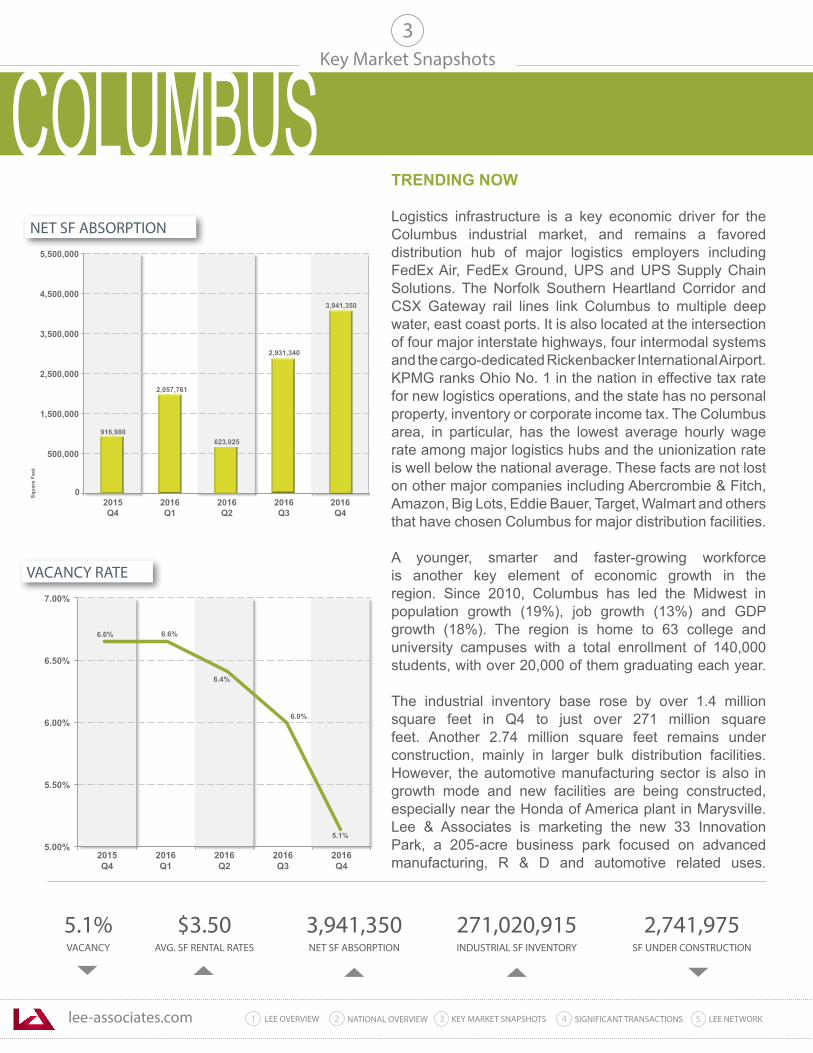
lee-associates.com 31 LEE OVERVIEW KEY MARKET SNAPSHOTS 5 LEE NETWORKNATIONAL OVERVIEW2 4 SIGNIFICANT TRANSACTIONS
TRENDING NOW Logistics infrastructure is a key economic driver for the Columbus industrial market, and remains a favored distribution hub of major logistics employers including FedEx Air, FedEx Ground, UPS and UPS Supply Chain Solutions. The Norfolk Southern Heartland Corridor and CSX Gateway rail lines link Columbus to multiple deep water, east coast ports. It is also located at the intersection of four major interstate highways, four intermodal systems and the cargo-dedicated Rickenbacker International Airport. KPMG ranks Ohio No. 1 in the nation in effective tax rate for new logistics operations, and the state has no personal property, inventory or corporate income tax. The Columbus area, in particular, has the lowest average hourly wage rate among major logistics hubs and the unionization rate is well below the national average. These facts are not lost on other major companies including Abercrombie & Fitch, Amazon, Big Lots, Eddie Bauer, Target, Walmart and others that have chosen Columbus for major distribution facilities.
A younger, smarter and faster-growing workforce is another key element of economic growth in the region. Since 2010, Columbus has led the Midwest in population growth (19%), job growth (13%) and GDP growth (18%). The region is home to 63 college and university campuses with a total enrollment of 140,000 students, with over 20,000 of them graduating each year.
The industrial inventory base rose by over 1.4 million square feet in Q4 to just over 271 million square feet. Another 2.74 million square feet remains under construction, mainly in larger bulk distribution facilities. However, the automotive manufacturing sector is also in growth mode and new facilities are being constructed, especially near the Honda of America plant in Marysville.Lee & Associates is marketing the new 33 Innovation Park, a 205-acre business park focused on advanced manufacturing, R & D and automotive related uses.
Key Market Snapshots
5.1%VACANCY
$3.50AVG. SF RENTAL RATES
3,941,350NET SF ABSORPTION
2,741,975SF UNDER CONSTRUCTION
3
0
500,000
1,500,000
2,500,000
3,500,000
4,500,000
5,500,000
2016 Q4
2015 Q4
2016 Q1
2016 Q2
2016 Q3
Squa
re F
eet
2,931,340
3,941,350
916,980
2,057,761
623,025
6.6% 6.6%
6.4%
6.0%
5.00%
5.50%
6.00%
6.50%
7.00%
2015 Q4
2016 Q1
2016 Q2
2016 Q3
2016 Q4
5.1%
NET SF ABSORPTION
VACANCY RATE
271,020,915INDUSTRIAL SF INVENTORY
COLUMBUS
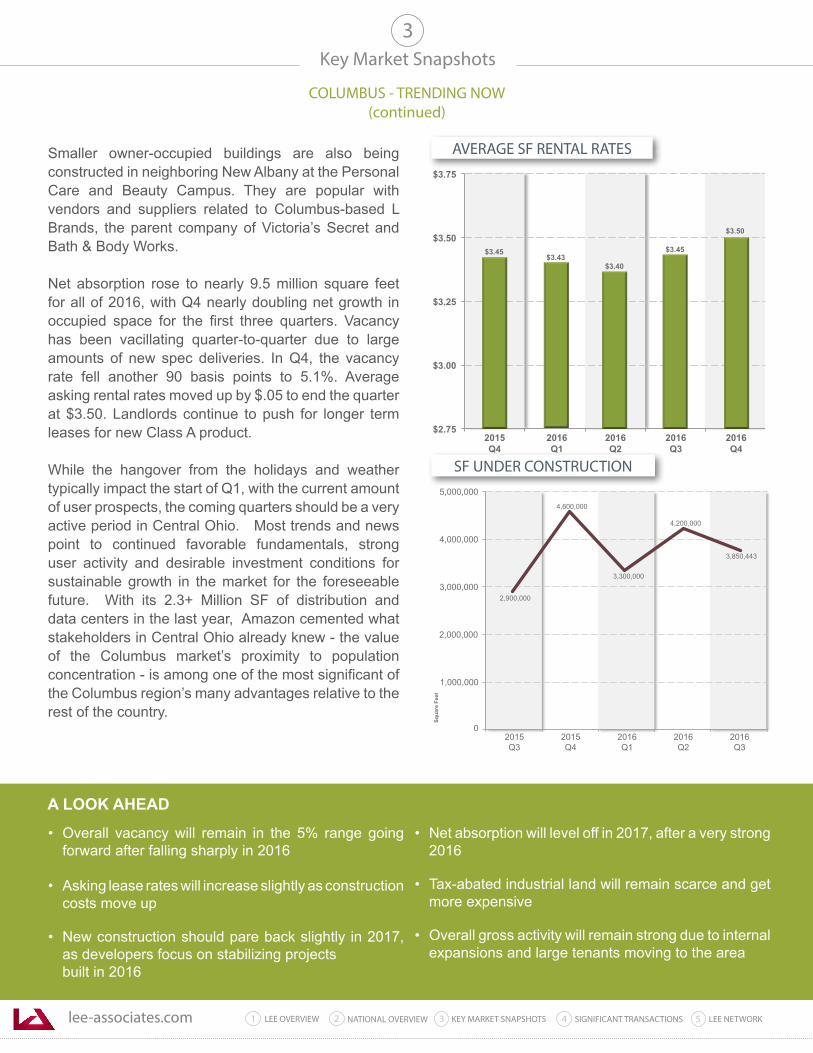
lee-associates.com 31 LEE OVERVIEW KEY MARKET SNAPSHOTS 5 LEE NETWORKNATIONAL OVERVIEW2 4 SIGNIFICANT TRANSACTIONS
• Overall vacancy will remain in the 5% range going forward after falling sharply in 2016
• Asking lease rates will increase slightly as construction costs move up
• New construction should pare back slightly in 2017, as developers focus on stabilizing projects built in 2016
• Net absorption will level off in 2017, after a very strong 2016
• Tax-abated industrial land will remain scarce and get more expensive
• Overall gross activity will remain strong due to internal expansions and large tenants moving to the area
Key Market Snapshots
COLUMBUS - TRENDING NOW(continued)
3
Smaller owner-occupied buildings are also being constructed in neighboring New Albany at the Personal Care and Beauty Campus. They are popular with vendors and suppliers related to Columbus-based L Brands, the parent company of Victoria’s Secret and Bath & Body Works.
Net absorption rose to nearly 9.5 million square feet for all of 2016, with Q4 nearly doubling net growth in occupied space for the first three quarters. Vacancy has been vacillating quarter-to-quarter due to large amounts of new spec deliveries. In Q4, the vacancy rate fell another 90 basis points to 5.1%. Average asking rental rates moved up by $.05 to end the quarter at $3.50. Landlords continue to push for longer term leases for new Class A product.
While the hangover from the holidays and weather typically impact the start of Q1, with the current amount of user prospects, the coming quarters should be a very active period in Central Ohio. Most trends and news point to continued favorable fundamentals, strong user activity and desirable investment conditions for sustainable growth in the market for the foreseeable future. With its 2.3+ Million SF of distribution and data centers in the last year, Amazon cemented what stakeholders in Central Ohio already knew - the value of the Columbus market’s proximity to population concentration - is among one of the most significant of the Columbus region’s many advantages relative to the rest of the country.
A LOOK AHEAD
$2.75
$3.00
$3.25
$3.50
$3.75
2015 Q4
2016 Q1
2016 Q2
2016Q3
2016Q4
$3.45$3.43
$3.40
$3.45
$3.50
2,900,000
4,600,000
3,300,000
4,200,000
0
1,000,000
2,000,000
3,000,000
4,000,000
5,000,000
Squa
re F
eet
3,850,443
2015Q3
2015 Q4
2016 Q1
2016 Q2
2016 Q3
SF UNDER CONSTRUCTION
AVERAGE SF RENTAL RATES
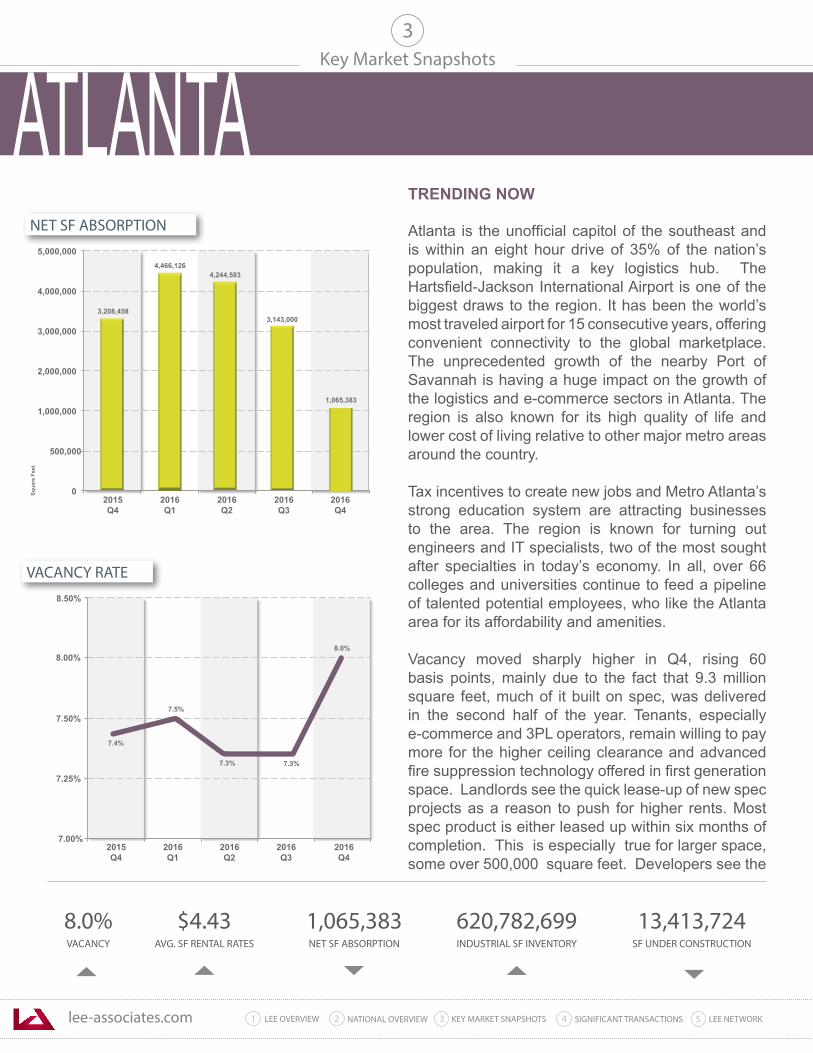
lee-associates.com 31 LEE OVERVIEW KEY MARKET SNAPSHOTS 5 LEE NETWORKNATIONAL OVERVIEW2 4 SIGNIFICANT TRANSACTIONS
Key Market Snapshots
8.0%VACANCY
$4.43AVG. SF RENTAL RATES
1,065,383NET SF ABSORPTION
620,782,699INDUSTRIAL SF INVENTORY
13,413,724SF UNDER CONSTRUCTION
3
0
500,000
1,000,000
2,000,000
3,000,000
4,000,000
5,000,000
2016 Q4
2015 Q4
2016 Q1
2016 Q2
2016 Q3
Squa
re F
eet
3,143,000
1,065,383
3,208,458
4,466,1264,244,583
8.0%
7.4%
7.5%
7.3%
7.00%
7.25%
7.50%
8.00%
8.50%
2016 Q4
2015Q4
2016 Q1
2016 Q2
2016 Q3
7.3%
NET SF ABSORPTION
VACANCY RATE
TRENDING NOW Atlanta is the unofficial capitol of the southeast and is within an eight hour drive of 35% of the nation’s population, making it a key logistics hub. The Hartsfield-Jackson International Airport is one of the biggest draws to the region. It has been the world’s most traveled airport for 15 consecutive years, offering convenient connectivity to the global marketplace. The unprecedented growth of the nearby Port of Savannah is having a huge impact on the growth of the logistics and e-commerce sectors in Atlanta. The region is also known for its high quality of life and lower cost of living relative to other major metro areas around the country.
Tax incentives to create new jobs and Metro Atlanta’s strong education system are attracting businesses to the area. The region is known for turning out engineers and IT specialists, two of the most sought after specialties in today’s economy. In all, over 66 colleges and universities continue to feed a pipeline of talented potential employees, who like the Atlanta area for its affordability and amenities.
Vacancy moved sharply higher in Q4, rising 60 basis points, mainly due to the fact that 9.3 million square feet, much of it built on spec, was delivered in the second half of the year. Tenants, especially e-commerce and 3PL operators, remain willing to pay more for the higher ceiling clearance and advanced fire suppression technology offered in first generation space. Landlords see the quick lease-up of new spec projects as a reason to push for higher rents. Most spec product is either leased up within six months of completion. This is especially true for larger space, some over 500,000 square feet. Developers see the
ATLANTA

lee-associates.com 31 LEE OVERVIEW KEY MARKET SNAPSHOTS 5 LEE NETWORKNATIONAL OVERVIEW2 4 SIGNIFICANT TRANSACTIONS
Key Market SnapshotsATLANTA - TRENDING NOW
(continued)
3
opportunity to save on construction costs by building larger buildings, confident the demand is there for quick absorption. Many of the new projects are being marketed aggressively and positioned for disposition to institutional buyers before the onset of the cap rate decompression many expect to see as interest rates rise.
Atlanta’s industrial inventory moved up to nearly 621 million square feet in Q4, with another 13.4 million square feet still underway. Developers are still bullish about the longevity of the recovery, ret growth and current levels of absorption. Competition is intense for land sites in urban submarkets and near major transportation corridors. Net absorption has been consistently positive, a clear indicator that the industrial sector continues to expand in the region. In Q4, another 1 million square foot gain in occupied space was recorded, bringing total net absorption for the year up to almost 11 million square feet. The average asking rental rate moved up $.10 to $4.43. Year-over-year, the average rate rose by 3.5%.
The availability of functional buildings for owner/users remains tight. The time required for permitting and construction, along with rising costs for labor, materials and financing, discourages users from building their own facilities, and spec developers are focused on building large distribution buildings that are less expensive to build, lease quickly and attract institutional buyers.
A LOOK AHEAD
0
$2.00
$2.50
$3.00
$3.50
$4.00
$4.50
$5.00
2016 Q4
2015 Q4
2016 Q1
2016 Q2
2016 Q1
$4.43
$4.28 $4.28 $4.28 $4.33
13,413,724
17,059,249 16,915,725
15,186,518
12,000,000
14,000,000
16,000,000
18,000,000
Squ a
re F
eet
14,751,962
2016 Q4
2015 Q4
2016 Q1
2016 Q2
2016Q3
10,000,000
SF UNDER CONSTRUCTION
AVERAGE SF RENTAL RATES
• Vacancy will fluctuate due to periodic delivery of large blocks of spec space
• Net absorption should remain in the 2 to 3 million square foot range for the first half of 2017
• Lease rates will keep moving higher overall, but the biggest increase will be in first generation distribution buildings
• Some functionally obsolete in-town buildings will be retrofit to accommodate “last-mile delivery”
• Labor shortages and a protracted entitlement process will create a backlog of construction projects for the next 2-3 years
• Land prices will range from $70,000 to $120,000 per acre depending on entitlements and on-site improvements
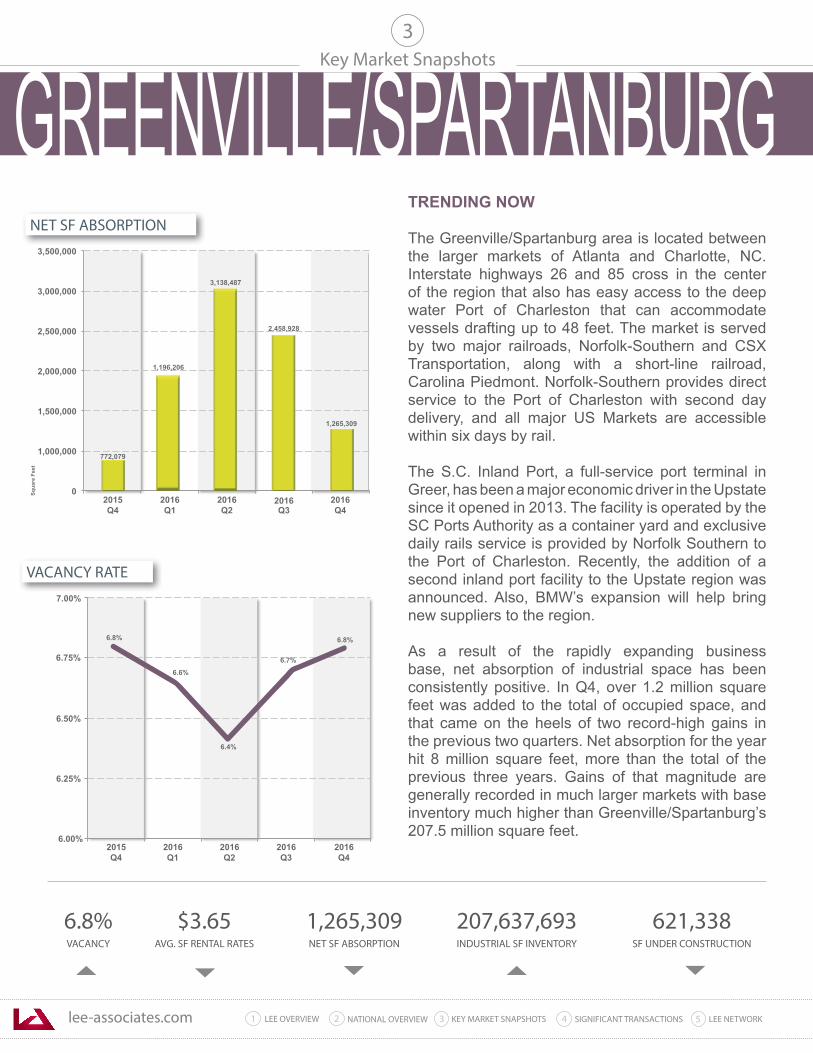
lee-associates.com 31 LEE OVERVIEW KEY MARKET SNAPSHOTS 5 LEE NETWORKNATIONAL OVERVIEW2 4 SIGNIFICANT TRANSACTIONS
Key Market Snapshots
6.8%VACANCY
$3.65AVG. SF RENTAL RATES
1,265,309NET SF ABSORPTION
207,637,693INDUSTRIAL SF INVENTORY
621,338SF UNDER CONSTRUCTION
3
0
1,000,000
1,500,000
2,000,000
2,500,000
3,000,000
3,500,000
2016 Q4
2015 Q4
2016 Q1
2016 Q2
2016 Q3
Squa
re F
eet
2,458,928
772,079
1,196,206
3,138,487
1,265,309
6.8%6.8%
6.6%
6.4%
6.00%
6.25%
6.50%
6.75%
7.00%
2016 Q4
2015Q4
2016 Q1
2016 Q2
2016 Q3
6.7%
NET SF ABSORPTION
VACANCY RATE
TRENDING NOW The Greenville/Spartanburg area is located between the larger markets of Atlanta and Charlotte, NC. Interstate highways 26 and 85 cross in the center of the region that also has easy access to the deep water Port of Charleston that can accommodate vessels drafting up to 48 feet. The market is served by two major railroads, Norfolk-Southern and CSX Transportation, along with a short-line railroad, Carolina Piedmont. Norfolk-Southern provides direct service to the Port of Charleston with second day delivery, and all major US Markets are accessible within six days by rail.
The S.C. Inland Port, a full-service port terminal in Greer, has been a major economic driver in the Upstate since it opened in 2013. The facility is operated by the SC Ports Authority as a container yard and exclusive daily rails service is provided by Norfolk Southern to the Port of Charleston. Recently, the addition of a second inland port facility to the Upstate region was announced. Also, BMW’s expansion will help bring new suppliers to the region.
As a result of the rapidly expanding business base, net absorption of industrial space has been consistently positive. In Q4, over 1.2 million square feet was added to the total of occupied space, and that came on the heels of two record-high gains in the previous two quarters. Net absorption for the year hit 8 million square feet, more than the total of the previous three years. Gains of that magnitude are generally recorded in much larger markets with base inventory much higher than Greenville/Spartanburg’s 207.5 million square feet.
GREENVILLE/SPARTANBURG
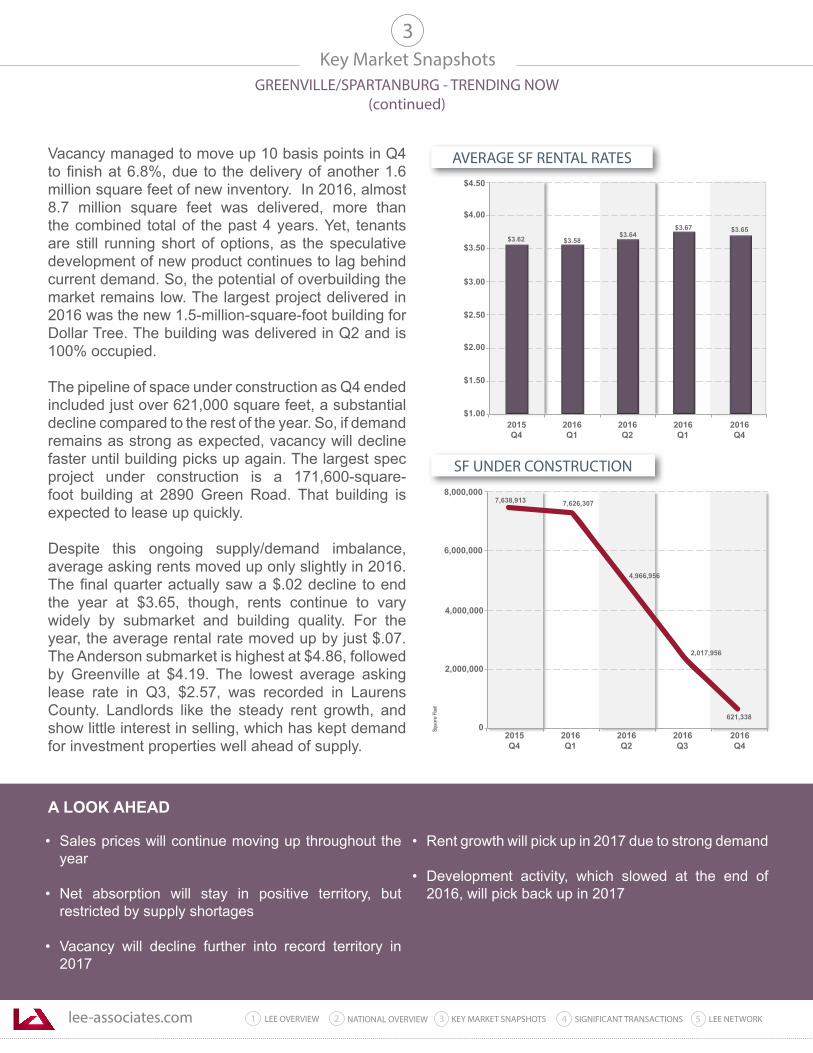
lee-associates.com 31 LEE OVERVIEW KEY MARKET SNAPSHOTS 5 LEE NETWORKNATIONAL OVERVIEW2 4 SIGNIFICANT TRANSACTIONS
Key Market SnapshotsGREENVILLE/SPARTANBURG - TRENDING NOW
(continued)
3
Vacancy managed to move up 10 basis points in Q4 to finish at 6.8%, due to the delivery of another 1.6 million square feet of new inventory. In 2016, almost 8.7 million square feet was delivered, more than the combined total of the past 4 years. Yet, tenants are still running short of options, as the speculative development of new product continues to lag behind current demand. So, the potential of overbuilding the market remains low. The largest project delivered in 2016 was the new 1.5-million-square-foot building for Dollar Tree. The building was delivered in Q2 and is 100% occupied.
The pipeline of space under construction as Q4 ended included just over 621,000 square feet, a substantial decline compared to the rest of the year. So, if demand remains as strong as expected, vacancy will decline faster until building picks up again. The largest spec project under construction is a 171,600-square-foot building at 2890 Green Road. That building is expected to lease up quickly.
Despite this ongoing supply/demand imbalance, average asking rents moved up only slightly in 2016. The final quarter actually saw a $.02 decline to end the year at $3.65, though, rents continue to vary widely by submarket and building quality. For the year, the average rental rate moved up by just $.07. The Anderson submarket is highest at $4.86, followed by Greenville at $4.19. The lowest average asking lease rate in Q3, $2.57, was recorded in Laurens County. Landlords like the steady rent growth, and show little interest in selling, which has kept demand for investment properties well ahead of supply.
A LOOK AHEAD
$1.00
$1.50
$2.00
$2.50
$3.00
$3.50
$4.00
$4.50
2016 Q4
2015 Q4
2016 Q1
2016 Q2
2016 Q1
$3.65 $3.62 $3.58
$3.64 $3.67
621,338
7,638,913 7,626,307
4,966,956
2,000,000
4,000,000
6,000,000
8,000,000
Squ a
re F
eet
2,017,956
2016 Q4
2015 Q4
2016 Q1
2016 Q2
2016Q3
0
SF UNDER CONSTRUCTION
AVERAGE SF RENTAL RATES
• Sales prices will continue moving up throughout the year
• Net absorption will stay in positive territory, but restricted by supply shortages
• Vacancy will decline further into record territory in 2017
• Rent growth will pick up in 2017 due to strong demand
• Development activity, which slowed at the end of 2016, will pick back up in 2017
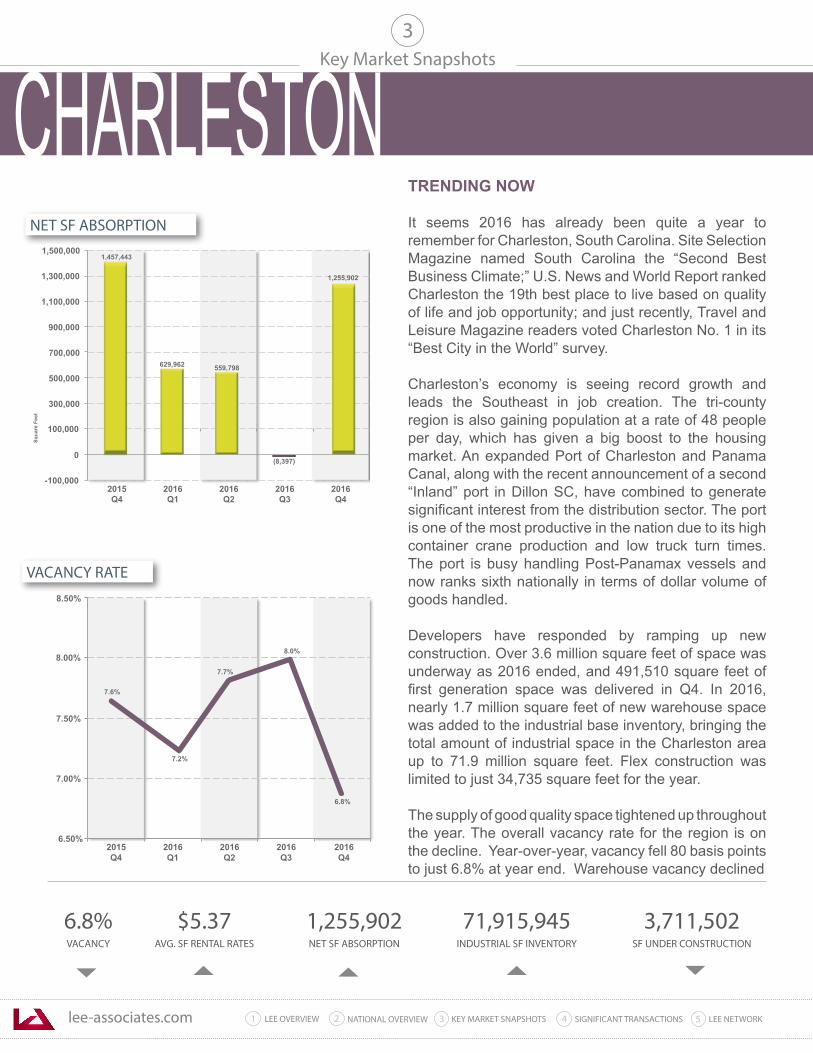
lee-associates.com 31 LEE OVERVIEW KEY MARKET SNAPSHOTS 5 LEE NETWORKNATIONAL OVERVIEW2 4 SIGNIFICANT TRANSACTIONS
Key Market Snapshots
6.8%VACANCY
$5.37AVG. SF RENTAL RATES
1,255,902NET SF ABSORPTION
71,915,945INDUSTRIAL SF INVENTORY
3,711,502SF UNDER CONSTRUCTION
3
-100,000
0
300,000
500,000
700,000
900,000
1,100,000
1,300,000
1,500,000
Squa
re F
eet
2015 Q4
2016 Q1
2016 Q2
2016 Q3
2016 Q4
(8,397)
1,457,443
100,000
559,798 629,962
1,255,902
6.8%
7.6%
7.2%
7.7%
6.50%
7.00%
7.50%
8.00%
8.50%
2016 Q4
2015Q4
2016 Q1
2016 Q2
2016 Q3
8.0%
NET SF ABSORPTION
VACANCY RATE
TRENDING NOW It seems 2016 has already been quite a year to remember for Charleston, South Carolina. Site Selection Magazine named South Carolina the “Second Best Business Climate;” U.S. News and World Report ranked Charleston the 19th best place to live based on quality of life and job opportunity; and just recently, Travel and Leisure Magazine readers voted Charleston No. 1 in its “Best City in the World” survey.
Charleston’s economy is seeing record growth and leads the Southeast in job creation. The tri-county region is also gaining population at a rate of 48 people per day, which has given a big boost to the housing market. An expanded Port of Charleston and Panama Canal, along with the recent announcement of a second “Inland” port in Dillon SC, have combined to generate significant interest from the distribution sector. The port is one of the most productive in the nation due to its high container crane production and low truck turn times. The port is busy handling Post-Panamax vessels and now ranks sixth nationally in terms of dollar volume of goods handled.
Developers have responded by ramping up new construction. Over 3.6 million square feet of space was underway as 2016 ended, and 491,510 square feet of first generation space was delivered in Q4. In 2016, nearly 1.7 million square feet of new warehouse space was added to the industrial base inventory, bringing the total amount of industrial space in the Charleston area up to 71.9 million square feet. Flex construction was limited to just 34,735 square feet for the year.
The supply of good quality space tightened up throughout the year. The overall vacancy rate for the region is on the decline. Year-over-year, vacancy fell 80 basis points to just 6.8% at year end. Warehouse vacancy declined
CHARLESTON
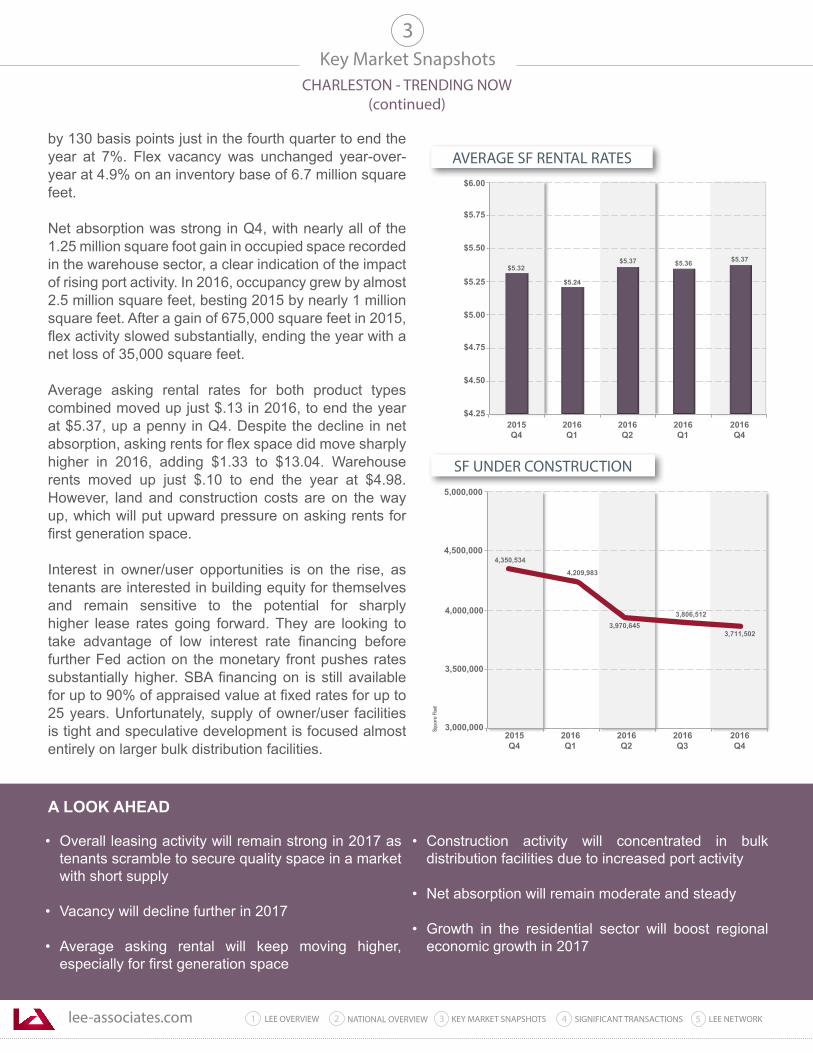
lee-associates.com 31 LEE OVERVIEW KEY MARKET SNAPSHOTS 5 LEE NETWORKNATIONAL OVERVIEW2 4 SIGNIFICANT TRANSACTIONS
Key Market SnapshotsCHARLESTON - TRENDING NOW
(continued)
3
by 130 basis points just in the fourth quarter to end the year at 7%. Flex vacancy was unchanged year-over-year at 4.9% on an inventory base of 6.7 million square feet.
Net absorption was strong in Q4, with nearly all of the 1.25 million square foot gain in occupied space recorded in the warehouse sector, a clear indication of the impact of rising port activity. In 2016, occupancy grew by almost 2.5 million square feet, besting 2015 by nearly 1 million square feet. After a gain of 675,000 square feet in 2015, flex activity slowed substantially, ending the year with a net loss of 35,000 square feet.
Average asking rental rates for both product types combined moved up just $.13 in 2016, to end the year at $5.37, up a penny in Q4. Despite the decline in net absorption, asking rents for flex space did move sharply higher in 2016, adding $1.33 to $13.04. Warehouse rents moved up just $.10 to end the year at $4.98. However, land and construction costs are on the way up, which will put upward pressure on asking rents for first generation space.
Interest in owner/user opportunities is on the rise, as tenants are interested in building equity for themselves and remain sensitive to the potential for sharply higher lease rates going forward. They are looking to take advantage of low interest rate financing before further Fed action on the monetary front pushes rates substantially higher. SBA financing on is still available for up to 90% of appraised value at fixed rates for up to 25 years. Unfortunately, supply of owner/user facilities is tight and speculative development is focused almost entirely on larger bulk distribution facilities.
A LOOK AHEAD
$4.25
$4.50
$4.75
$5.00
$5.25
$5.50
$5.75
$6.00
2016 Q4
2015 Q4
2016 Q1
2016 Q2
2016 Q1
$5.37 $5.32
$5.24
$5.37 $5.36
3,711,502
4,350,534
4,209,983
3,970,645
3,500,000
4,000,000
4,500,000
5,000,000
Squ a
re F
eet
3,806,512
2016 Q4
2015 Q4
2016 Q1
2016 Q2
2016Q3
3,000,000
SF UNDER CONSTRUCTION
AVERAGE SF RENTAL RATES
• Overall leasing activity will remain strong in 2017 as tenants scramble to secure quality space in a market with short supply
• Vacancy will decline further in 2017
• Average asking rental will keep moving higher, especially for first generation space
• Construction activity will concentrated in bulk distribution facilities due to increased port activity
• Net absorption will remain moderate and steady
• Growth in the residential sector will boost regional economic growth in 2017
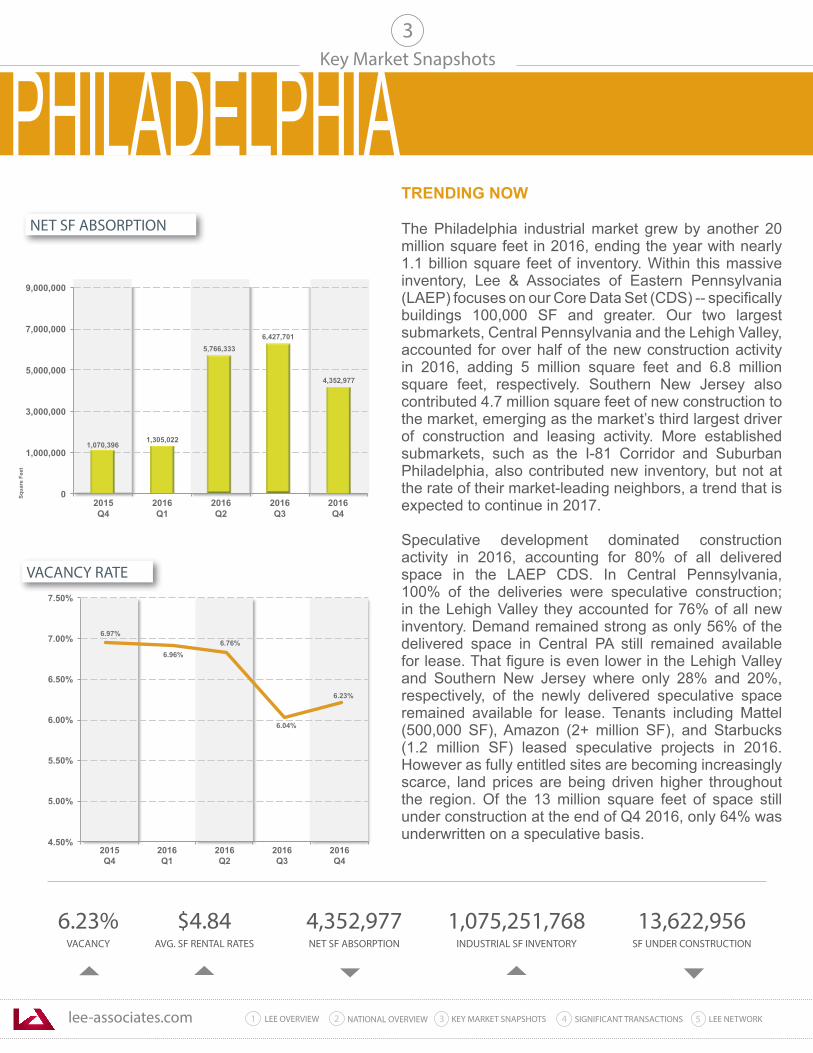
lee-associates.com 31 LEE OVERVIEW KEY MARKET SNAPSHOTS 5 LEE NETWORKNATIONAL OVERVIEW2 4 SIGNIFICANT TRANSACTIONS
Key Market Snapshots
6.23%VACANCY
$4.84AVG. SF RENTAL RATES
4,352,977NET SF ABSORPTION
1,075,251,768INDUSTRIAL SF INVENTORY
13,622,956SF UNDER CONSTRUCTION
3
0
1,000,000
3,000,000
5,000,000
7,000,000
9,000,000
2016 Q4
2015 Q4
2016 Q1
2016 Q2
2016 Q3
Squa
re F
eet
6,427,701
4,352,977
1,070,3961,305,022
5,766,333
5.50%
6.00%
6.50%
7.00%
7.50%
2015Q4
2016 Q1
2016 Q2
2016 Q3
2016 Q4
5.00%
4.50%
6.97% 6.76%
6.96%
6.04%
6.23%
NET SF ABSORPTION
VACANCY RATE
TRENDING NOW The Philadelphia industrial market grew by another 20 million square feet in 2016, ending the year with nearly 1.1 billion square feet of inventory. Within this massive inventory, Lee & Associates of Eastern Pennsylvania (LAEP) focuses on our Core Data Set (CDS) -- specifically buildings 100,000 SF and greater. Our two largest submarkets, Central Pennsylvania and the Lehigh Valley, accounted for over half of the new construction activity in 2016, adding 5 million square feet and 6.8 million square feet, respectively. Southern New Jersey also contributed 4.7 million square feet of new construction to the market, emerging as the market’s third largest driver of construction and leasing activity. More established submarkets, such as the I-81 Corridor and Suburban Philadelphia, also contributed new inventory, but not at the rate of their market-leading neighbors, a trend that is expected to continue in 2017.
Speculative development dominated construction activity in 2016, accounting for 80% of all delivered space in the LAEP CDS. In Central Pennsylvania, 100% of the deliveries were speculative construction; in the Lehigh Valley they accounted for 76% of all new inventory. Demand remained strong as only 56% of the delivered space in Central PA still remained available for lease. That figure is even lower in the Lehigh Valley and Southern New Jersey where only 28% and 20%, respectively, of the newly delivered speculative space remained available for lease. Tenants including Mattel (500,000 SF), Amazon (2+ million SF), and Starbucks (1.2 million SF) leased speculative projects in 2016. However as fully entitled sites are becoming increasingly scarce, land prices are being driven higher throughout the region. Of the 13 million square feet of space still under construction at the end of Q4 2016, only 64% was underwritten on a speculative basis.
PHILADELPHIA
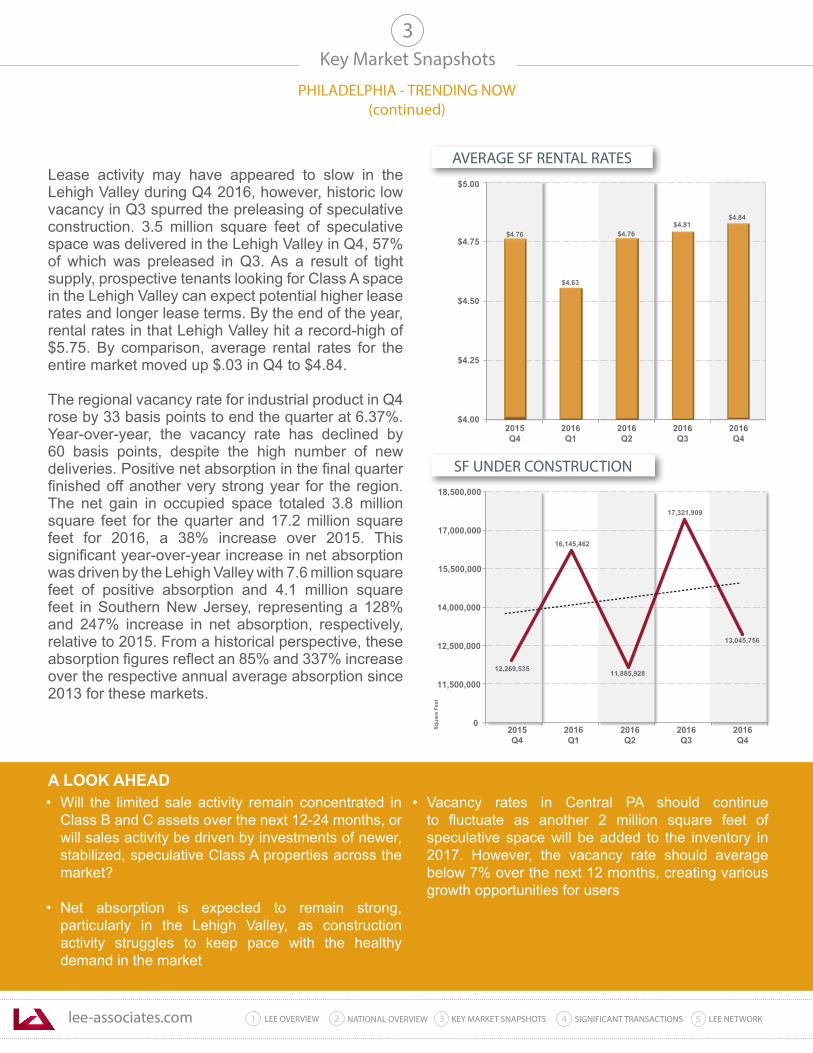
lee-associates.com 31 LEE OVERVIEW KEY MARKET SNAPSHOTS 5 LEE NETWORKNATIONAL OVERVIEW2 4 SIGNIFICANT TRANSACTIONS
Key Market Snapshots
PHILADELPHIA - TRENDING NOW(continued)
3
Lease activity may have appeared to slow in the Lehigh Valley during Q4 2016, however, historic low vacancy in Q3 spurred the preleasing of speculative construction. 3.5 million square feet of speculative space was delivered in the Lehigh Valley in Q4, 57% of which was preleased in Q3. As a result of tight supply, prospective tenants looking for Class A space in the Lehigh Valley can expect potential higher lease rates and longer lease terms. By the end of the year, rental rates in that Lehigh Valley hit a record-high of $5.75. By comparison, average rental rates for the entire market moved up $.03 in Q4 to $4.84.
The regional vacancy rate for industrial product in Q4 rose by 33 basis points to end the quarter at 6.37%. Year-over-year, the vacancy rate has declined by 60 basis points, despite the high number of new deliveries. Positive net absorption in the final quarter finished off another very strong year for the region. The net gain in occupied space totaled 3.8 million square feet for the quarter and 17.2 million square feet for 2016, a 38% increase over 2015. This significant year-over-year increase in net absorption was driven by the Lehigh Valley with 7.6 million square feet of positive absorption and 4.1 million square feet in Southern New Jersey, representing a 128% and 247% increase in net absorption, respectively, relative to 2015. From a historical perspective, these absorption figures reflect an 85% and 337% increase over the respective annual average absorption since 2013 for these markets.
$4.00
$4.25
$4.50
$4.75
$5.00
2015 Q4
2016 Q1
2016 Q2
2016 Q3
2016 Q4
$4.76
$4.63
$4.76 $4.81
$4.84
17,321,909
13,045,756
12,269,535
16,145,462
0
11,500,000
12,500,000
14,000,000
15,500,000
17,000,000
18,500,000
Squa
re F
eet
11,885,928
2015 Q4
2016 Q1
2016 Q2
2016 Q3
2016Q4
SF UNDER CONSTRUCTION
AVERAGE SF RENTAL RATES
• Will the limited sale activity remain concentrated in Class B and C assets over the next 12-24 months, or will sales activity be driven by investments of newer, stabilized, speculative Class A properties across the market?
• Net absorption is expected to remain strong, particularly in the Lehigh Valley, as construction activity struggles to keep pace with the healthy demand in the market
• Vacancy rates in Central PA should continue to fluctuate as another 2 million square feet of speculative space will be added to the inventory in 2017. However, the vacancy rate should average below 7% over the next 12 months, creating various growth opportunities for users
A LOOK AHEAD
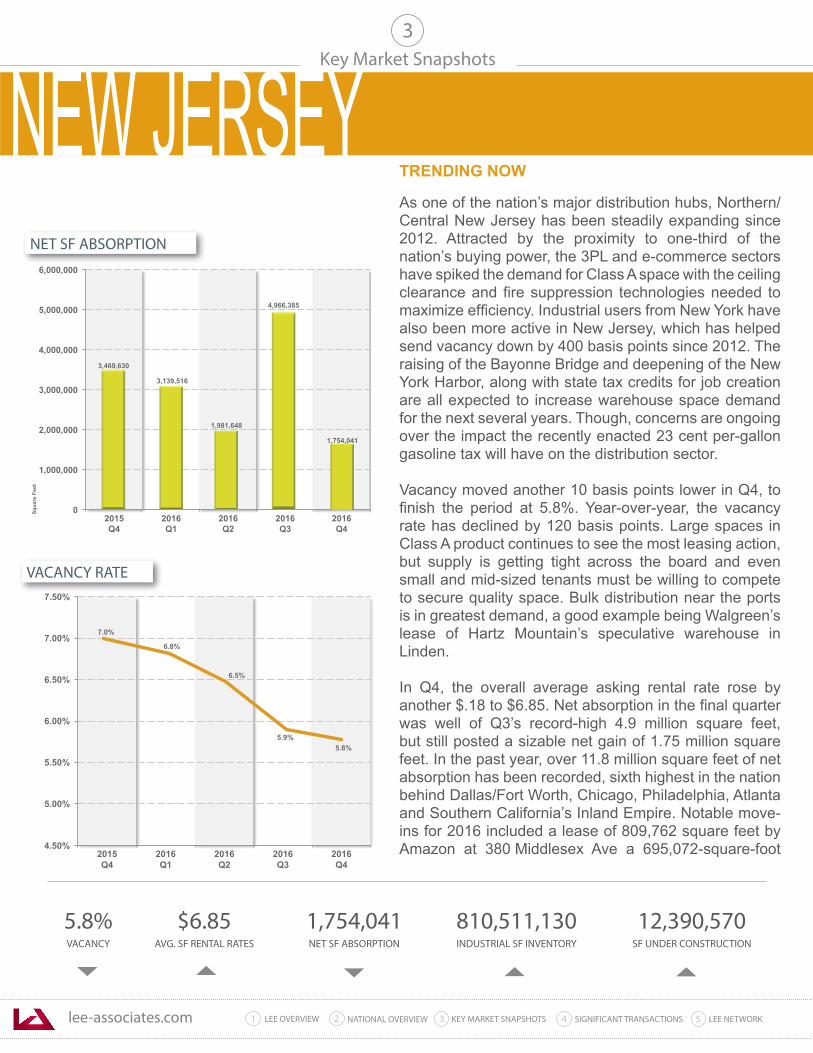
lee-associates.com 31 LEE OVERVIEW KEY MARKET SNAPSHOTS 5 LEE NETWORKNATIONAL OVERVIEW2 4 SIGNIFICANT TRANSACTIONS
Key Market Snapshots
5.8%VACANCY
$6.85AVG. SF RENTAL RATES
1,754,041NET SF ABSORPTION
810,511,130INDUSTRIAL SF INVENTORY
12,390,570SF UNDER CONSTRUCTION
3
0
1,000,000
2,000,000
3,000,000
4,000,000
5,000,000
6,000,000
2016 Q4
2015 Q4
2016 Q1
2016 Q2
2016 Q3
Squa
re F
eet
4,966,385
1,754,041
3,469,630
3,139,516
1,981,648
5.50%
6.00%
6.50%
7.00%
7.50%
2015Q4
2016 Q1
2016 Q2
2016 Q3
2016 Q4
5.00%
4.50%
7.0%
6.5%
6.8%
5.9% 5.8%
NET SF ABSORPTION
VACANCY RATE
TRENDING NOW As one of the nation’s major distribution hubs, Northern/Central New Jersey has been steadily expanding since 2012. Attracted by the proximity to one-third of the nation’s buying power, the 3PL and e-commerce sectors have spiked the demand for Class A space with the ceiling clearance and fire suppression technologies needed to maximize efficiency. Industrial users from New York have also been more active in New Jersey, which has helped send vacancy down by 400 basis points since 2012. The raising of the Bayonne Bridge and deepening of the New York Harbor, along with state tax credits for job creation are all expected to increase warehouse space demand for the next several years. Though, concerns are ongoing over the impact the recently enacted 23 cent per-gallon gasoline tax will have on the distribution sector.
Vacancy moved another 10 basis points lower in Q4, to finish the period at 5.8%. Year-over-year, the vacancy rate has declined by 120 basis points. Large spaces in Class A product continues to see the most leasing action, but supply is getting tight across the board and even small and mid-sized tenants must be willing to compete to secure quality space. Bulk distribution near the ports is in greatest demand, a good example being Walgreen’s lease of Hartz Mountain’s speculative warehouse in Linden.
In Q4, the overall average asking rental rate rose by another $.18 to $6.85. Net absorption in the final quarter was well of Q3’s record-high 4.9 million square feet, but still posted a sizable net gain of 1.75 million square feet. In the past year, over 11.8 million square feet of net absorption has been recorded, sixth highest in the nation behind Dallas/Fort Worth, Chicago, Philadelphia, Atlanta and Southern California’s Inland Empire. Notable move-ins for 2016 included a lease of 809,762 square feet by Amazon at 380 Middlesex Ave a 695,072-square-foot
NEW JERSEY
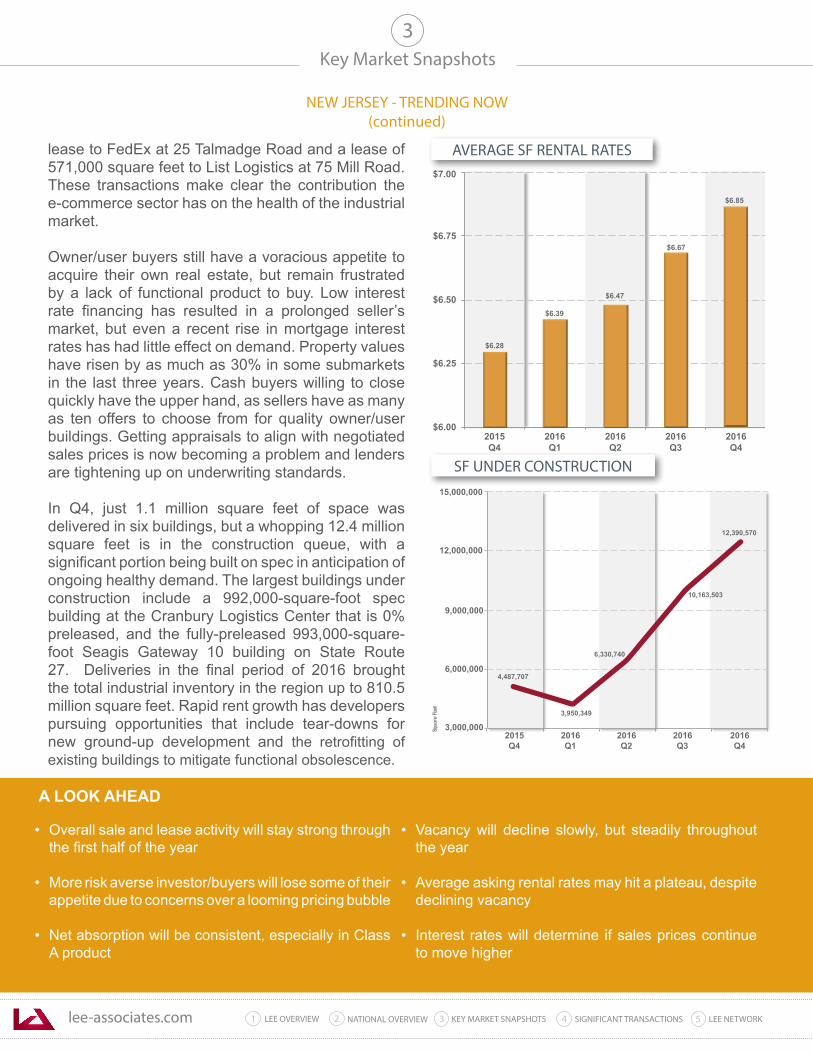
lee-associates.com 31 LEE OVERVIEW KEY MARKET SNAPSHOTS 5 LEE NETWORKNATIONAL OVERVIEW2 4 SIGNIFICANT TRANSACTIONS
• Overall sale and lease activity will stay strong through the first half of the year
• More risk averse investor/buyers will lose some of their appetite due to concerns over a looming pricing bubble
• Net absorption will be consistent, especially in Class A product
• Vacancy will decline slowly, but steadily throughout the year
• Average asking rental rates may hit a plateau, despite declining vacancy
• Interest rates will determine if sales prices continue to move higher
Key Market Snapshots
NEW JERSEY - TRENDING NOW(continued)
3
lease to FedEx at 25 Talmadge Road and a lease of 571,000 square feet to List Logistics at 75 Mill Road. These transactions make clear the contribution the e-commerce sector has on the health of the industrial market.
Owner/user buyers still have a voracious appetite to acquire their own real estate, but remain frustrated by a lack of functional product to buy. Low interest rate financing has resulted in a prolonged seller’s market, but even a recent rise in mortgage interest rates has had little effect on demand. Property values have risen by as much as 30% in some submarkets in the last three years. Cash buyers willing to close quickly have the upper hand, as sellers have as many as ten offers to choose from for quality owner/user buildings. Getting appraisals to align with negotiated sales prices is now becoming a problem and lenders are tightening up on underwriting standards.
In Q4, just 1.1 million square feet of space was delivered in six buildings, but a whopping 12.4 million square feet is in the construction queue, with a significant portion being built on spec in anticipation of ongoing healthy demand. The largest buildings under construction include a 992,000-square-foot spec building at the Cranbury Logistics Center that is 0% preleased, and the fully-preleased 993,000-square-foot Seagis Gateway 10 building on State Route 27. Deliveries in the final period of 2016 brought the total industrial inventory in the region up to 810.5 million square feet. Rapid rent growth has developers pursuing opportunities that include tear-downs for new ground-up development and the retrofitting of existing buildings to mitigate functional obsolescence.
A LOOK AHEAD
$6.00
$6.25
$6.50
$6.75
$7.00
2015 Q4
2016 Q1
2016 Q2
2016 Q3
2016 Q4
$6.28
$6.39
$6.47
$6.67
$6.85
12,390,570
4,487,707
3,950,349
6,330,740
6,000,000
9,000,000
12,000,000
15,000,000
Squ a
re F
eet
10,163,503
2016 Q4
2015 Q4
2016 Q1
2016 Q2
2016Q3
3,000,000
SF UNDER CONSTRUCTION
AVERAGE SF RENTAL RATES
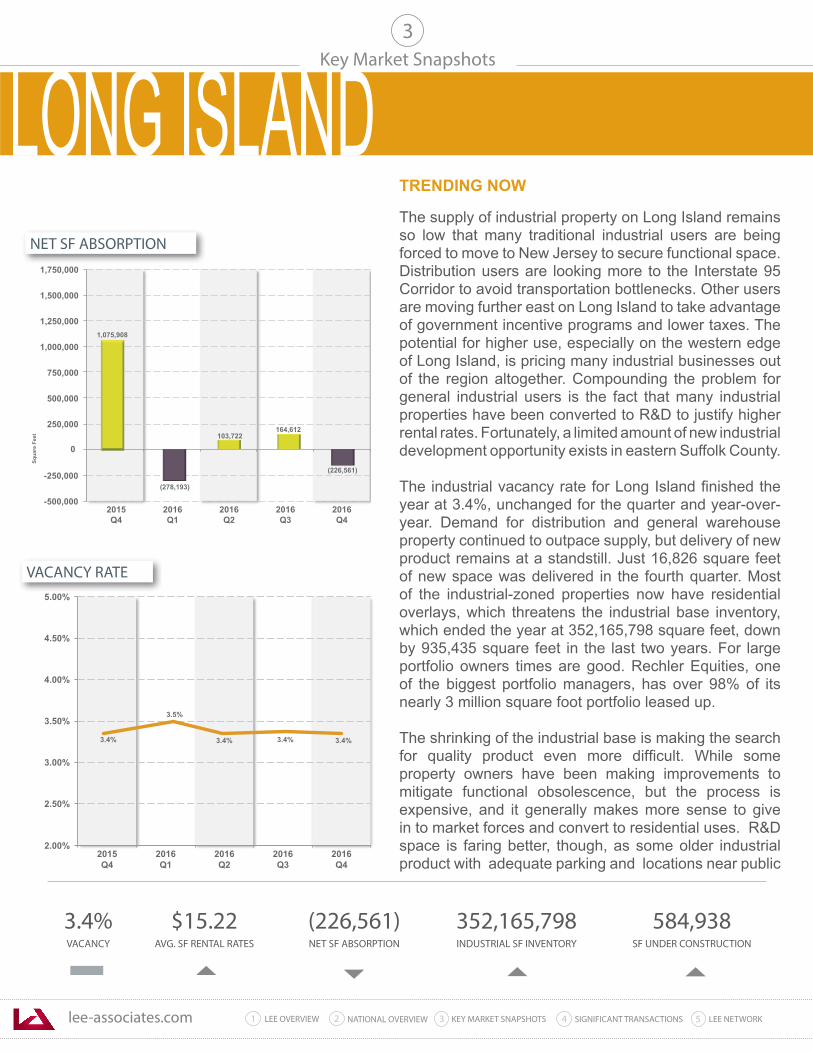
lee-associates.com 31 LEE OVERVIEW KEY MARKET SNAPSHOTS 5 LEE NETWORKNATIONAL OVERVIEW2 4 SIGNIFICANT TRANSACTIONS
Key Market Snapshots
3.4%VACANCY
$15.22AVG. SF RENTAL RATES
(226,561)NET SF ABSORPTION
352,165,798INDUSTRIAL SF INVENTORY
584,938SF UNDER CONSTRUCTION
3
-500,000
-250,000
250,000
500,000
750,000
1,000,000
1,250,000
1,500,000
1,750,000
Squa
re F
eet
2015 Q4
2016 Q1
2016 Q2
2016 Q3
2016 Q4
(226,561)
1,075,908
0
164,612 103,722
(278,193)
3.00%
3.50%
4.00%
4.50%
5.00%
2015Q4
2016 Q1
2016 Q2
2016 Q3
2016 Q4
2.50%
2.00%
3.4% 3.4%
3.5%
3.4% 3.4%
NET SF ABSORPTION
VACANCY RATE
TRENDING NOW The supply of industrial property on Long Island remains so low that many traditional industrial users are being forced to move to New Jersey to secure functional space. Distribution users are looking more to the Interstate 95 Corridor to avoid transportation bottlenecks. Other users are moving further east on Long Island to take advantage of government incentive programs and lower taxes. The potential for higher use, especially on the western edge of Long Island, is pricing many industrial businesses out of the region altogether. Compounding the problem for general industrial users is the fact that many industrial properties have been converted to R&D to justify higher rental rates. Fortunately, a limited amount of new industrial development opportunity exists in eastern Suffolk County.
The industrial vacancy rate for Long Island finished the year at 3.4%, unchanged for the quarter and year-over-year. Demand for distribution and general warehouse property continued to outpace supply, but delivery of new product remains at a standstill. Just 16,826 square feet of new space was delivered in the fourth quarter. Most of the industrial-zoned properties now have residential overlays, which threatens the industrial base inventory, which ended the year at 352,165,798 square feet, down by 935,435 square feet in the last two years. For large portfolio owners times are good. Rechler Equities, one of the biggest portfolio managers, has over 98% of its nearly 3 million square foot portfolio leased up.
The shrinking of the industrial base is making the search for quality product even more difficult. While some property owners have been making improvements to mitigate functional obsolescence, but the process is expensive, and it generally makes more sense to give in to market forces and convert to residential uses. R&D space is faring better, though, as some older industrial product with adequate parking and locations near public
LONG ISLAND
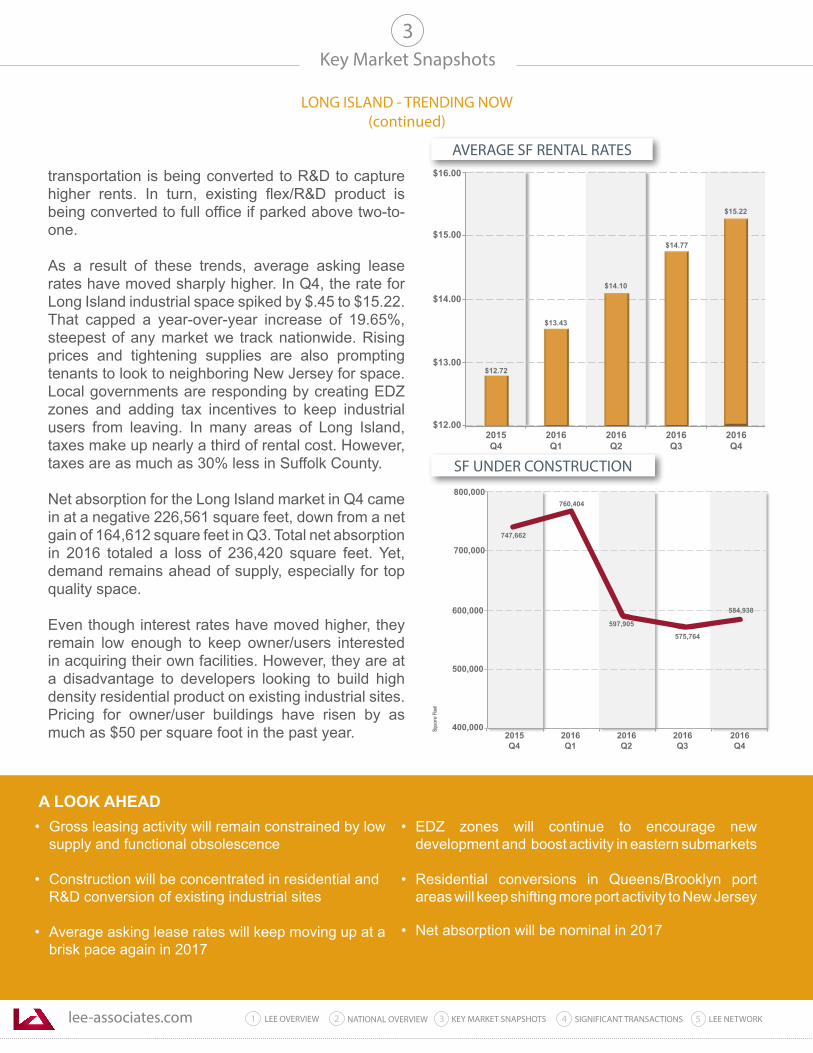
lee-associates.com 31 LEE OVERVIEW KEY MARKET SNAPSHOTS 5 LEE NETWORKNATIONAL OVERVIEW2 4 SIGNIFICANT TRANSACTIONS
• Gross leasing activity will remain constrained by low supply and functional obsolescence
• Construction will be concentrated in residential and R&D conversion of existing industrial sites
• Average asking lease rates will keep moving up at a brisk pace again in 2017
• EDZ zones will continue to encourage new development and boost activity in eastern submarkets
• Residential conversions in Queens/Brooklyn port areas will keep shifting more port activity to New Jersey
• Net absorption will be nominal in 2017
Key Market Snapshots
LONG ISLAND - TRENDING NOW(continued)
3
transportation is being converted to R&D to capture higher rents. In turn, existing flex/R&D product is being converted to full office if parked above two-to-one. As a result of these trends, average asking lease rates have moved sharply higher. In Q4, the rate for Long Island industrial space spiked by $.45 to $15.22. That capped a year-over-year increase of 19.65%, steepest of any market we track nationwide. Rising prices and tightening supplies are also prompting tenants to look to neighboring New Jersey for space. Local governments are responding by creating EDZ zones and adding tax incentives to keep industrial users from leaving. In many areas of Long Island, taxes make up nearly a third of rental cost. However, taxes are as much as 30% less in Suffolk County.
Net absorption for the Long Island market in Q4 came in at a negative 226,561 square feet, down from a net gain of 164,612 square feet in Q3. Total net absorption in 2016 totaled a loss of 236,420 square feet. Yet, demand remains ahead of supply, especially for top quality space.
Even though interest rates have moved higher, they remain low enough to keep owner/users interested in acquiring their own facilities. However, they are at a disadvantage to developers looking to build high density residential product on existing industrial sites. Pricing for owner/user buildings have risen by as much as $50 per square foot in the past year.
A LOOK AHEAD
$12.00
$13.00
$14.00
$15.00
$16.00
2015 Q4
2016 Q1
2016 Q2
2016 Q3
2016 Q4
$12.72
$13.43
$14.10
$14.77
$15.22
584,938
747,662
760,404
597,905
500,000
600,000
700,000
800,000
Squ a
re F
eet
575,764
2016 Q4
2015 Q4
2016 Q1
2016 Q2
2016Q3
400,000
SF UNDER CONSTRUCTION
AVERAGE SF RENTAL RATES
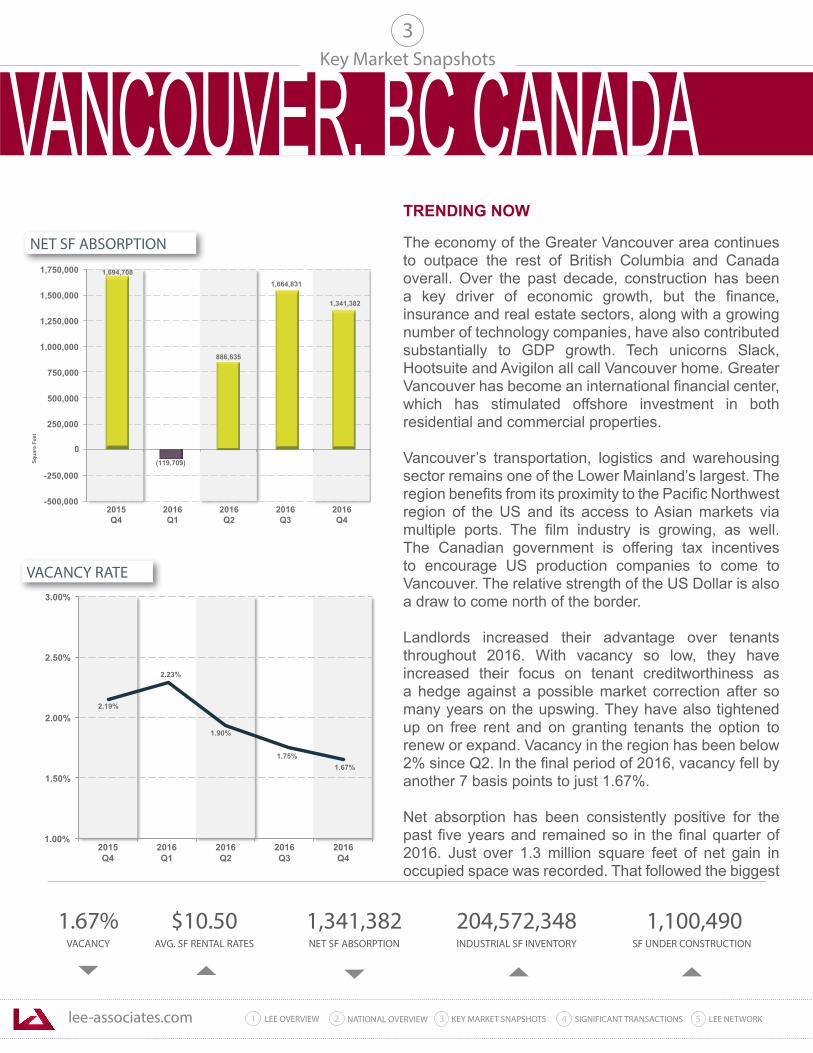
lee-associates.com 31 LEE OVERVIEW KEY MARKET SNAPSHOTS 5 LEE NETWORKNATIONAL OVERVIEW2 4 SIGNIFICANT TRANSACTIONS
Key Market Snapshots
1.67%VACANCY
$10.50AVG. SF RENTAL RATES
1,341,382NET SF ABSORPTION
204,572,348INDUSTRIAL SF INVENTORY
1,100,490SF UNDER CONSTRUCTION
3
-500,000
-250,000
250,000
500,000
750,000
1,000,000
1,250,000
1,500,000
1,750,000
Squa
re F
eet
2015 Q4
2016 Q1
2016 Q2
2016 Q3
2016 Q4
1,341,382
1,694,708
0 (119,709)
886,635
1,664,831
1.75%
2.19%
2.23%
1.00%
1.50%
2.00%
2.50%
3.00%
2015 Q4
2016 Q1
2016 Q2
2016 Q3
2016 Q4
1.67%
1.90%
NET SF ABSORPTION
VACANCY RATE
TRENDING NOW The economy of the Greater Vancouver area continues to outpace the rest of British Columbia and Canada overall. Over the past decade, construction has been a key driver of economic growth, but the finance, insurance and real estate sectors, along with a growing number of technology companies, have also contributed substantially to GDP growth. Tech unicorns Slack, Hootsuite and Avigilon all call Vancouver home. Greater Vancouver has become an international financial center, which has stimulated offshore investment in both residential and commercial properties.
Vancouver’s transportation, logistics and warehousing sector remains one of the Lower Mainland’s largest. The region benefits from its proximity to the Pacific Northwest region of the US and its access to Asian markets via multiple ports. The film industry is growing, as well. The Canadian government is offering tax incentives to encourage US production companies to come to Vancouver. The relative strength of the US Dollar is also a draw to come north of the border.
Landlords increased their advantage over tenants throughout 2016. With vacancy so low, they have increased their focus on tenant creditworthiness as a hedge against a possible market correction after so many years on the upswing. They have also tightened up on free rent and on granting tenants the option to renew or expand. Vacancy in the region has been below 2% since Q2. In the final period of 2016, vacancy fell by another 7 basis points to just 1.67%.
Net absorption has been consistently positive for the past five years and remained so in the final quarter of 2016. Just over 1.3 million square feet of net gain in occupied space was recorded. That followed the biggest
VANCOUVER, BC CANADA
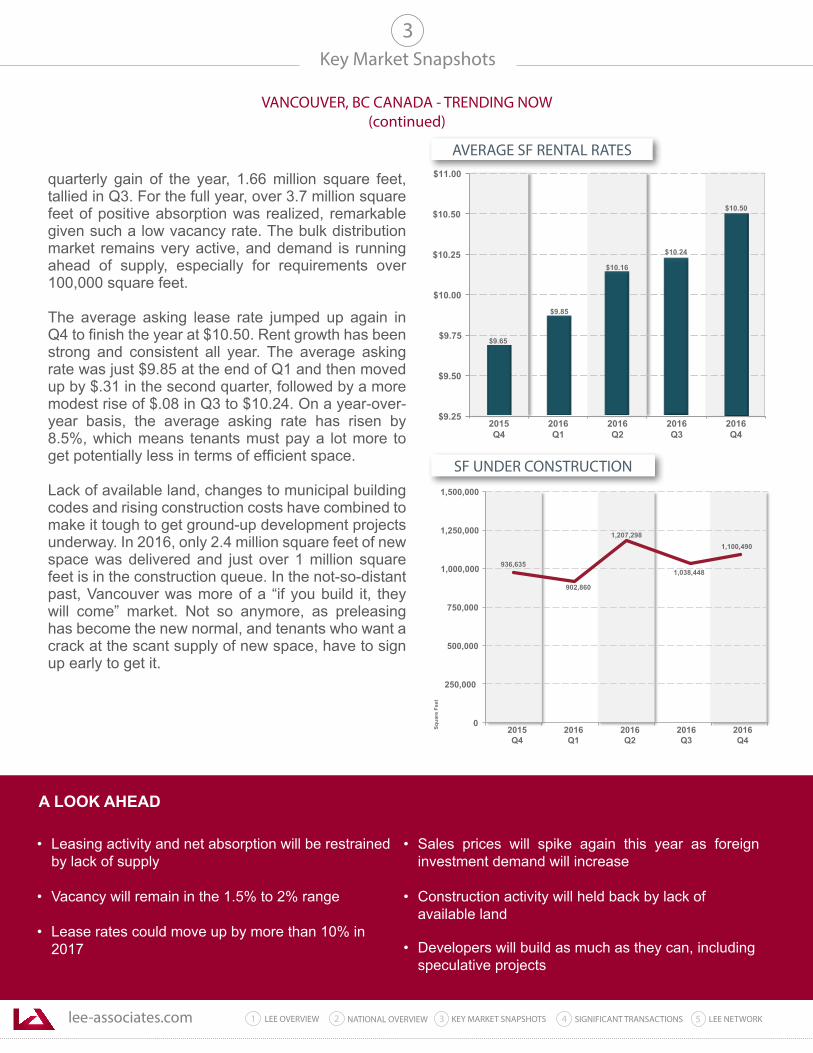
lee-associates.com 31 LEE OVERVIEW KEY MARKET SNAPSHOTS 5 LEE NETWORKNATIONAL OVERVIEW2 4 SIGNIFICANT TRANSACTIONS
• Leasing activity and net absorption will be restrained by lack of supply
• Vacancy will remain in the 1.5% to 2% range
• Lease rates could move up by more than 10% in 2017
• Sales prices will spike again this year as foreign investment demand will increase
• Construction activity will held back by lack of available land
• Developers will build as much as they can, including speculative projects
Key Market Snapshots
VANCOUVER, BC CANADA - TRENDING NOW(continued)
3
quarterly gain of the year, 1.66 million square feet, tallied in Q3. For the full year, over 3.7 million square feet of positive absorption was realized, remarkable given such a low vacancy rate. The bulk distribution market remains very active, and demand is running ahead of supply, especially for requirements over 100,000 square feet. The average asking lease rate jumped up again in Q4 to finish the year at $10.50. Rent growth has been strong and consistent all year. The average asking rate was just $9.85 at the end of Q1 and then moved up by $.31 in the second quarter, followed by a more modest rise of $.08 in Q3 to $10.24. On a year-over-year basis, the average asking rate has risen by 8.5%, which means tenants must pay a lot more to get potentially less in terms of efficient space.
Lack of available land, changes to municipal building codes and rising construction costs have combined to make it tough to get ground-up development projects underway. In 2016, only 2.4 million square feet of new space was delivered and just over 1 million square feet is in the construction queue. In the not-so-distant past, Vancouver was more of a “if you build it, they will come” market. Not so anymore, as preleasing has become the new normal, and tenants who want a crack at the scant supply of new space, have to sign up early to get it.
A LOOK AHEAD
$9.25
$9.50
$9.75
$10.00
$10.25
$10.50
$11.00
2015 Q4
2016 Q1
2016 Q2
2016 Q3
2016 Q4
$10.24
$10.50
$9.85
$9.65
$10.16
1,038,448
1,100,490
936,635
902,860
0
250,000
500,000
750,000
1,000,000
1,250,000
1,500,000
Squa
re F
eet
1,207,298
2015 Q4
2016 Q1
2016 Q2
2016 Q3
2016Q4
SF UNDER CONSTRUCTION
AVERAGE SF RENTAL RATES
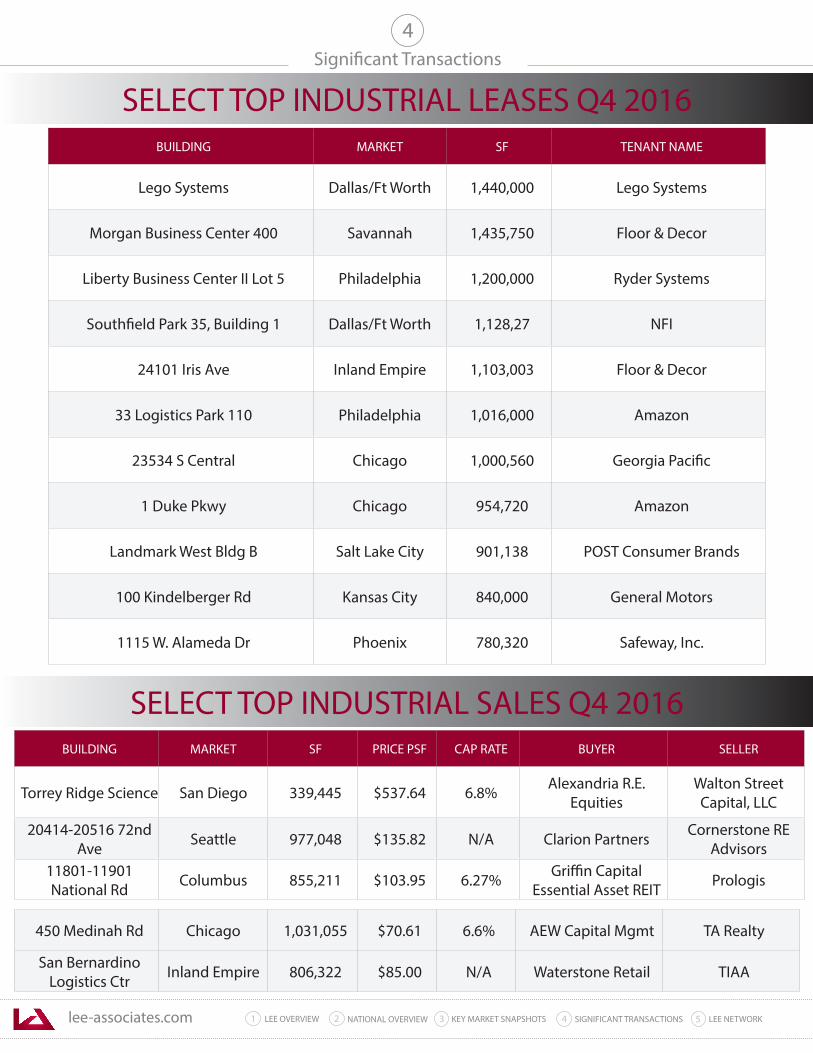
lee-associates.com 31 LEE OVERVIEW KEY MARKET SNAPSHOTS 5 LEE NETWORKNATIONAL OVERVIEW2 4 SIGNIFICANT TRANSACTIONS
4Significant Transactions
BUILDING MARKET SF TENANT NAME
Lego Systems Dallas/Ft Worth 1,440,000 Lego Systems
Morgan Business Center 400 Savannah 1,435,750 Floor & Decor
Liberty Business Center II Lot 5 Philadelphia 1,200,000 Ryder Systems
Southfield Park 35, Building 1 Dallas/Ft Worth 1,128,27 NFI
24101 Iris Ave Inland Empire 1,103,003 Floor & Decor
33 Logistics Park 110 Philadelphia 1,016,000 Amazon
23534 S Central Chicago 1,000,560 Georgia Pacific
1 Duke Pkwy Chicago 954,720 Amazon
Landmark West Bldg B Salt Lake City 901,138 POST Consumer Brands
100 Kindelberger Rd Kansas City 840,000 General Motors
1115 W. Alameda Dr Phoenix 780,320 Safeway, Inc.
SELECT TOP INDUSTRIAL LEASES Q4 2016
SELECT TOP INDUSTRIAL SALES Q4 2016BUILDING MARKET SF PRICE PSF CAP RATE BUYER SELLER
Torrey Ridge Science San Diego 339,445 $537.64 6.8% Alexandria R.E. Equities
Walton Street Capital, LLC
20414-20516 72nd Ave Seattle 977,048 $135.82 N/A Clarion Partners Cornerstone RE
Advisors11801-11901 National Rd Columbus 855,211 $103.95 6.27% Griffin Capital
Essential Asset REIT Prologis
450 Medinah Rd Chicago 1,031,055 $70.61 6.6% AEW Capital Mgmt TA Realty
San Bernardino Logistics Ctr Inland Empire 806,322 $85.00 N/A Waterstone Retail TIAA
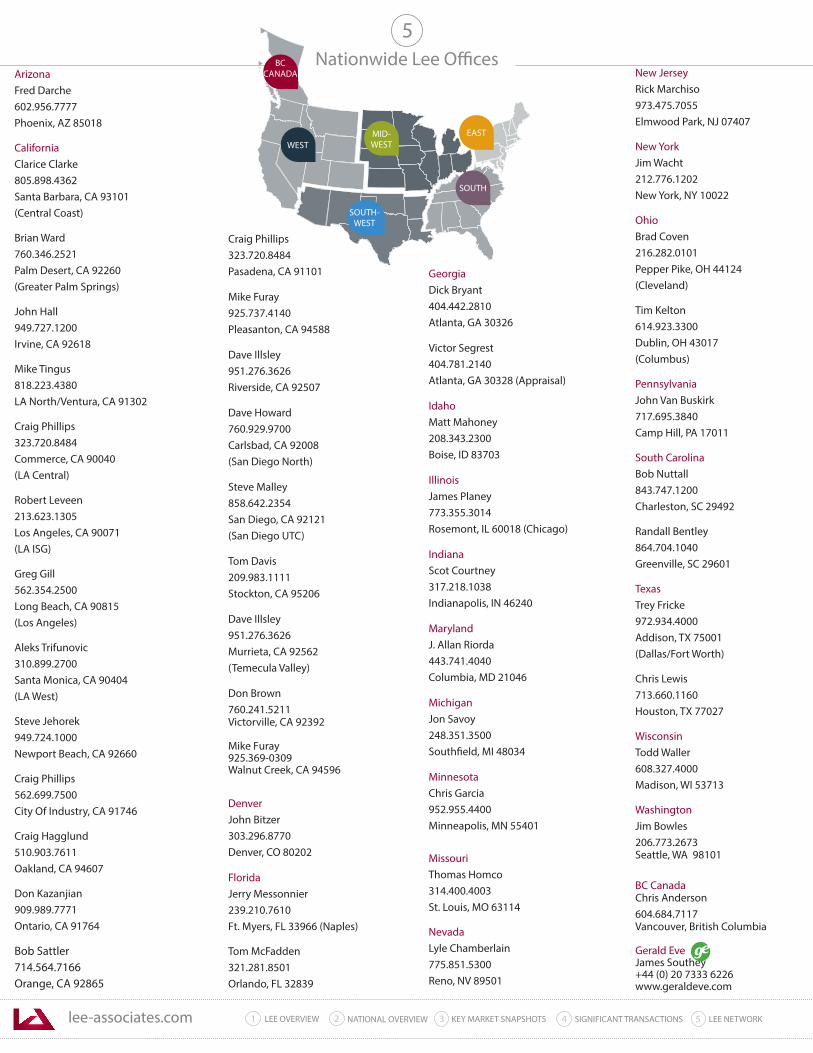
WESTMID-WEST
SOUTH
SOUTH-WEST
EAST
BCCANADA
lee-associates.com 31 LEE OVERVIEW KEY MARKET SNAPSHOTS 5 LEE NETWORKNATIONAL OVERVIEW2 4 SIGNIFICANT TRANSACTIONS
5Nationwide Lee Offices
ArizonaFred Darche602.956.7777Phoenix, AZ 85018
CaliforniaClarice Clarke805.898.4362Santa Barbara, CA 93101(Central Coast)
Brian Ward760.346.2521Palm Desert, CA 92260(Greater Palm Springs)
John Hall949.727.1200Irvine, CA 92618
Mike Tingus818.223.4380LA North/Ventura, CA 91302
Craig Phillips323.720.8484Commerce, CA 90040(LA Central)
Robert Leveen213.623.1305Los Angeles, CA 90071(LA ISG)
Greg Gill562.354.2500Long Beach, CA 90815(Los Angeles)
Aleks Trifunovic310.899.2700Santa Monica, CA 90404(LA West)
Steve Jehorek949.724.1000Newport Beach, CA 92660
Craig Phillips562.699.7500City Of Industry, CA 91746
Craig Hagglund510.903.7611Oakland, CA 94607
Don Kazanjian909.989.7771Ontario, CA 91764
Bob Sattler714.564.7166Orange, CA 92865
GeorgiaDick Bryant404.442.2810Atlanta, GA 30326
Victor Segrest404.781.2140 Atlanta, GA 30328 (Appraisal)
IdahoMatt Mahoney208.343.2300Boise, ID 83703
IllinoisJames Planey773.355.3014Rosemont, IL 60018 (Chicago)
IndianaScot Courtney317.218.1038Indianapolis, IN 46240
MarylandJ. Allan Riorda443.741.4040Columbia, MD 21046
MichiganJon Savoy248.351.3500Southfield, MI 48034
MinnesotaChris Garcia952.955.4400Minneapolis, MN 55401
MissouriThomas Homco314.400.4003St. Louis, MO 63114
NevadaLyle Chamberlain775.851.5300Reno, NV 89501
New JerseyRick Marchiso973.475.7055Elmwood Park, NJ 07407
New YorkJim Wacht212.776.1202New York, NY 10022
OhioBrad Coven216.282.0101Pepper Pike, OH 44124(Cleveland)
Tim Kelton614.923.3300Dublin, OH 43017(Columbus)
PennsylvaniaJohn Van Buskirk 717.695.3840Camp Hill, PA 17011
South CarolinaBob Nuttall843.747.1200Charleston, SC 29492
Randall Bentley864.704.1040Greenville, SC 29601
TexasTrey Fricke972.934.4000Addison, TX 75001(Dallas/Fort Worth)
Chris Lewis713.660.1160Houston, TX 77027
WisconsinTodd Waller608.327.4000Madison, WI 53713
WashingtonJim Bowles206.773.2673Seattle, WA 98101
BC CanadaChris Anderson604.684.7117Vancouver, British Columbia
Gerald EveJames Southey+44 (0) 20 7333 6226www.geraldeve.com
Craig Phillips323.720.8484Pasadena, CA 91101
Mike Furay925.737.4140Pleasanton, CA 94588
Dave Illsley951.276.3626Riverside, CA 92507
Dave Howard760.929.9700Carlsbad, CA 92008(San Diego North)
Steve Malley858.642.2354San Diego, CA 92121(San Diego UTC)
Tom Davis209.983.1111Stockton, CA 95206
Dave Illsley951.276.3626Murrieta, CA 92562(Temecula Valley)
Don Brown760.241.5211Victorville, CA 92392
Mike Furay925.369-0309Walnut Creek, CA 94596
DenverJohn Bitzer303.296.8770Denver, CO 80202
FloridaJerry Messonnier239.210.7610Ft. Myers, FL 33966 (Naples)
Tom McFadden321.281.8501Orlando, FL 32839
lee-associates.comThe information and details contained herein have been obtained from third-party sources believed to be reliable, however, Lee & Associates has not independently verified its accuracy.
Lee & Associates makes no representations, guarantees, or express or implied warranties of any kind regarding the accuracy or completeness of the information and details provided herein, including but not limited to, the implied warranty of suitability and fitness for a particular purpose. Interested parties should perform their own due diligence regarding the accuracy of the information.
The information provided herein, including any sale or lease terms, is being provided subject to errors, omissions, changes of price or conditions, prior sale or lease, and withdrawal without notice.
Third-party data sources: CoStar Group, Inc., The Economist, U.S. Bureau of Economic Analysis, U.S. Bureau of Labor Statistics, Congressional Budget Office, European Central Bank, GlobeSt.com, CoStar Property and Lee Proprietary Data. © Copyright 2016 Lee & Associates all rights reserved. Third-party Image sources: sorbis/shutterstock.com, shutterstock.com
The Lee Industrial Brief
Q42016