Embed Size (px)
Citation preview
Monthly Indicators A RESEARCH TOOL PROVIDED BY THE GREATER BOSTON ASSOCIATION OF REALTORS®
March 2015 Quick Facts
23456789
10111213
Housing Affordability Index
Inventory of Homes for Sale
Months Supply of Inventory
Days On Market Until Sale
Percent of Original List Price Received
City of Boston Overview
Pending Sales
New Listings
Data is refreshed regularly to capture changes in market activity so figures shown may be different than previously reported. Current as of April 16, 2015. All data from MLS PropertyInformation Network, Inc. Provided by Greater Boston Association of REALTORS® and the Massachusetts Association of REALTORS®. Powered by 10K Research and Marketing.
- 1.0%Year-Over-Year(YoY) Change inClosed Sales
Single-Family Only
All expectations in 2015 are for a healthy and energetic selling season. National stories have been highlighting an increase in new construction sales and pending sales, but national stories are not always readily applied to the local scene. All the same, if ever there was a year to list or purchase a home, wider economic factors seem to indicate that this is the one.
New Listings in the Greater Boston region were down 12.7 percent for single-family homes and 4.3 percent for condominiums. Closed Sales decreased 1.0 percent for single-family homes and 17.9 percent for condominiums.
The Median Sales Price was up 1.6 percent to $433,750 for single-family properties and 6.9 percent to $449,000 for condominiums. Months Supply of Inventory decreased 26.5 percent for single-family units and 15.0 percent for townhouse-condo units.
On average, more people are employed and making more money than they were at this time last year. The jobs picture, as a whole, looks promising. Employment drives home-buying activity, so it is ever critical to watch labor statistics as a key indicator for the residential real estate market. Coupled with the mostly positive jobs picture, it is widely expected that mortgage rates will remain as they are for at least the first two quarters of the year.
- 17.9%Year-Over-Year(YoY) Change inClosed Sales
Condominium Only
- 9.3%Year-Over-Year(YoY) Change inClosed SalesAll Properties
Single-Family Market Overview
Condominium Market Overview
Closed Sales
Median Sales Price

Single-Family Market Overview Key market metrics for the current month and year-to-date figures for Single-Family Homes Only.
Key Metrics Historical Sparklines Mar-2014 Mar-2015 + / – YTD 2014 YTD 2015 + / –
2,000 + 1.9%
All data from MLS Property Information Network, Inc. Provided by the Greater Boston Association of REALTORS® and the Massachusetts Association of REALTORS®. Powered by 10K Research and Marketing. | 2
New Listings 1,776 1,550 - 12.7% 3,854 3,146 - 18.4%
Closed Sales 711 704 - 1.0% 1,963
$439,700 + 5.1%
89
101 104
98
-- -- --
3,075 2,237
3.2 - 26.5%
$433,750 + 1.6% $418,255
88
Housing Affordability Index
Inventory of Homes for Sale
Months Supply of Inventory 4.3
$427,000
Pending Sales
Median Sales Price
- 1.0%2,6691,255 1,226 - 2.3% 2,695
- 27.3% -- --
+ 3.2% 103 103 - 0.3%
--
95.8% 95.7%
+ 11.7%
- 0.2%Percent of OriginalList Price Received
Days on Market Until Sale
96.4%
+ 12.7%
- 0.2%
100
96.2%
3-2012 3-2013 3-2014 3-2015
3-2012 3-2013 3-2014 3-2015
3-2012 3-2013 3-2014 3-2015
3-2012 3-2013 3-2014 3-2015
3-2012 3-2013 3-2014 3-2015
3-2012 3-2013 3-2014 3-2015
3-2012 3-2013 3-2014 3-2015
3-2012 3-2013 3-2014 3-2015
3-2012 3-2013 3-2014 3-2015

Condominium Market Overview Key market metrics for the current month and year-to-date figures for Condominium Properties Only.
Key Metrics Historical Sparklines Mar-2014 Mar-2015 + / – YTD 2014 YTD 2015 + / –
- 15.0%
All data from MLS Property Information Network, Inc. Provided by the Greater Boston Association of REALTORS® and the Massachusetts Association of REALTORS®. Powered by 10K Research and Marketing. | 3
New Listings 1,305 1,249 - 4.3% 3,024 2,570
+ 0.1%
Pending Sales 1,053 1,057 + 0.4% 2,431 2,208 - 9.2%
Percent of OriginalList Price Received
98.7% 98.5% - 0.2% 98.0% 98.1%
--
Days on Market Until Sale 69 69 - 0.8% 71 70 - 1.7%
Months Supply of Inventory 2.4 2.1 - 15.0% -- --
- 2.9%
Inventory of Homes for Sale 1,679 1,171 - 30.3% -- -- --
Housing Affordability Index 103 101 - 2.0% 107 104
- 12.7%
Median Sales Price $420,000 $449,000 + 6.9% $402,000 $433,680 + 7.9%
Closed Sales 692 568 - 17.9% 1,710 1,493
3-2012 3-2013 3-2014 3-2015
3-2012 3-2013 3-2014 3-2015
3-2012 3-2013 3-2014 3-2015
3-2012 3-2013 3-2014 3-2015
3-2012 3-2013 3-2014 3-2015
3-2012 3-2013 3-2014 3-2015
3-2012 3-2013 3-2014 3-2015
3-2012 3-2013 3-2014 3-2015
3-2012 3-2013 3-2014 3-2015

Closed Sales A count of the actual sales that have closed in a given month.
Single-FamilyYoY
ChangeCondominium
YoYChange
Apr-2014 862 - 6.4% 867 + 2.0%
May-2014 1,206 - 9.3% 999 - 10.2%
Jun-2014 1,683 - 3.7% 1,267 - 2.5%
Jul-2014 1,738 - 1.5% 1,195 - 9.6%
Aug-2014 1,516 - 10.5% 1,138 - 14.8%
Sep-2014 1,067 - 6.3% 862 - 7.4%
Oct-2014 1,045 - 4.0% 863 + 6.8%
Nov-2014 959 - 7.9% 650 - 14.4%
Dec-2014 1,116 + 3.2% 810 - 3.0%
Jan-2015 742 + 1.4% 478 - 15.8%
Feb-2015 554 + 6.5% 447 - 0.7%
Mar-2015 704 - 1.0% 568 - 17.9%
Total 13,192 - 4.2% 10,144 - 7.5%
All data from MLS Property Information Network, Inc. Provided by the Greater Boston Association of REALTORS® and the Massachusetts Association of REALTORS®. Powered by 10K Research and Marketing. | 4
786
668711 692704
568
Single-Family Condominium
March
200
400
600
800
1,000
1,200
1,400
1,600
1,800
Jan-2003 Jan-2004 Jan-2005 Jan-2006 Jan-2007 Jan-2008 Jan-2009 Jan-2010 Jan-2011 Jan-2012 Jan-2013 Jan-2014 Jan-2015
Historical Closed Sales Activity Single-Family Condominium
-17.9%+3.6%-9.5%
20152014 20152014
2,083
1,671
1,963
1,710
2,000
1,493
Single-Family Condominium
Year to Date
-12.7%+2.3%-5.8%
20152014 20152014
-1.0% +1.9%
2013 2013 2013 2013

Median Sales Price Median price point for all closed sales, not accounting for seller concessions, in a given month.
Single-FamilyYoY
ChangeCondominium
YoYChange
Apr-2014 $440,000 + 4.8% $397,000 + 7.3%
May-2014 $464,250 + 6.1% $417,500 + 5.3%
Jun-2014 $510,000 + 5.2% $439,900 + 6.7%
Jul-2014 $505,000 + 7.4% $419,000 + 7.4%
Aug-2014 $490,000 + 4.3% $419,000 + 3.5%
Sep-2014 $424,900 - 1.5% $414,500 + 4.9%
Oct-2014 $435,302 + 3.6% $394,000 - 0.6%
Nov-2014 $450,000 + 8.4% $414,000 + 4.8%
Dec-2014 $443,500 + 2.0% $425,000 + 4.9%
Jan-2015 $446,000 + 6.7% $441,500 + 10.5%
Feb-2015 $438,500 + 7.6% $400,000 + 2.6%
Mar-2015 $433,750 + 1.6% $449,000 + 6.9%
Median $465,000 + 5.2% $420,000 + 5.3%
All data from MLS Property Information Network, Inc. Provided by the Greater Boston Association of REALTORS® and the Massachusetts Association of REALTORS®. Powered by 10K Research and Marketing. | 5
$378,000$390,000
$427,000 $420,000$433,750
$449,000
Single-Family Condominium
March
$250,000
$300,000
$350,000
$400,000
$450,000
$500,000
$550,000
$600,000
Jan-2003 Jan-2004 Jan-2005 Jan-2006 Jan-2007 Jan-2008 Jan-2009 Jan-2010 Jan-2011 Jan-2012 Jan-2013 Jan-2014 Jan-2015
Historical Median Sales Price Single-Family Condominium
+6.9%+7.7%+13.0%
20152014 20152014
$375,000$361,500
$418,255$402,000
$439,700 $433,680
Single-Family Condominium
Year to Date
+7.9%+11.2%+11.5%
20152014 20152014
+1.6% +5.1%
2013 2013 2013 2013
Housing Affordability Index
Single-FamilyYoY
ChangeCondominium
YoYChange
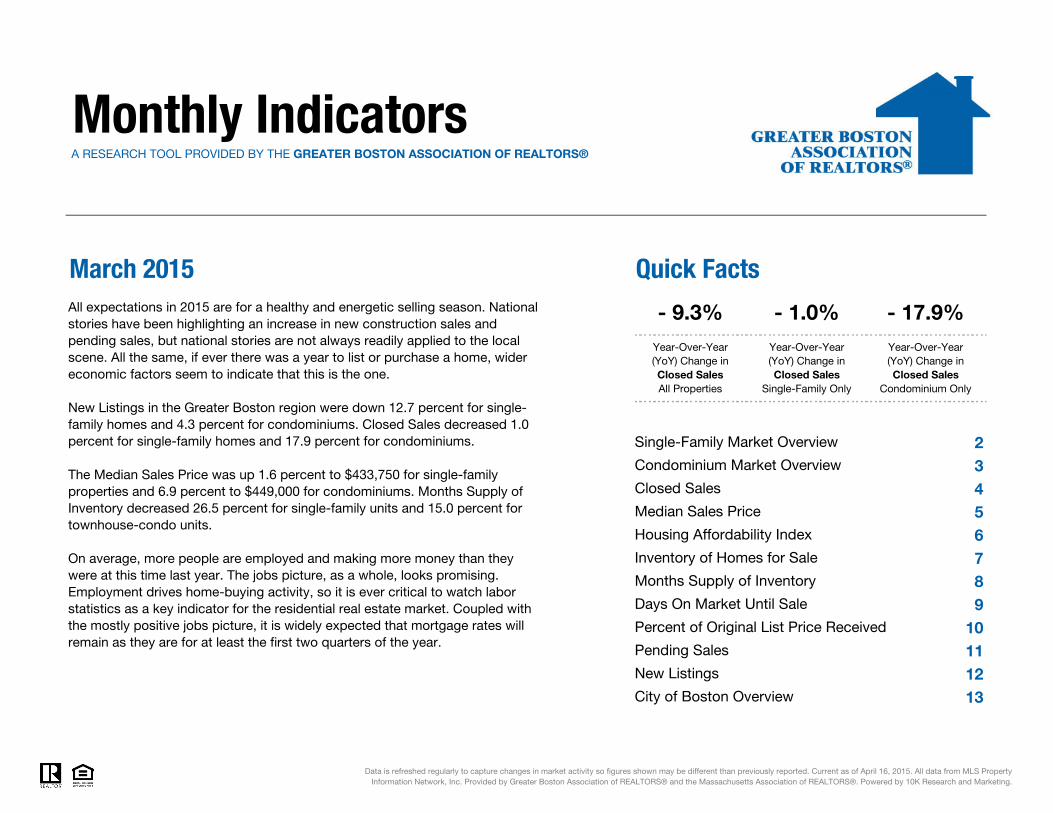
Apr-2014 98 - 14.8% 108 - 16.8%
May-2014 95 - 10.5% 106 - 9.8%
Jun-2014 87 - 4.5% 100 - 5.9%
Jul-2014 87 - 7.4% 105 - 7.4%
Aug-2014 90 - 2.9% 106 - 2.2%
Sep-2014 103 + 0.3% 106 - 5.9%
Oct-2014 102 - 3.1% 113 + 1.1%
Nov-2014 99 - 12.1% 108 - 9.1%
Dec-2014 101 - 1.4% 106 - 4.2%
Jan-2015 103 + 1.0% 104 - 2.5%
Feb-2015 105 - 1.2% 115 + 3.7%
Mar-2015 104 + 3.2% 101 - 2.0%
Average 98 -4.4% 106 -5.1%
This index measures housing affordability for the region. An index of 120 means the median household income was 120% of what is necessary to qualify for the median-priced home under prevailing interest rates. A higher number means greater affordability.
All data from MLS Property Information Network, Inc. Provided by the Greater Boston Association of REALTORS® and the Massachusetts Association of REALTORS®. Powered by 10K Research and Marketing. | 6
125 121
101 103104 101
Single-Family Condominium
March
50
60
70
80
90
100
110
120
130
140
150
Jan-2004 Jan-2005 Jan-2006 Jan-2007 Jan-2008 Jan-2009 Jan-2010 Jan-2011 Jan-2012 Jan-2013 Jan-2014 Jan-2015
Historical Housing Affordability Index Single-Family Condominium
-2.0%-15.3%-19.2%
126131
103 107103 104
Single-Family Condominium
Year to Date
-2.9%-17.9%-18.2%
20152014 20152014 20152014 20152014
+3.2% -0.3%
2013 2013 2013 2013
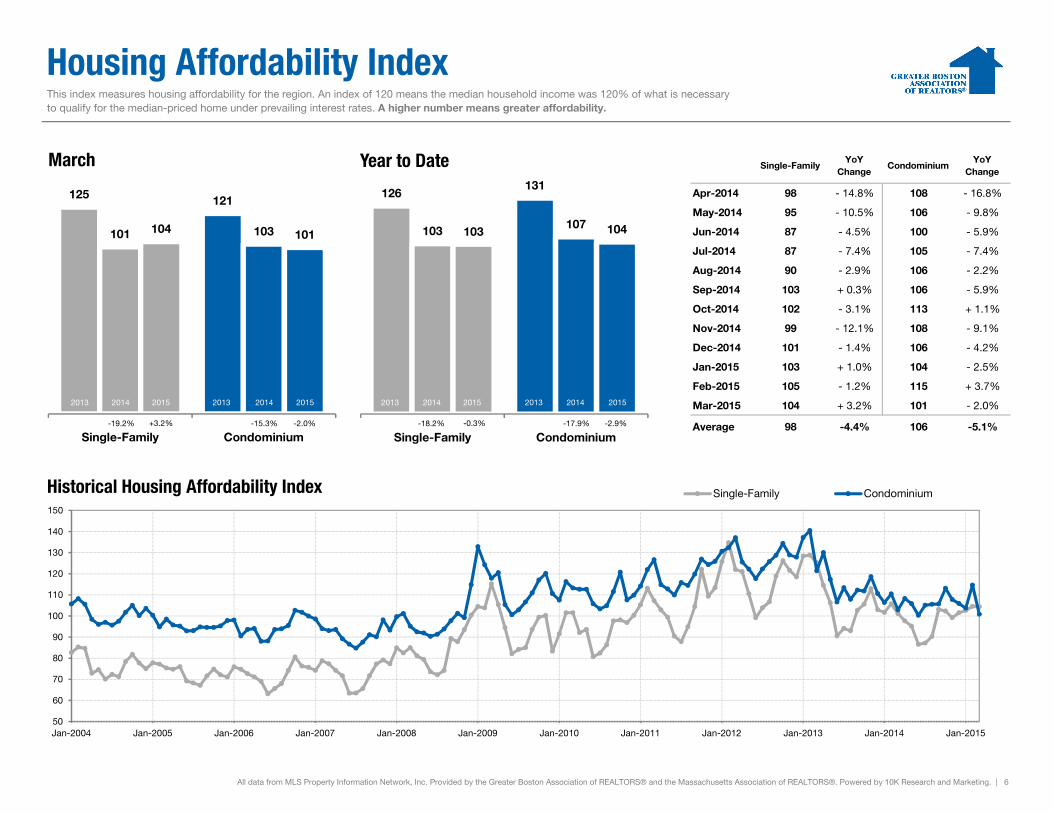
Inventory of Homes for Sale The number of properties available for sale in active status at the end of a given month.
Single-FamilyYoY
ChangeCondominium
YoYChange
Apr-2014 3,587 - 2.0% 1,868 - 15.2%
May-2014 4,151 + 3.5% 2,029 - 12.5%
Jun-2014 4,210 + 4.8% 1,994 - 11.8%
Jul-2014 4,131 + 6.6% 1,912 - 8.7%
Aug-2014 3,986 + 4.5% 1,743 - 12.9%
Sep-2014 4,254 + 4.9% 1,931 - 13.3%
Oct-2014 4,119 + 6.0% 1,931 - 10.4%
Nov-2014 3,406 + 1.2% 1,604 - 12.4%
Dec-2014 2,642 - 1.8% 1,235 - 17.4%
Jan-2015 2,471 - 7.6% 1,223 - 18.7%
Feb-2015 2,195 - 22.2% 1,132 - 28.1%
Mar-2015 2,237 - 27.3% 1,171 - 30.3%
Average 3,449 - 1.3% 1,648 - 15.3%
All data from MLS Property Information Network, Inc. Provided by the Greater Boston Association of REALTORS® and the Massachusetts Association of REALTORS®. Powered by 10K Research and Marketing. | 7
3,211
1,921
3,075
1,679
2,237
1,171
Single-Family Condominium
March
1,000
2,000
3,000
4,000
5,000
6,000
7,000
8,000
9,000
10,000
Jan-2003 Jan-2004 Jan-2005 Jan-2006 Jan-2007 Jan-2008 Jan-2009 Jan-2010 Jan-2011 Jan-2012 Jan-2013 Jan-2014 Jan-2015
Historical Inventory of Homes for Sale Single-Family Condominium
-30.3%-12.6%-4.2%
20152014 20152014
-27.3%
2013 2013
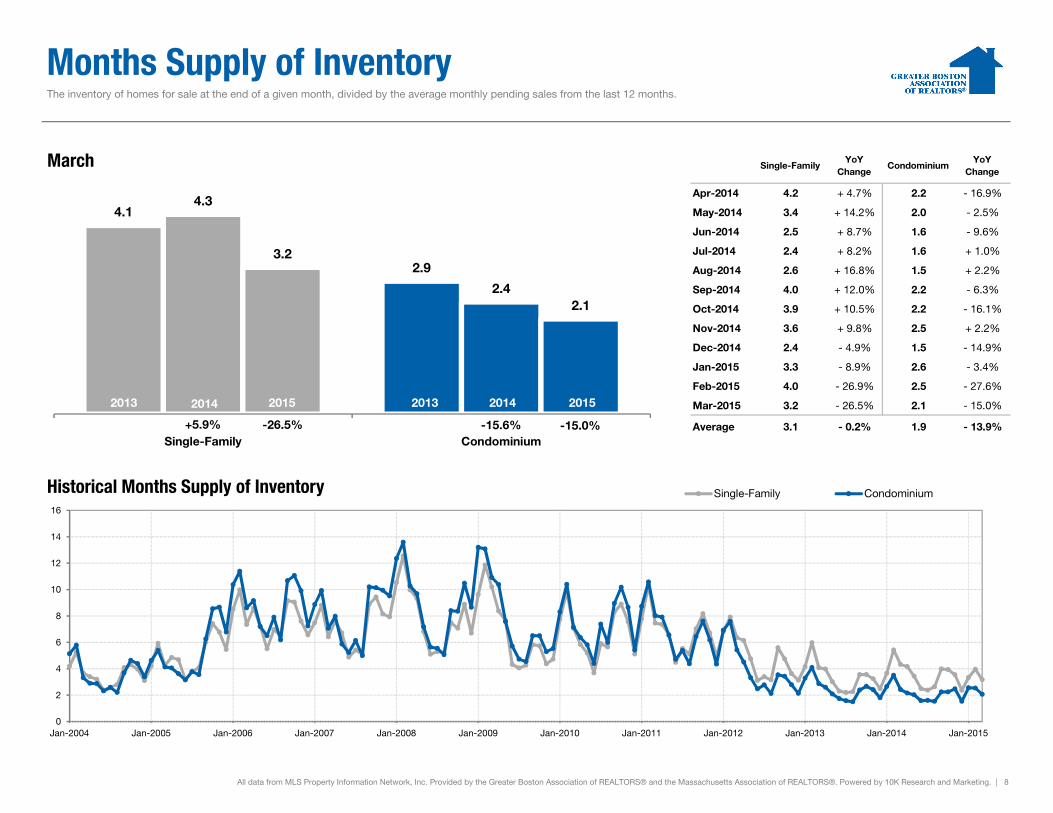
Months Supply of Inventory The inventory of homes for sale at the end of a given month, divided by the average monthly pending sales from the last 12 months.
Single-FamilyYoY
ChangeCondominium
YoYChange
Apr-2014 4.2 + 4.7% 2.2 - 16.9%
May-2014 3.4 + 14.2% 2.0 - 2.5%
Jun-2014 2.5 + 8.7% 1.6 - 9.6%
Jul-2014 2.4 + 8.2% 1.6 + 1.0%
Aug-2014 2.6 + 16.8% 1.5 + 2.2%
Sep-2014 4.0 + 12.0% 2.2 - 6.3%
Oct-2014 3.9 + 10.5% 2.2 - 16.1%
Nov-2014 3.6 + 9.8% 2.5 + 2.2%
Dec-2014 2.4 - 4.9% 1.5 - 14.9%
Jan-2015 3.3 - 8.9% 2.6 - 3.4%
Feb-2015 4.0 - 26.9% 2.5 - 27.6%
Mar-2015 3.2 - 26.5% 2.1 - 15.0%
Average 3.1 - 0.2% 1.9 - 13.9%
All data from MLS Property Information Network, Inc. Provided by the Greater Boston Association of REALTORS® and the Massachusetts Association of REALTORS®. Powered by 10K Research and Marketing. | 8
4.1
2.9
4.3
2.4
3.2
2.1
Single-Family Condominium
March
0
2
4
6
8
10
12
14
16
Jan-2004 Jan-2005 Jan-2006 Jan-2007 Jan-2008 Jan-2009 Jan-2010 Jan-2011 Jan-2012 Jan-2013 Jan-2014 Jan-2015
Historical Months Supply of Inventory Single-Family Condominium
-15.0%-15.6%+5.9%
20152014 20152014
-26.5%
2013 2013
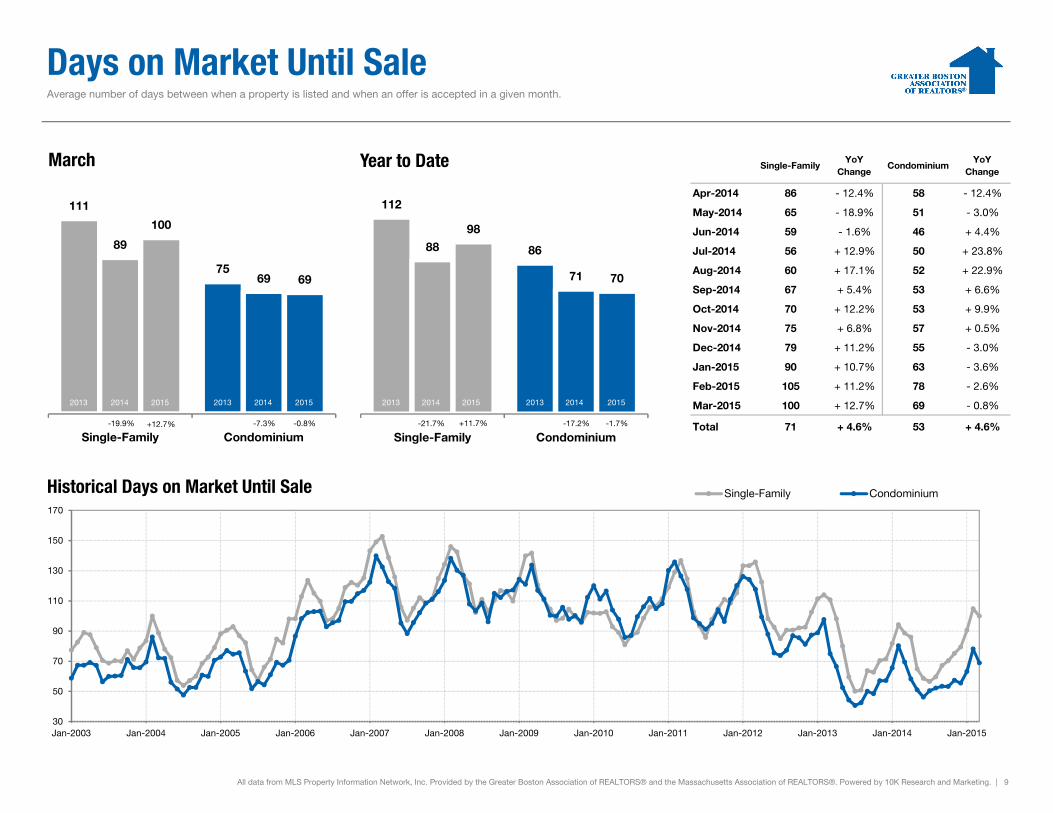
Days on Market Until Sale Average number of days between when a property is listed and when an offer is accepted in a given month.
Single-FamilyYoY
ChangeCondominium
YoYChange
Apr-2014 86 - 12.4% 58 - 12.4%
May-2014 65 - 18.9% 51 - 3.0%
Jun-2014 59 - 1.6% 46 + 4.4%
Jul-2014 56 + 12.9% 50 + 23.8%
Aug-2014 60 + 17.1% 52 + 22.9%
Sep-2014 67 + 5.4% 53 + 6.6%
Oct-2014 70 + 12.2% 53 + 9.9%
Nov-2014 75 + 6.8% 57 + 0.5%
Dec-2014 79 + 11.2% 55 - 3.0%
Jan-2015 90 + 10.7% 63 - 3.6%
Feb-2015 105 + 11.2% 78 - 2.6%
Mar-2015 100 + 12.7% 69 - 0.8%
Total 71 + 4.6% 53 + 4.6%
All data from MLS Property Information Network, Inc. Provided by the Greater Boston Association of REALTORS® and the Massachusetts Association of REALTORS®. Powered by 10K Research and Marketing. | 9
111
75
89
69
100
69
Single-Family Condominium
March
30
50
70
90
110
130
150
170
Jan-2003 Jan-2004 Jan-2005 Jan-2006 Jan-2007 Jan-2008 Jan-2009 Jan-2010 Jan-2011 Jan-2012 Jan-2013 Jan-2014 Jan-2015
Historical Days on Market Until Sale Single-Family Condominium
-0.8%-7.3%-19.9%
112
8688
71
98
70
Single-Family Condominium
Year to Date
-1.7%-17.2%-21.7%
20152014 20152014 20152014 20152014
+12.7% +11.7%
2013 2013 2013 2013
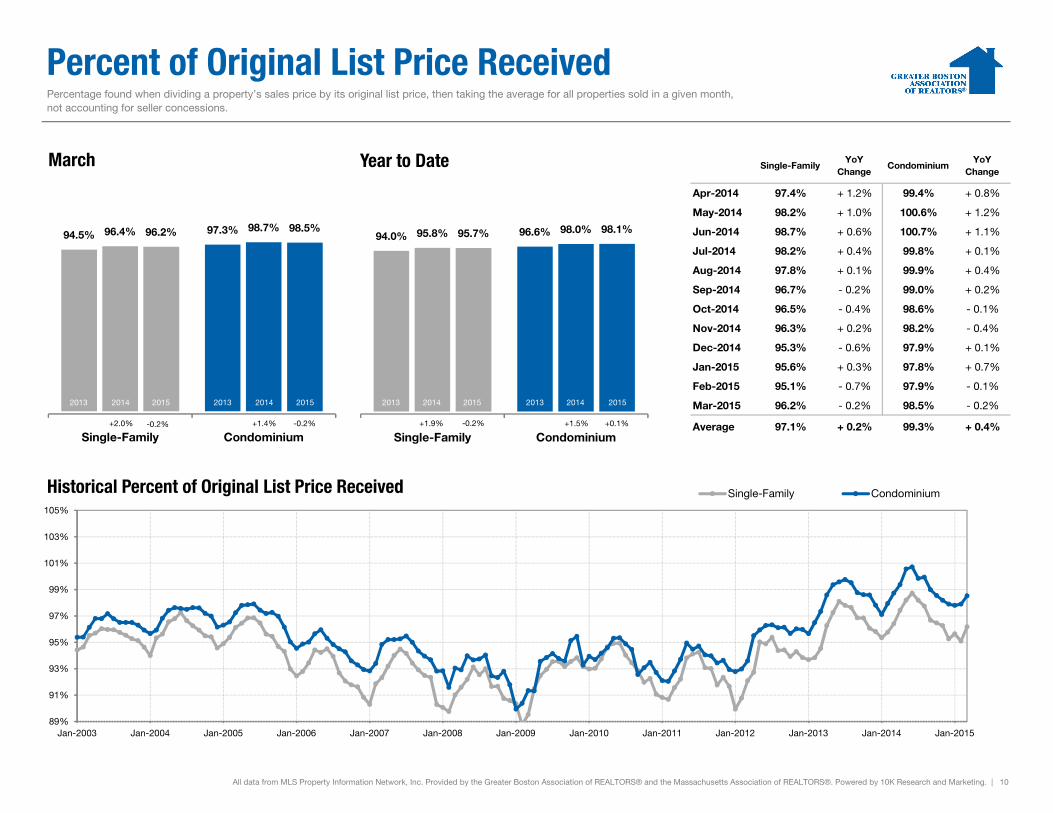
Percent of Original List Price Received
Single-FamilyYoY
ChangeCondominium
YoYChange
Apr-2014 97.4% + 1.2% 99.4% + 0.8%
May-2014 98.2% + 1.0% 100.6% + 1.2%
Jun-2014 98.7% + 0.6% 100.7% + 1.1%
Jul-2014 98.2% + 0.4% 99.8% + 0.1%
Aug-2014 97.8% + 0.1% 99.9% + 0.4%
Sep-2014 96.7% - 0.2% 99.0% + 0.2%
Oct-2014 96.5% - 0.4% 98.6% - 0.1%
Nov-2014 96.3% + 0.2% 98.2% - 0.4%
Dec-2014 95.3% - 0.6% 97.9% + 0.1%
Jan-2015 95.6% + 0.3% 97.8% + 0.7%
Feb-2015 95.1% - 0.7% 97.9% - 0.1%
Mar-2015 96.2% - 0.2% 98.5% - 0.2%
Average 97.1% + 0.2% 99.3% + 0.4%
All data from MLS Property Information Network, Inc. Provided by the Greater Boston Association of REALTORS® and the Massachusetts Association of REALTORS®. Powered by 10K Research and Marketing. | 10
Percentage found when dividing a property’s sales price by its original list price, then taking the average for all properties sold in a given month, not accounting for seller concessions.
94.5% 97.3%96.4% 98.7%96.2% 98.5%
Single-Family Condominium
March
89%
91%
93%
95%
97%
99%
101%
103%
105%
Jan-2003 Jan-2004 Jan-2005 Jan-2006 Jan-2007 Jan-2008 Jan-2009 Jan-2010 Jan-2011 Jan-2012 Jan-2013 Jan-2014 Jan-2015
Historical Percent of Original List Price Received Single-Family Condominium
-0.2%+1.4%+2.0%
94.0% 96.6%95.8% 98.0%95.7% 98.1%
Single-Family Condominium
Year to Date
+0.1%+1.5%+1.9%
20152014 20152014 20152014 20152014
-0.2% -0.2%
2013 2013 2013 2013

Pending Sales A count of the properties in UAG status between the first and last day in a given month, regardless of current status (based on Off Market Date).
Single-FamilyYoY
ChangeCondominium
YoYChange
Apr-2014 1,478 - 10.3% 1,225 - 7.0%
May-2014 1,616 - 7.8% 1,130 - 14.5%
Jun-2014 1,516 - 1.3% 1,142 - 0.1%
Jul-2014 1,195 - 0.8% 929 - 7.1%
Aug-2014 999 - 9.2% 722 - 9.6%
Sep-2014 1,064 + 0.6% 836 + 2.5%
Oct-2014 1,181 + 3.6% 827 - 4.1%
Nov-2014 927 + 5.0% 657 - 2.1%
Dec-2014 669 + 12.4% 454 + 3.4%
Jan-2015 741 + 14.7% 568 - 10.1%
Feb-2015 702 - 11.6% 583 - 21.8%
Mar-2015 1,226 - 2.3% 1,057 + 0.4%
Total 13,314 - 2.2% 10,130 - 6.2%
All data from MLS Property Information Network, Inc. Provided by the Greater Boston Association of REALTORS® and the Massachusetts Association of REALTORS®. Powered by 10K Research and Marketing. | 11
1,383
1,2121,255
1,053
1,226
1,057
Single-Family Condominium
March
200
400
600
800
1,000
1,200
1,400
1,600
Jan-2003 Jan-2004 Jan-2005 Jan-2006 Jan-2007 Jan-2008 Jan-2009 Jan-2010 Jan-2011 Jan-2012 Jan-2013 Jan-2014 Jan-2015
Historical Pending Sales Activity Single-Family Condominium
+0.4%-13.1%-9.3%
3,025
2,6502,6952,431
2,669
2,208
Single-Family Condominium
Year to Date
-9.2%-8.3%-10.9%
20152014 20152014 20152014 20152014
-2.3% -1.0%
2013 2013 2013 2013
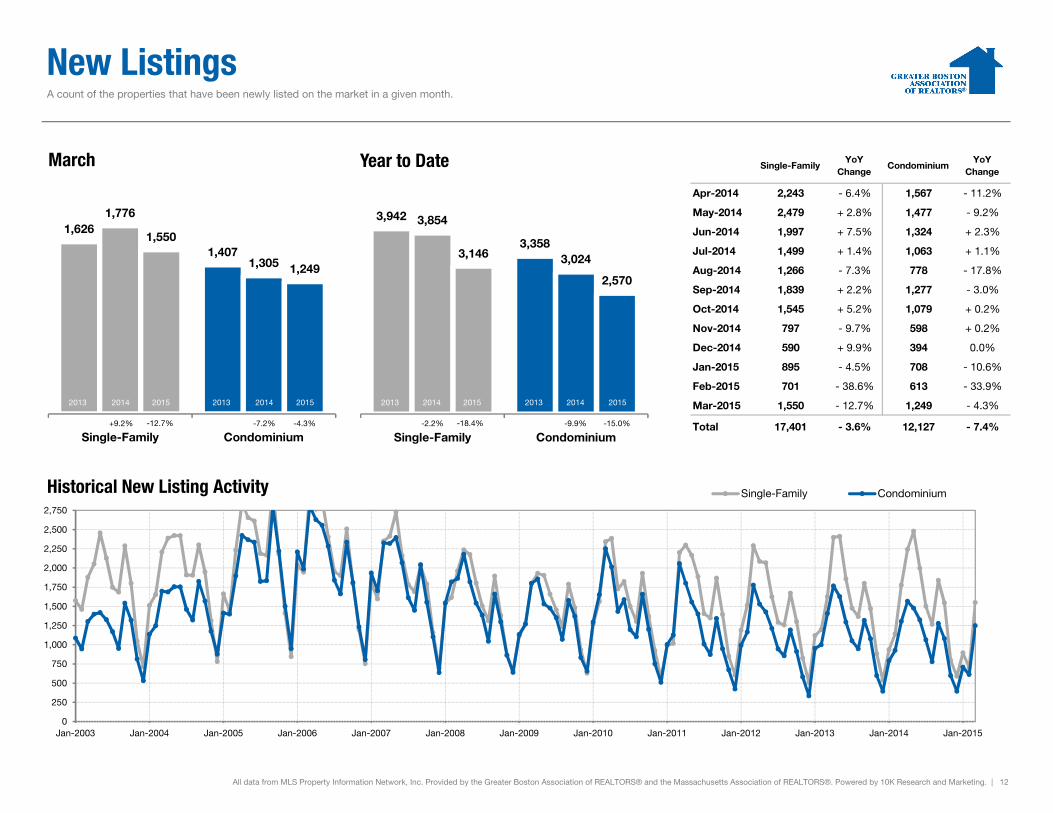
New Listings A count of the properties that have been newly listed on the market in a given month.
Single-FamilyYoY
ChangeCondominium
YoYChange
Apr-2014 2,243 - 6.4% 1,567 - 11.2%
May-2014 2,479 + 2.8% 1,477 - 9.2%
Jun-2014 1,997 + 7.5% 1,324 + 2.3%
Jul-2014 1,499 + 1.4% 1,063 + 1.1%
Aug-2014 1,266 - 7.3% 778 - 17.8%
Sep-2014 1,839 + 2.2% 1,277 - 3.0%
Oct-2014 1,545 + 5.2% 1,079 + 0.2%
Nov-2014 797 - 9.7% 598 + 0.2%
Dec-2014 590 + 9.9% 394 0.0%
Jan-2015 895 - 4.5% 708 - 10.6%
Feb-2015 701 - 38.6% 613 - 33.9%
Mar-2015 1,550 - 12.7% 1,249 - 4.3%
Total 17,401 - 3.6% 12,127 - 7.4%
All data from MLS Property Information Network, Inc. Provided by the Greater Boston Association of REALTORS® and the Massachusetts Association of REALTORS®. Powered by 10K Research and Marketing. | 12
1,626
1,407
1,776
1,305
1,550
1,249
Single-Family Condominium
March
0
250
500
750
1,000
1,250
1,500
1,750
2,000
2,250
2,500
2,750
Jan-2003 Jan-2004 Jan-2005 Jan-2006 Jan-2007 Jan-2008 Jan-2009 Jan-2010 Jan-2011 Jan-2012 Jan-2013 Jan-2014 Jan-2015
Historical New Listing Activity Single-Family Condominium
-4.3%-7.2%+9.2%
3,942
3,358
3,854
3,0243,146
2,570
Single-Family Condominium
Year to Date
-15.0%-9.9%-2.2%
20152014 20152014 20152014 20152014
-12.7% -18.4%
2013 2013 2013 2013
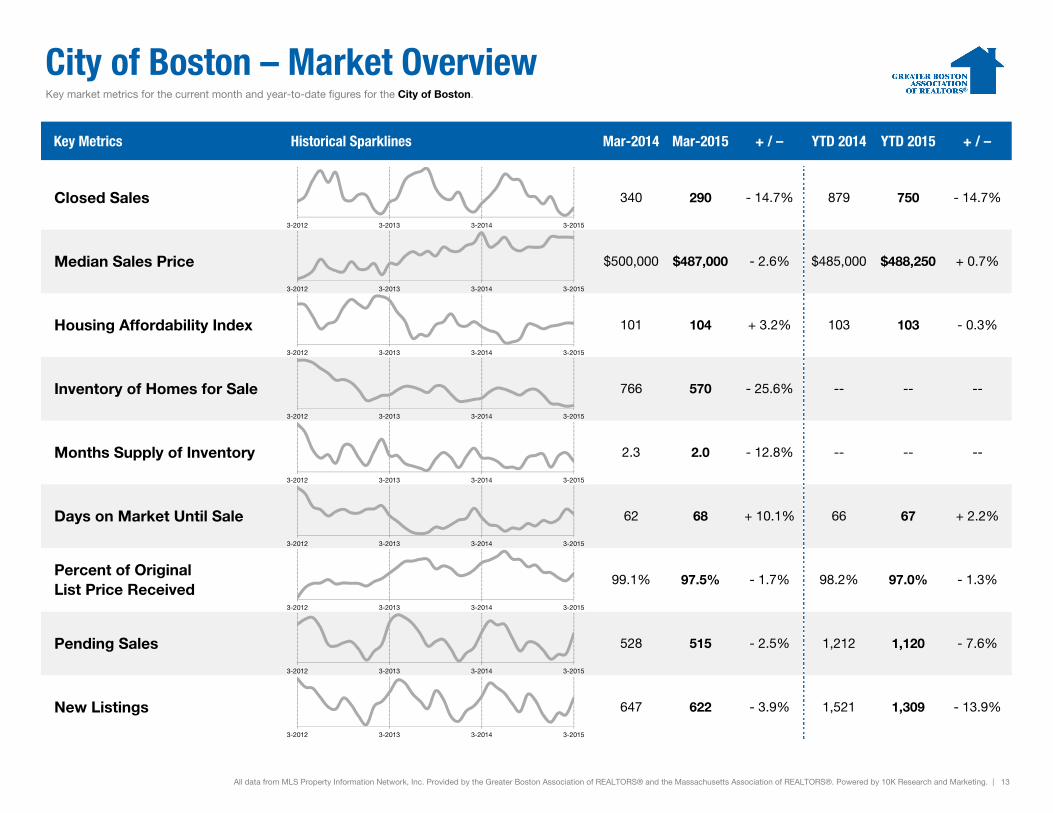
City of Boston – Market Overview Key market metrics for the current month and year-to-date figures for the City of Boston.
Key Metrics Historical Sparklines Mar-2014 Mar-2015 + / – YTD 2014 YTD 2015 + / –
- 13.9%
All data from MLS Property Information Network, Inc. Provided by the Greater Boston Association of REALTORS® and the Massachusetts Association of REALTORS®. Powered by 10K Research and Marketing. | 13
New Listings 647 622 - 3.9% 1,521 1,309
- 1.3%
Pending Sales 528 515 - 2.5% 1,212 1,120 - 7.6%
Percent of OriginalList Price Received
99.1% 97.5% - 1.7% 98.2% 97.0%
--
Days on Market Until Sale 62 68 + 10.1% 66 67 + 2.2%
Months Supply of Inventory 2.3 2.0 - 12.8% -- --
- 0.3%
Inventory of Homes for Sale 766 570 - 25.6% -- -- --
Housing Affordability Index 101 104 + 3.2% 103 103
- 14.7%
Median Sales Price $500,000 $487,000 - 2.6% $485,000 $488,250 + 0.7%
Closed Sales 340 290 - 14.7% 879 750
3-2012 3-2013 3-2014 3-2015
3-2012 3-2013 3-2014 3-2015
3-2012 3-2013 3-2014 3-2015
3-2012 3-2013 3-2014 3-2015
3-2012 3-2013 3-2014 3-2015
3-2012 3-2013 3-2014 3-2015
3-2012 3-2013 3-2014 3-2015
3-2012 3-2013 3-2014 3-2015
3-2012 3-2013 3-2014 3-2015