Embed Size (px)
Citation preview

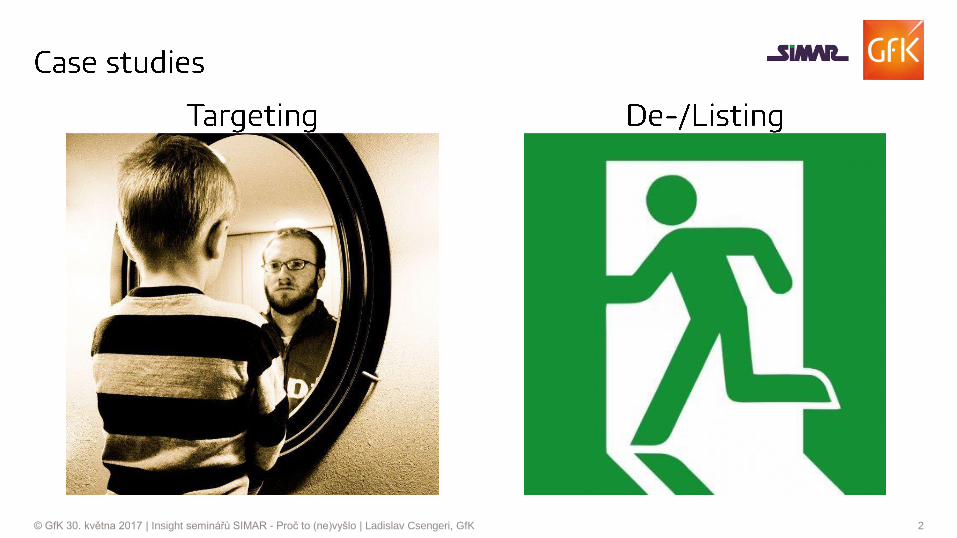
1© GfK 30. května 2017 | Insight seminářů SIMAR - Proč to (ne)vyšlo | Ladislav Csengeri, GfK
2© GfK 30. května 2017 | Insight seminářů SIMAR - Proč to (ne)vyšlo | Ladislav Csengeri, GfK
3© GfK 30. května 2017 | Insight seminářů SIMAR - Proč to (ne)vyšlo | Ladislav Csengeri, GfK
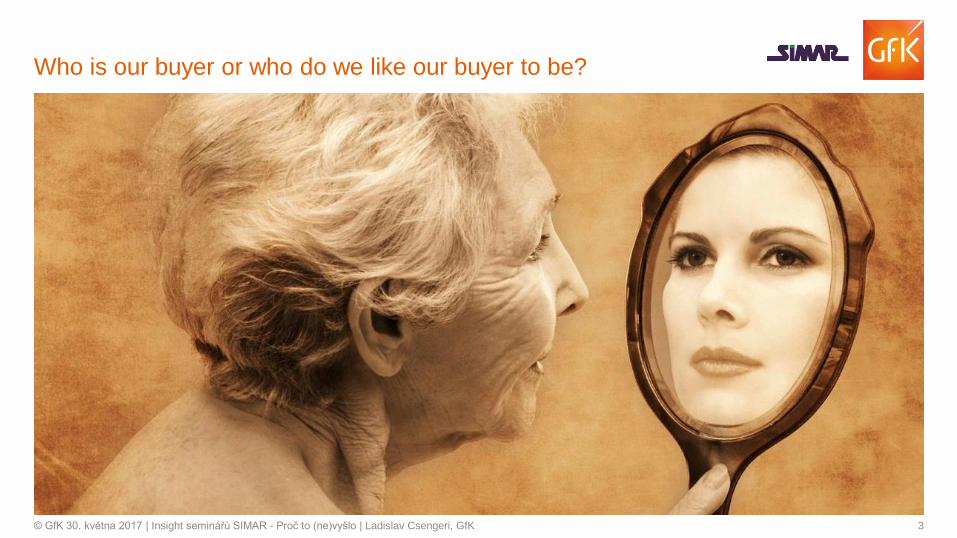
Who is our buyer or who do we like our buyer to be?

4© GfK 30. května 2017 | Insight seminářů SIMAR - Proč to (ne)vyšlo | Ladislav Csengeri, GfK
Czech Republic: Cheese Brand
» Internationally well established and known brand
» Increased focus on and re-launch of the brand in the
Czech & Slovak Republic
» Main Target: children and kids
» Objective: Proof of target group | who is the shopper?

5© GfK 30. května 2017 | Insight seminářů SIMAR - Proč to (ne)vyšlo | Ladislav Csengeri, GfK
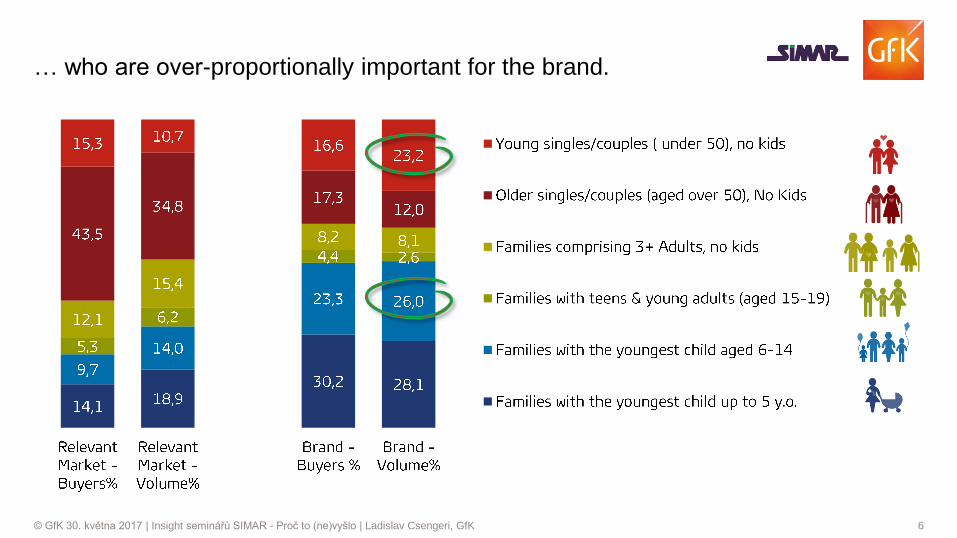
Brand attracts besides families with youngest kids and
schoolchildren also young adults…
6© GfK 30. května 2017 | Insight seminářů SIMAR - Proč to (ne)vyšlo | Ladislav Csengeri, GfK
… who are over-proportionally important for the brand.

7© GfK 30. května 2017 | Insight seminářů SIMAR - Proč to (ne)vyšlo | Ladislav Csengeri, GfK
More intensive communication and activities helped to
strengthen the positioning within the group of families with kids.
MAT -1 MAT
8© GfK 30. května 2017 | Insight seminářů SIMAR - Proč to (ne)vyšlo | Ladislav Csengeri, GfK
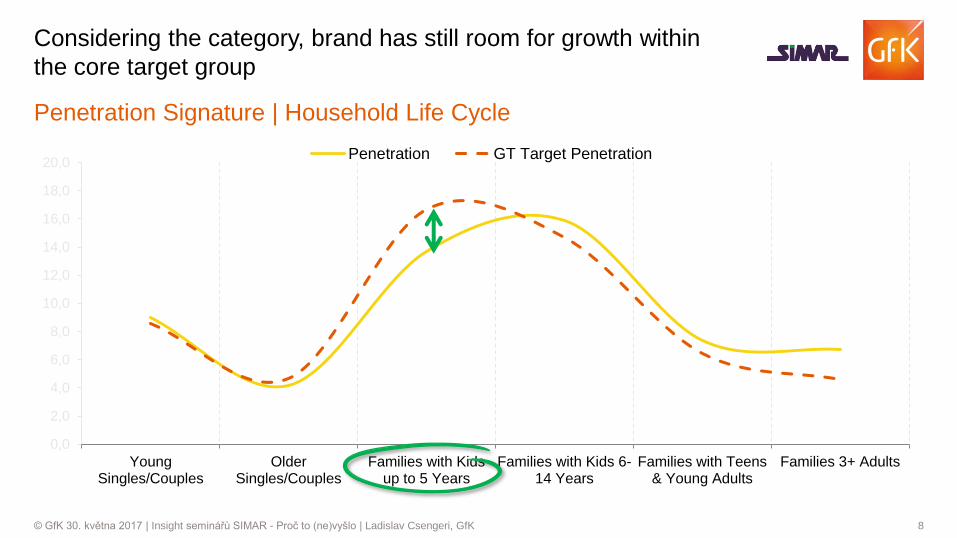
Considering the category, brand has still room for growth within
the core target group
Penetration Signature | Household Life Cycle
0,0
2,0
4,0
6,0
8,0
10,0
12,0
14,0
16,0
18,0
20,0
YoungSingles/Couples
OlderSingles/Couples
Families with Kidsup to 5 Years
Families with Kids 6-14 Years
Families with Teens& Young Adults
Families 3+ Adults
Penetration GT Target Penetration

9© GfK 30. května 2017 | Insight seminářů SIMAR - Proč to (ne)vyšlo | Ladislav Csengeri, GfK
Slovakia: Milk Drinks
» Growing brand of competitor attracted the
attention of one of the big dairy producers
» Brand managed to gain new buyers which
was the main driver of the growth.
» Who is buying the brand and is there a
potential for us within this segment with
our brands?

10© GfK 30. května 2017 | Insight seminářů SIMAR - Proč to (ne)vyšlo | Ladislav Csengeri, GfK
As a surprise, the brand has over-proportionally and intensive
buyers within families with schoolkids
Mueller Milch: Volume %
10,6 13,4 16,0
35,921,2 16,9
13,5
11,5 13,5
7,3
12,3 16,5
5,6
9,89,0
8,010,5 7,3
19,2 21,2 20,7
All Buyers % Brand Buyers % Brand Volume %
Adult Families
Families with Teenagers
Families with schoolkids (10-14yo)
Families with schoolkids (6-9yo)
Families with small kids
Older Singles/Couples
Younger Singles/Couples

11© GfK 30. května 2017 | Insight seminářů SIMAR - Proč to (ne)vyšlo | Ladislav Csengeri, GfK
How important are brands for the category in the retailer and
what impact may cause a wrong decision about de-/listing?
12© GfK 30. května 2017 | Insight seminářů SIMAR - Proč to (ne)vyšlo | Ladislav Csengeri, GfK
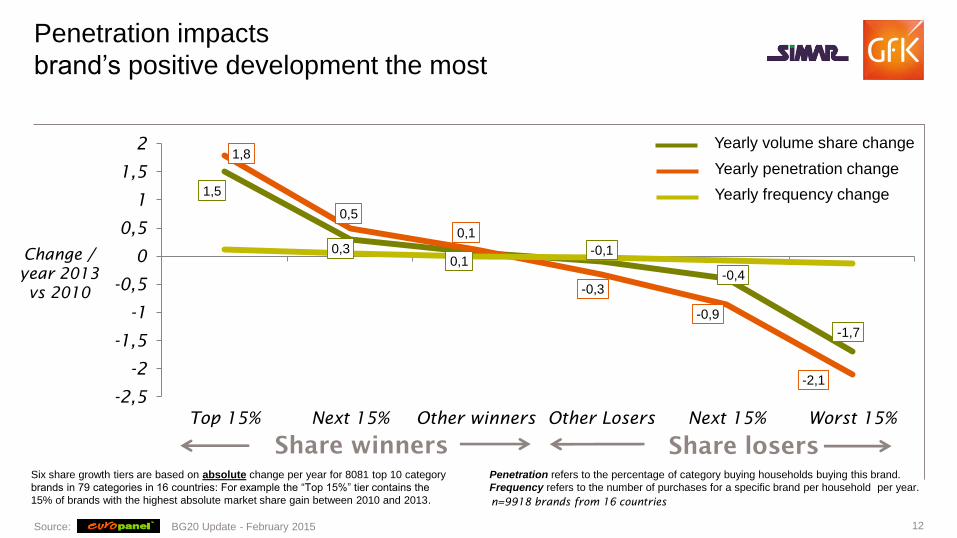
Six share growth tiers are based on absolute change per year for 8081 top 10 category
brands in 79 categories in 16 countries: For example the “Top 15%” tier contains the
15% of brands with the highest absolute market share gain between 2010 and 2013.
1,5
0,30,1
-0,1
-0,4
-1,7
1,8
0,5
0,1
-0,3
-0,9
-2,1
-2,5
-2
-1,5
-1
-0,5
0
0,5
1
1,5
2
Top 15% Next 15% Other winners Other Losers Next 15% Worst 15%
Share winners Share losers
Change /
year 2013
vs 2010
n=9918 brands from 16 countries
Penetration impacts
brand’s positive development the most
Penetration refers to the percentage of category buying households buying this brand.
Frequency refers to the number of purchases for a specific brand per household per year.
Source: BG20 Update - February 2015
Yearly volume share change
Yearly penetration change
Yearly frequency change
13© GfK 30. května 2017 | Insight seminářů SIMAR - Proč to (ne)vyšlo | Ladislav Csengeri, GfK
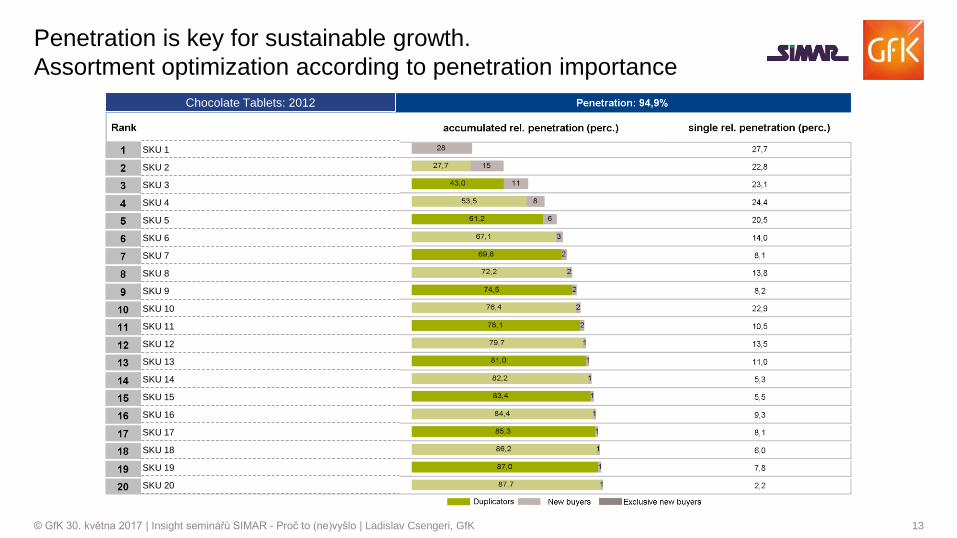
Penetration is key for sustainable growth.
Assortment optimization according to penetration importance
SKU 1
SKU 2
SKU 3
SKU 4
SKU 5
SKU 6
SKU 7
SKU 8
SKU 9
SKU 10
SKU 11
SKU 12
SKU 13
SKU 14
SKU 15
SKU 16
SKU 17
SKU 18
SKU 19
SKU 20
Chocolate Tablets: 2012

14© GfK 30. května 2017 | Insight seminářů SIMAR - Proč to (ne)vyšlo | Ladislav Csengeri, GfK
Which retailer is targeting the most of the chocolate tablets buyers?
Retailer 1
Retailer 2
Retailer 3
Retailer 4
Retailer 5
Retailer 6
Retailer 7
Retailer 8
Retailer 9
Retailer 10
Chocolate Tablets: 2012

15© GfK 30. května 2017 | Insight seminářů SIMAR - Proč to (ne)vyšlo | Ladislav Csengeri, GfK
Case Study Czech Republic:
Listing/Delisting Impact Analysis
What impact will have a delisting of the brand in the retailer?

16© GfK 30. května 2017 | Insight seminářů SIMAR - Proč to (ne)vyšlo | Ladislav Csengeri, GfK
By delisting of the brand, retailer suffers steeper decline than the brand itself.
-19,0-17,5
-30
-25
-20
-15
-10
-5
0
5
Volume Value
Brand
-21,2
-25,9
-30
-25
-20
-15
-10
-5
0
5
Volume Value
Retailer in Choco Tabs
Perspective of the manufacturer Retailer’s perspective
Change in % in one years period
17© GfK 30. května 2017 | Insight seminářů SIMAR - Proč to (ne)vyšlo | Ladislav Csengeri, GfK
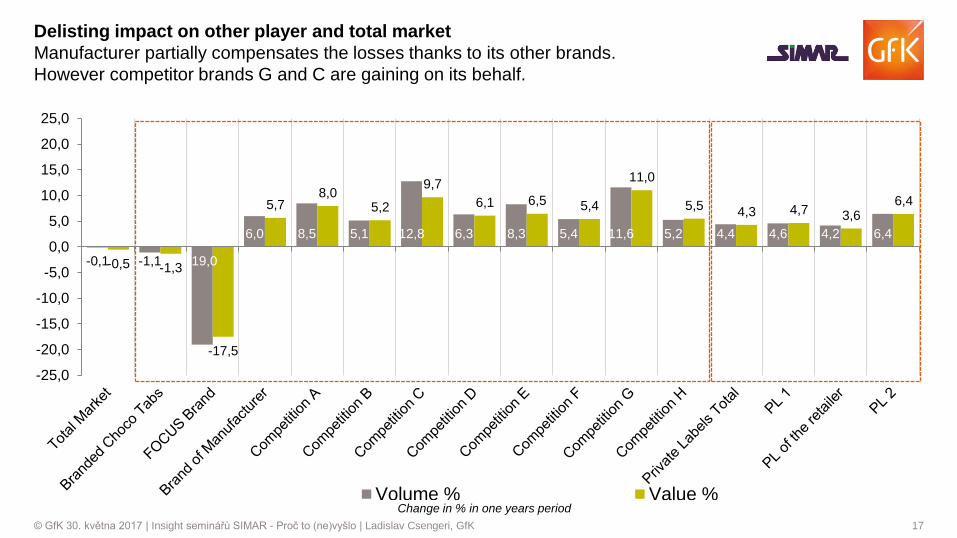
Delisting impact on other player and total market
Manufacturer partially compensates the losses thanks to its other brands.
However competitor brands G and C are gaining on its behalf.
-0,1 -1,1 -19,0
6,0 8,5 5,1 12,8 6,3 8,3 5,4 11,6 5,2 4,4 4,6 4,2 6,4
-0,5 -1,3
-17,5
5,78,0
5,2
9,7
6,1 6,5 5,4
11,0
5,54,3 4,7 3,6
6,4
-25,0
-20,0
-15,0
-10,0
-5,0
0,0
5,0
10,0
15,0
20,0
25,0
Volume % Value %Change in % in one years period
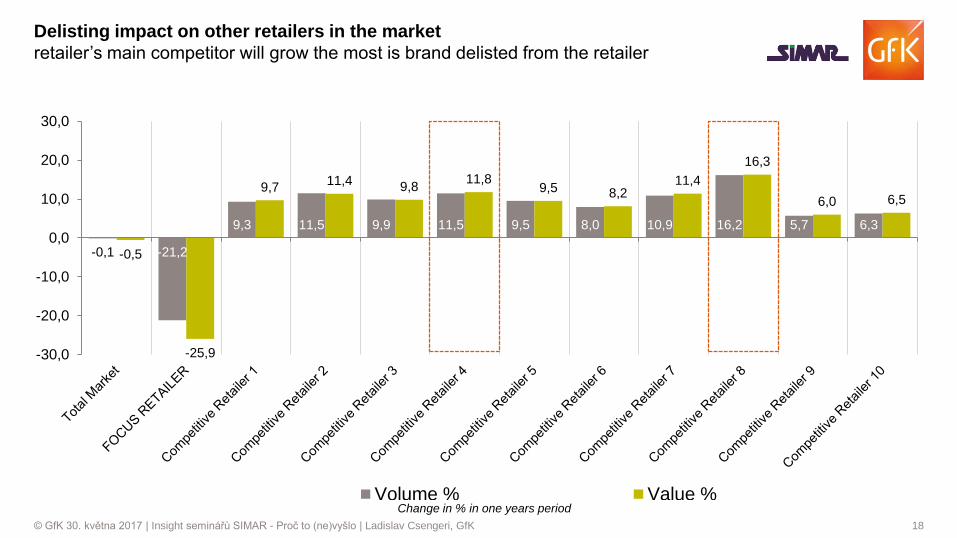
18© GfK 30. května 2017 | Insight seminářů SIMAR - Proč to (ne)vyšlo | Ladislav Csengeri, GfK
Delisting impact on other retailers in the market
retailer’s main competitor will grow the most is brand delisted from the retailer
-0,1 -21,2
9,3 11,5 9,9 11,5 9,5 8,0 10,9 16,2 5,7 6,3
-0,5
-25,9
9,711,4 9,8
11,89,5 8,2
11,4
16,3
6,0 6,5
-30,0
-20,0
-10,0
0,0
10,0
20,0
30,0
Volume % Value %Change in % in one years period

19© GfK 30. května 2017 | Insight seminářů SIMAR - Proč to (ne)vyšlo | Ladislav Csengeri, GfK
Who will suffer the most out of the suppliers and when will the
retailer lose the least?
Several market scenarios
Annual Change in Value %
Delisting in the retailer of the brand…Value change % of
BRAND on TOTAL MARKET
Value Change % of
CATEGORY in RETAILER
Analyzed Brand -17,5 -25,9
Other Brand of the manufacturer -22,0 -7,4
Competitor 1 -21,4 -24,5
Competitor 2 -31,4 -7,8
Competitor 3 -21,7 -2,2
Analyzed Brand and Competitor 1 are not recommended to be delisted in the
retailer, as the retailer loses the most within the category.

20© GfK 30. května 2017 | Insight seminářů SIMAR - Proč to (ne)vyšlo | Ladislav Csengeri, GfK
Ladislav Csengeri | Consumer Panel Services CZSK | [email protected]