Embed Size (px)
Citation preview
1
PERILS OF PERCEPTION 2015 A 33 COUNTRY STUDY
2
These are the latest findings from the
Ipsos Perils of Perception survey. The
results highlight how wrong people
across 33 countries are about some
key issues and features of the
population in their country.
Perceptions are not reality…
3 © Ipsos Public Affairs PERILS OF PERCEPTION |
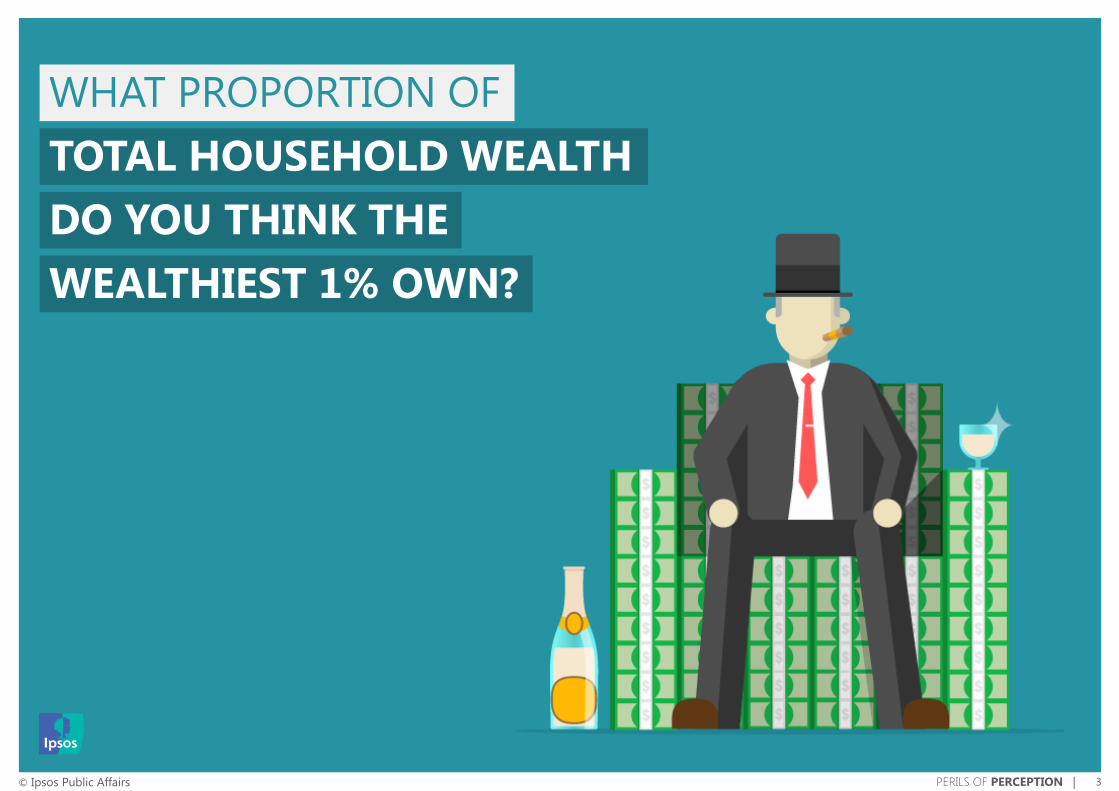
WHAT PROPORTION OF
TOTAL HOUSEHOLD WEALTH
DO YOU THINK THE
WEALTHIEST 1% OWN?
4 © Ipsos Public Affairs PERILS OF PERCEPTION |
+36
+33
+33
+32
+32
+30
+29
+29
+23
+22
+20
+20
+17
+16
+15
+14
+13
+11
+9
+6
+4
+2
0
-1
-7
-8
-13
-15
-17
Great Britain
France
Australia
Belgium
New Zealand
Canada
Germany
Spain
Italy
Japan
Norway
United States
China
Netherlands
South Korea
Sweden
Ireland
Chile
Colombia
South Africa
Poland
Argentina
Mexico
Turkey
Israel
Brazil
India
Peru
Russia
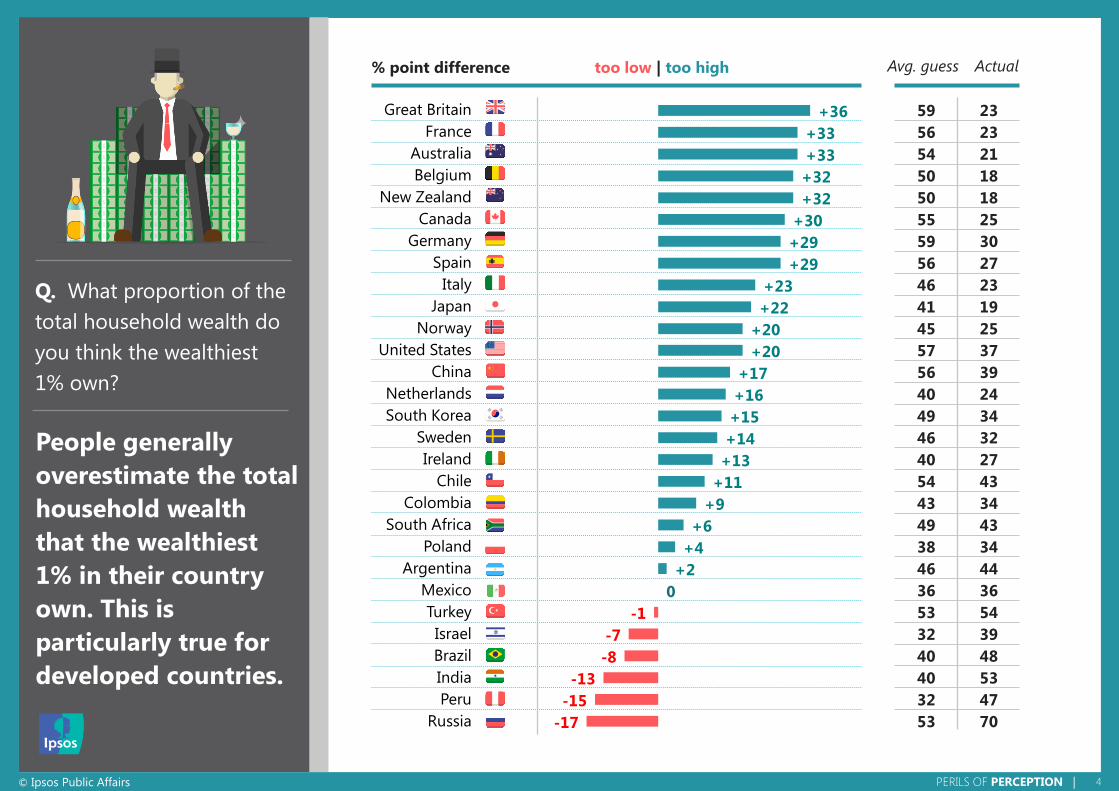
People generally
overestimate the total
household wealth
that the wealthiest
1% in their country
own. This is
particularly true for
developed countries.
59 23
56 23
54 21
50 18
50 18
55 25
59 30
56 27
46 23
41 19
45 25
57 37
56 39
40 24
49 34
46 32
40 27
54 43
43 34
49 43
38 34
46 44
36 36
53 54
32 39
40 48
40 53
32 47
53 70
Q. What proportion of the
total household wealth do
you think the wealthiest
1% own?
% point difference too low | too high Avg. guess Actual
5 © Ipsos Public Affairs PERILS OF PERCEPTION |
WHAT PROPORTION OF
TOTAL HOUSEHOLD WEALTH
DO YOU THINK THE
WEALTHIEST 1%
SHOULD OWN?
6 © Ipsos Public Affairs PERILS OF PERCEPTION |
+9
+6
+4
+3
+3
+1
-2
-3
-4
-6
-7
-7
-8
-10
-10
-10
-12
-13
-13
-15
-16
-17
-18
-19
-21
-23
-25
-33
-47
New Zealand
Japan
France
Australia
Italy
Canada
Belgium
Great Britain
Ireland
Mexico
China
Colombia
Netherlands
Norway
Spain
United States
Germany
South Africa
Sweden
Brazil
South Korea
Poland
Peru
Argentina
Chile
India
Israel
Turkey
Russia
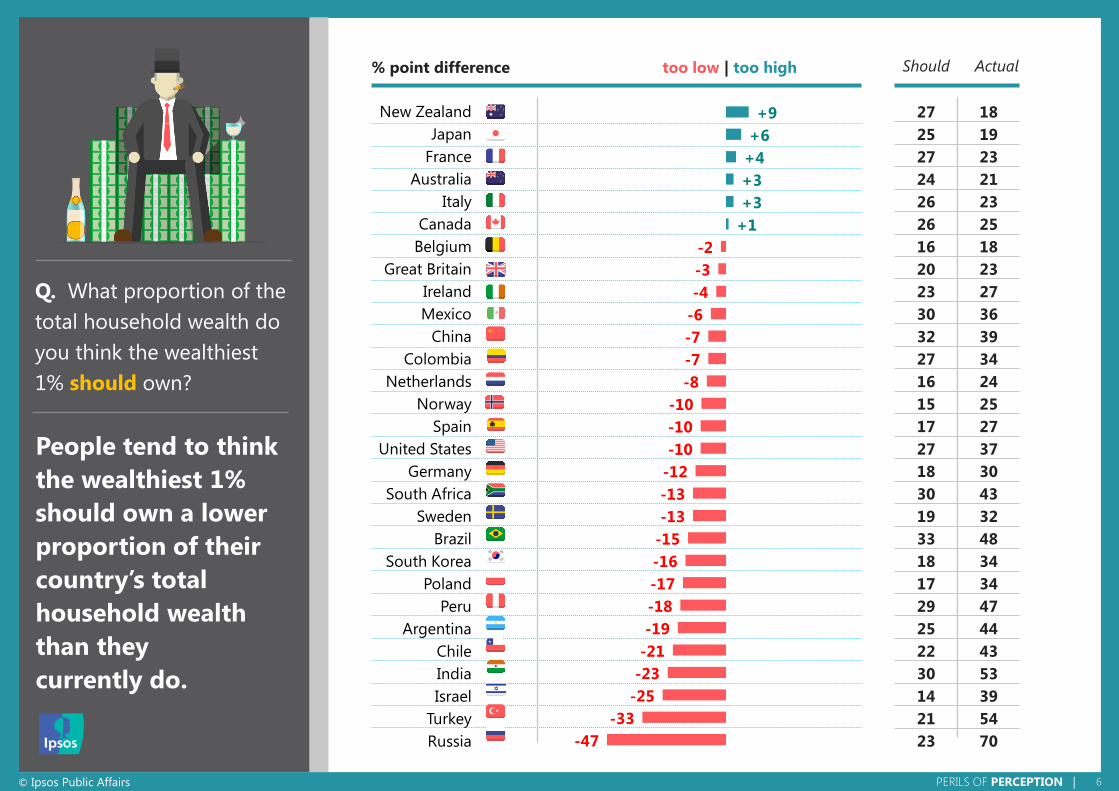
People tend to think
the wealthiest 1%
should own a lower
proportion of their
country’s total
household wealth
than they
currently do.
27 18
25 19
27 23
24 21
26 23
26 25
16 18
20 23
23 27
30 36
32 39
27 34
16 24
15 25
17 27
27 37
18 30
30 43
19 32
33 48
18 34
17 34
29 47
25 44
22 43
30 53
14 39
21 54
23 70
Q. What proportion of the
total household wealth do
you think the wealthiest
1% should own?
% point difference too low | too high Should Actual
7 © Ipsos Public Affairs PERILS OF PERCEPTION |
OUT OF EVERY 100 PEOPLE
AGED 20 YEARS OR OVER
HOW MANY DO YOU THINK
ARE EITHER OVERWEIGHT
OR OBESE?

8 © Ipsos Public Affairs PERILS OF PERCEPTION |
+21
+9
+6
0
-8
-9
-9
-11
-11
-11
-12
-13
-13
-14
-14
-15
-16
-16
-17
-17
-17
-17
-18
-19
-19
-20
-20
-20
-24
-26
-33
-33
-43
India
Japan
China
South Korea
South Africa
Netherlands
Brazil
Serbia
Australia
Hungary
Argentina
Canada
Chile
Italy
Ireland
Peru
Mexico
United States
Belgium
France
Germany
Poland
Great Britain
Sweden
New Zealand
Colombia
Spain
Norway
Montenegro
Russia
Israel
Turkey
Saudi Arabia
The public generally
underestimate the
proportion of
overweight or
obese people in
their country.
41 20
32 23
34 28
32 32
47 55
40 49
47 56
42 53
51 62
49 60
40 52
43 56
53 66
36 50
44 58
41 56
53 69
50 66
36 53
32 49
40 57
40 57
44 62
33 52
47 66
35 55
38 58
33 53
35 59
31 57
24 57
32 65
28 71
Q. Out of every 100 people
aged 20 years or over],
how many do you think are
either overweight or
obese?
% point difference too low | too high Avg. guess Actual
9 © Ipsos Public Affairs PERILS OF PERCEPTION |
OUT OF EVERY 100 PEOPLE
ABOUT HOW MANY DO YOU THINK
DO NOT AFFILIATE THEMSELVES WITH
ANY RELIGION?
10 © Ipsos Public Affairs PERILS OF PERCEPTION |
+33
+30
+29
+28
+28
+28
+27
+25
+25
+24
+23
+23
+22
+21
+21
+21
+20
+20
+20
+19
+18
+17
+17
+14
+13
+13
+12
+11
+8
+8
+5
-4
-4
India
Mexico
Russia
Norway
Serbia
Ireland
Brazil
Peru
Spain
United States
Argentina
Italy
Montenegro
Colombia
South Africa
Australia
Hungary
Poland
Great Britain
Chile
France
Canada
Sweden
Turkey
Germany
Israel
New Zealand
Saudi Arabia
Belgium
Netherlands
China
Japan
South Korea
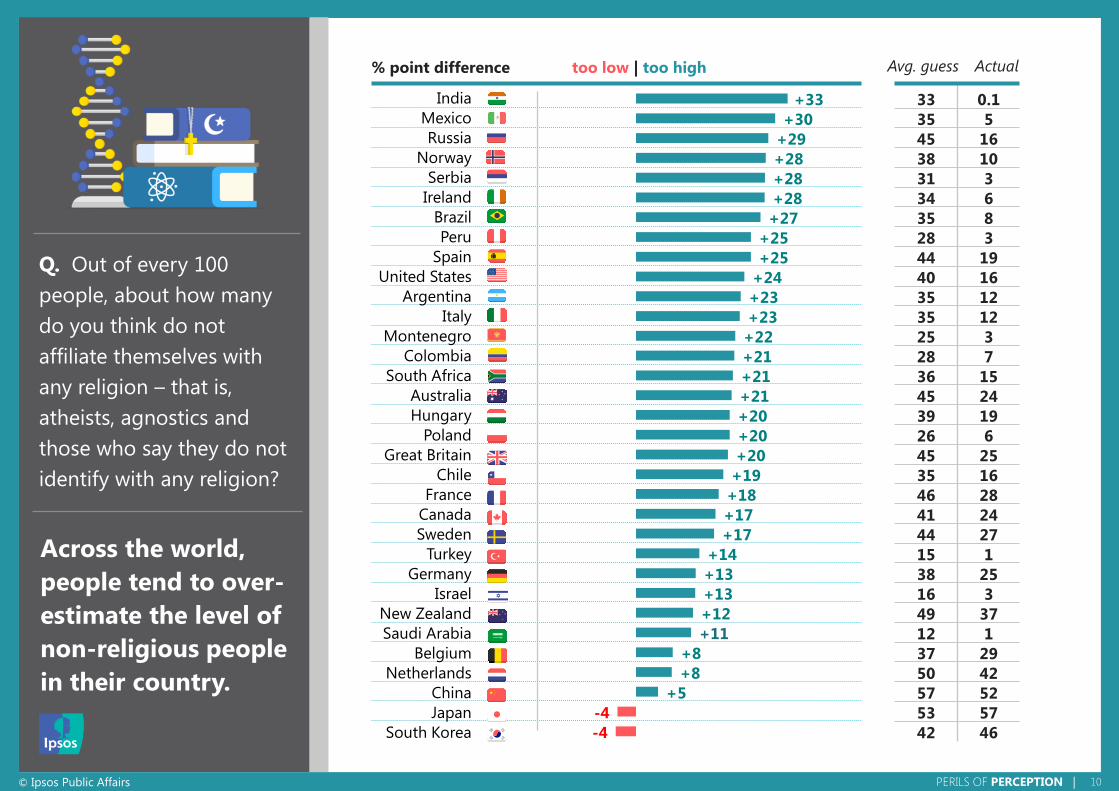
Across the world,
people tend to over-
estimate the level of
non-religious people
in their country.
33 0.1
35 5
45 16
38 10
31 3
34 6
35 8
28 3
44 19
40 16
35 12
35 12
25 3
28 7
36 15
45 24
39 19
26 6
45 25
35 16
46 28
41 24
44 27
15 1
38 25
16 3
49 37
12 1
37 29
50 42
57 52
53 57
42 46
Q. Out of every 100
people, about how many
do you think do not
affiliate themselves with
any religion – that is,
atheists, agnostics and
those who say they do not
identify with any religion?
% point difference too low | too high Avg. guess Actual
11 © Ipsos Public Affairs PERILS OF PERCEPTION |
THE POPULATION DO YOU THINK
ARE IMMIGRANTS (I.E. NOT
WHAT PERCENTAGE OF
BORN IN THIS COUNTRY?)
12 © Ipsos Public Affairs PERILS OF PERCEPTION |
+25
+25
+24
+21
+21
+21
+19
+19
+18
+17
+17
+17
+16
+14
+14
+14
+13
+12
+12
+11
+10
+10
+9
+8
+8
+8
+8
+7
+7
+2
-3
-7
Argentina
Brazil
South Africa
Mexico
Peru
India
Russia
United States
Canada
Chile
Colombia
Italy
Serbia
France
Germany
Belgium
Netherlands
Great Britain
New Zealand
China
Australia
Hungary
Sweden
South Korea
Spain
Japan
Montenegro
Poland
Ireland
Norway
Israel
Saudi Arabia
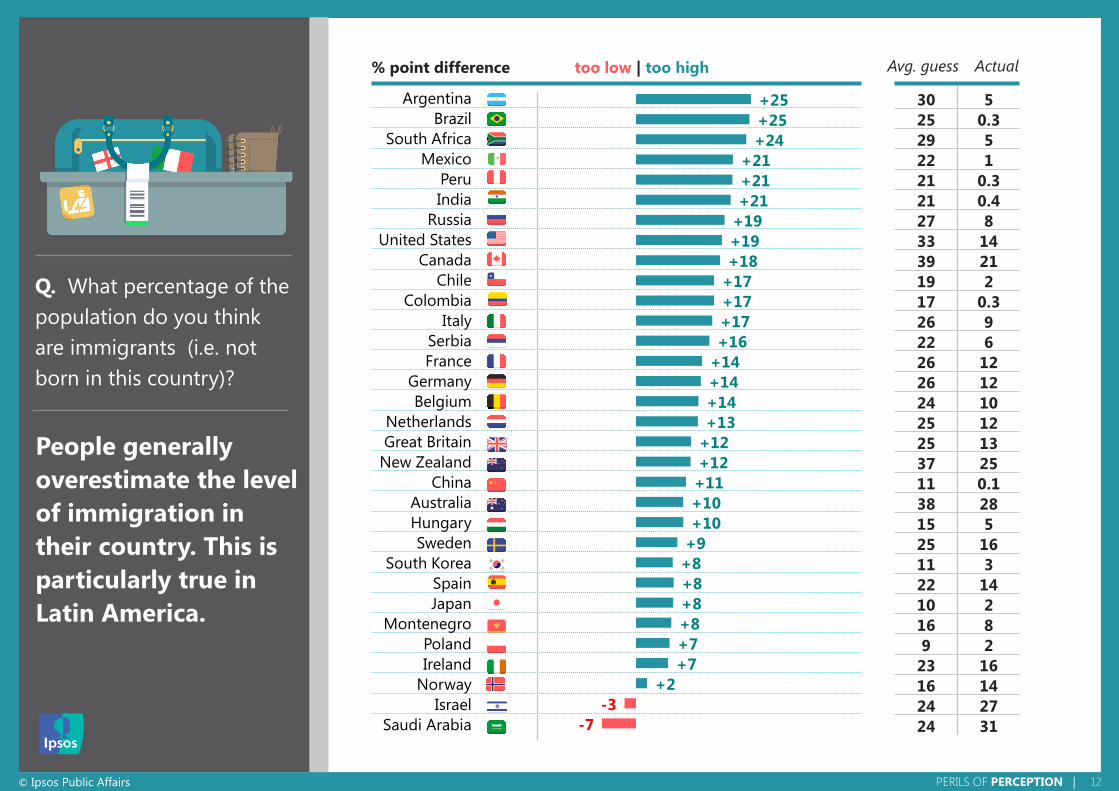
People generally
overestimate the level
of immigration in
their country. This is
particularly true in
Latin America.
30 5
25 0.3
29 5
22 1
21 0.3
21 0.4
27 8
33 14
39 21
19 2
17 0.3
26 9
22 6
26 12
26 12
24 10
25 12
25 13
37 25
11 0.1
38 28
15 5
25 16
11 3
22 14
10 2
16 8
9 2
23 16
16 14
24 27
24 31
Q. What percentage of the
population do you think
are immigrants (i.e. not
born in this country)?
% point difference too low | too high Avg. guess Actual
13 © Ipsos Public Affairs PERILS OF PERCEPTION |
OUT OF EVERY 100
YOUNG ADULTS AGED 25-34
ABOUT HOW MANY DO YOU THINK
LIVE WITH THEIR PARENTS?
14 © Ipsos Public Affairs PERILS OF PERCEPTION |
+29
+25
+25
+22
+20
+20
+17
+15
+14
+12
+10
+7
+2
+1
Great Britain
Spain
France
United States
Ireland
Sweden
Belgium
Norway
Serbia
Italy
Germany
Netherlands
Poland
Hungary
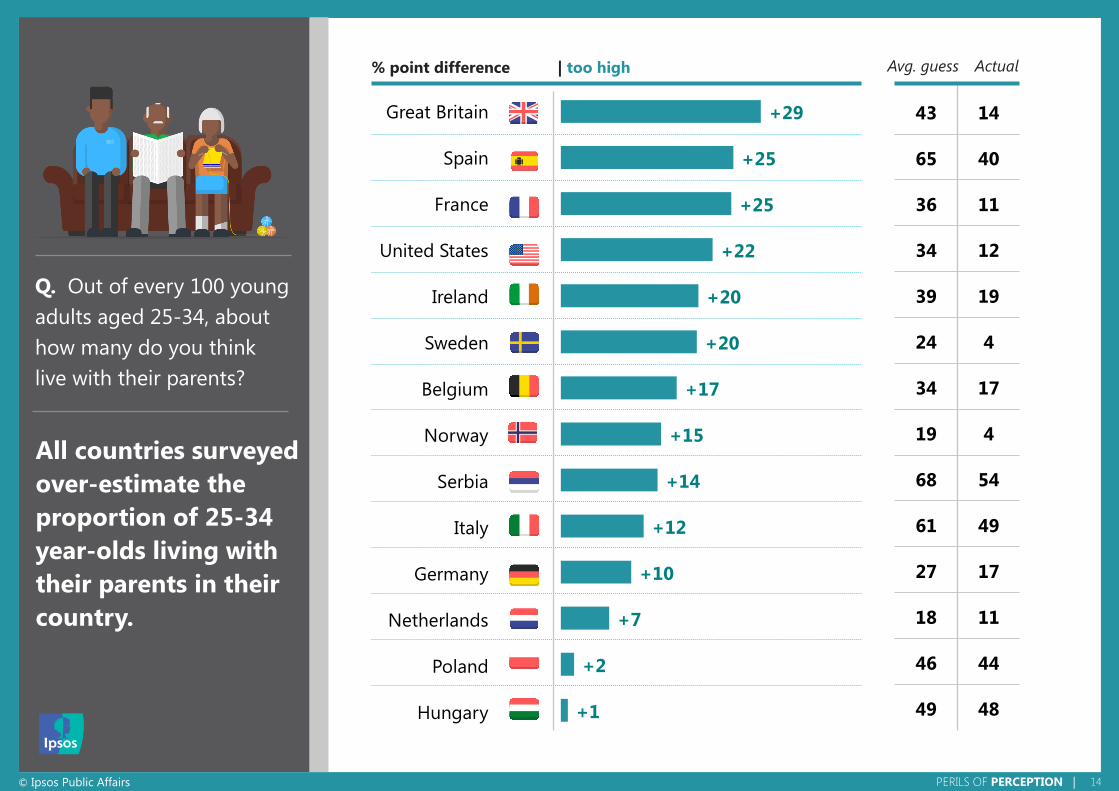
All countries surveyed
over-estimate the
proportion of 25-34
year-olds living with
their parents in their
country.
43 14
65 40
36 11
34 12
39 19
24 4
34 17
19 4
68 54
61 49
27 17
18 11
46 44
49 48
Q. Out of every 100 young
adults aged 25-34, about
how many do you think
live with their parents?
% point difference | too high Avg. guess Actual
15 © Ipsos Public Affairs PERILS OF PERCEPTION |
HOW OLD DO YOU THINK
THE AVERAGE PERSON IN YOUR
COUNTRY IS?
16 © Ipsos Public Affairs PERILS OF PERCEPTION |
+25
+24
+22
+22
+19
+18
+17
+16
+16
+16
+16
+15
+14
+14
+14
+14
+14
+13
+12
+12
+11
+11
+11
+11
+10
+9
+9
+9
+9
+8
+7
+6
+4
Brazil
Turkey
India
Hungary
China
Japan
Norway
Mexico
Montenegro
South Africa
Sweden
Poland
Italy
Ireland
Peru
Belgium
Serbia
Argentina
South Korea
Colombia
Israel
Chile
Netherlands
Great Britain
Australia
United States
Saudi Arabia
Spain
Russia
Canada
New Zealand
France
Germany
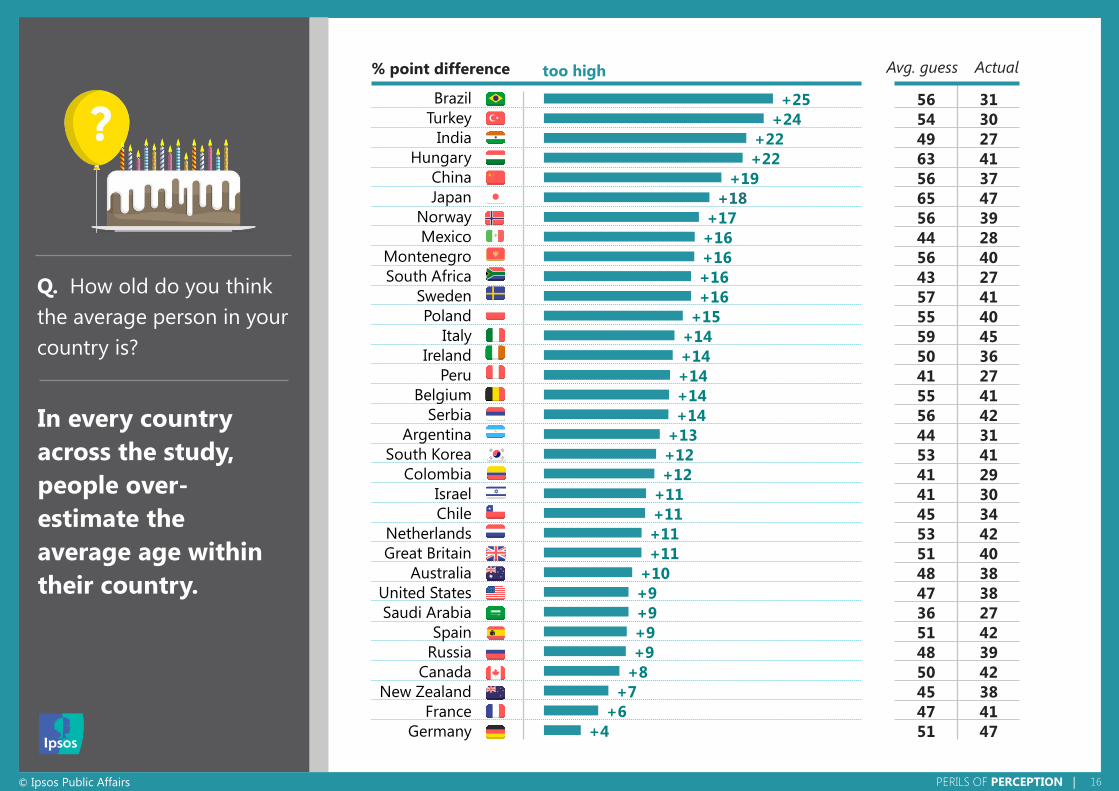
In every country
across the study,
people over-
estimate the
average age within
their country.
56 31
54 30
49 27
63 41
56 37
65 47
56 39
44 28
56 40
43 27
57 41
55 40
59 45
50 36
41 27
55 41
56 42
44 31
53 41
41 29
41 30
45 34
53 42
51 40
48 38
47 38
36 27
51 42
48 39
50 42
45 38
47 41
51 47
% point difference too high Avg. guess Actual
Q. How old do you think
the average person in your
country is?
17 © Ipsos Public Affairs PERILS OF PERCEPTION |
OUT OF EVERY 100 PEOPLE
ABOUT HOW MANY DO YOU THINK
ARE AGED 14 OR YOUNGER?
18 © Ipsos Public Affairs PERILS OF PERCEPTION |
+15
+15
+14
+14
+13
+13
+13
+13
+13
+12
+11
+11
+11
+11
+11
+10
+10
+10
+9
+9
+8
+8
+6
+6
+5
+5
+4
+4
+4
+4
+3
-5
Brazil
Mexico
Peru
South Africa
Hungary
Argentina
New Zealand
Colombia
Russia
Italy
Poland
Ireland
Chile
Germany
India
Canada
Great Britain
United States
Australia
Serbia
France
Spain
Montenegro
China
Netherlands
Turkey
Sweden
South Korea
Japan
Norway
Saudi Arabia
Israel
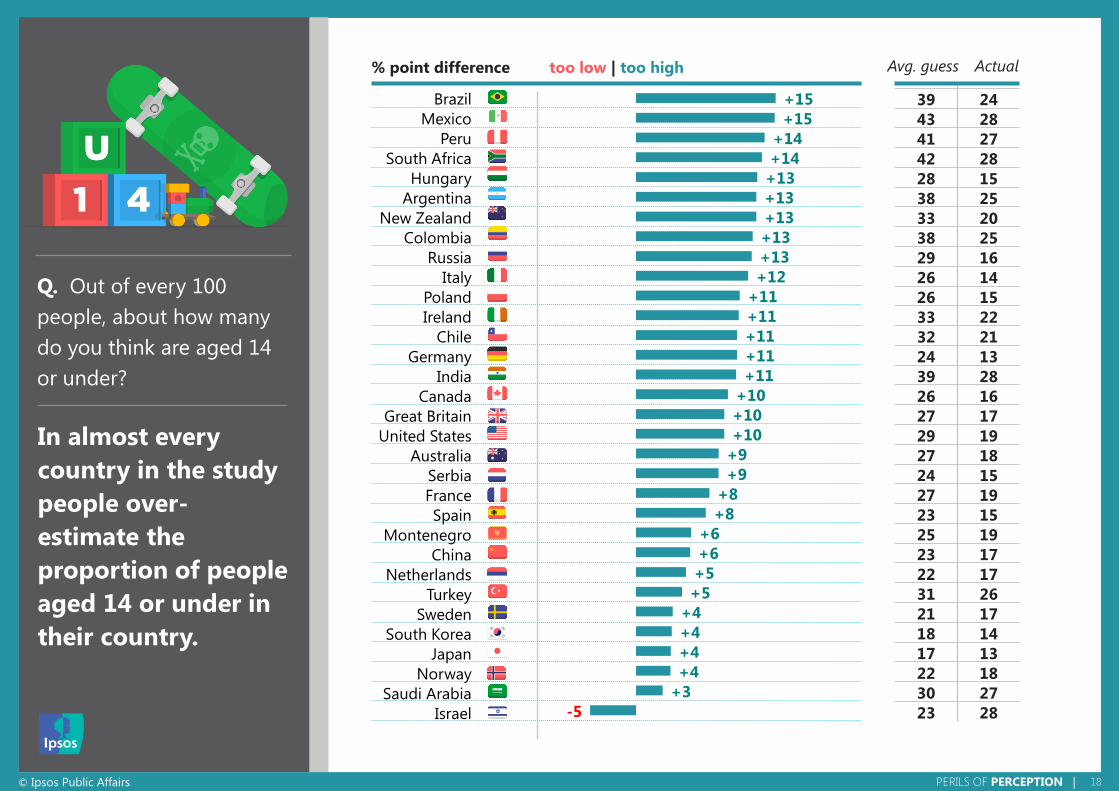
In almost every
country in the study
people over-
estimate the
proportion of people
aged 14 or under in
their country.
39 24
43 28
41 27
42 28
28 15
38 25
33 20
38 25
29 16
26 14
26 15
33 22
32 21
24 13
39 28
26 16
27 17
29 19
27 18
24 15
27 19
23 15
25 19
23 17
22 17
31 26
21 17
18 14
17 13
22 18
30 27
23 28
Q. Out of every 100
people, about how many
do you think are aged 14
or under?
% point difference too low | too high Avg. guess Actual
19 © Ipsos Public Affairs PERILS OF PERCEPTION |
WHAT PERCENTAGE OF
POLITICIANS ARE WOMEN?
20 © Ipsos Public Affairs PERILS OF PERCEPTION |
+17
+17
+11
+8
+6
+2
+2
+2
+2
+2
+1
-2
-2
-2
-3
-3
-3
-3
-5
-6
-6
-6
-7
-8
-9
-9
-10
-10
-12
-12
-14
-16
Russia
Colombia
India
Brazil
Chile
Hungary
Japan
Peru
France
United States
Ireland
Norway
Poland
South Korea
China
Turkey
Canada
Montenegro
Italy
Israel
Sweden
Great Britain
New Zealand
South Africa
Netherlands
Germany
Australia
Argentina
Belgium
Spain
Serbia
Mexico
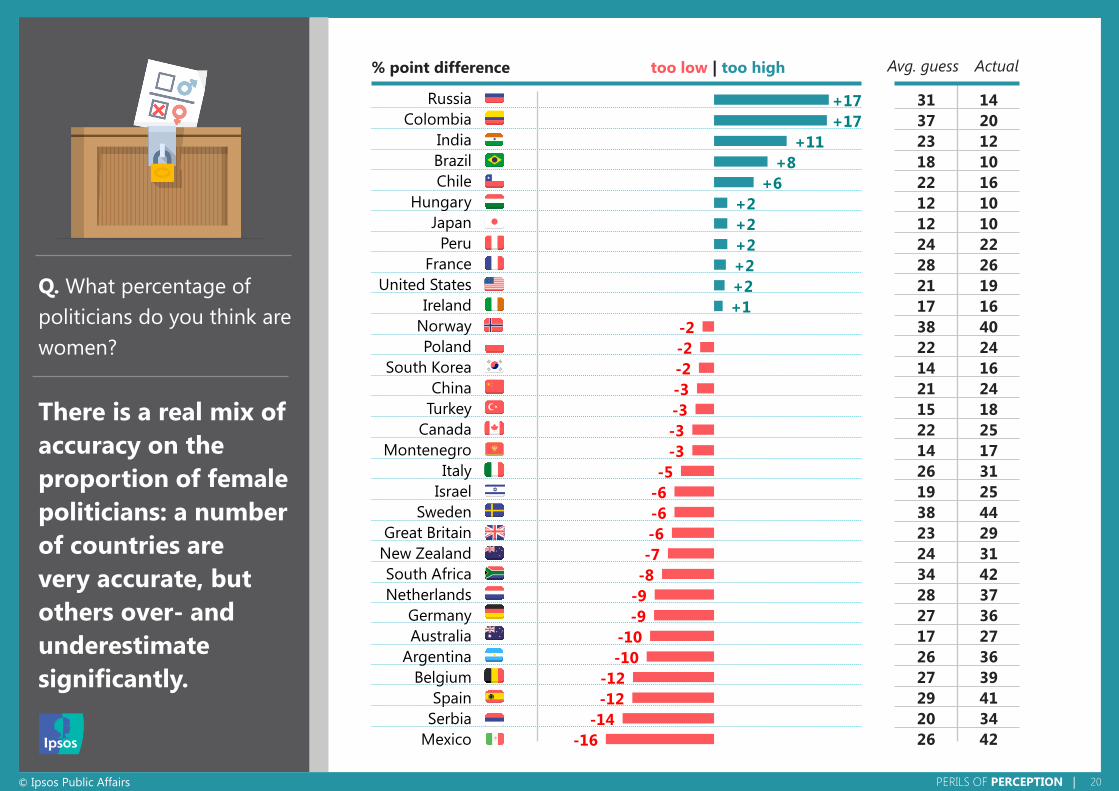
There is a real mix of
accuracy on the
proportion of female
politicians: a number
of countries are
very accurate, but
others over- and
underestimate
significantly.
31 14
37 20
23 12
18 10
22 16
12 10
12 10
24 22
28 26
21 19
17 16
38 40
22 24
14 16
21 24
15 18
22 25
14 17
26 31
19 25
38 44
23 29
24 31
34 42
28 37
27 36
17 27
26 36
27 39
29 41
20 34
26 42
Q. What percentage of
politicians do you think are
women?
% point difference too low | too high Avg. guess Actual
21 © Ipsos Public Affairs PERILS OF PERCEPTION |
WOMEN, ABOUT HOW MANY
DO YOU THINK ARE
OUT OF EVERY 100 WORKING-AGE
IN EMPLOYMENT?
22 © Ipsos Public Affairs PERILS OF PERCEPTION |
+16
+12
+11
+10
+5
+4
+3
+3
+2
+1
0
0
0
-2
-2
-3
-4
-4
-4
-5
-6
-6
-7
-8
-8
-9
-9
-11
-12
-13
-13
-29
India
South Africa
Mexico
Chile
France
Turkey
Hungary
Argentina
Russia
China
Belgium
United States
Norway
Serbia
Colombia
Poland
Brazil
Italy
Sweden
Canada
Ireland
Peru
Montenegro
Japan
Great Britain
Spain
Netherlands
Australia
New Zealand
Germany
South Korea
Israel
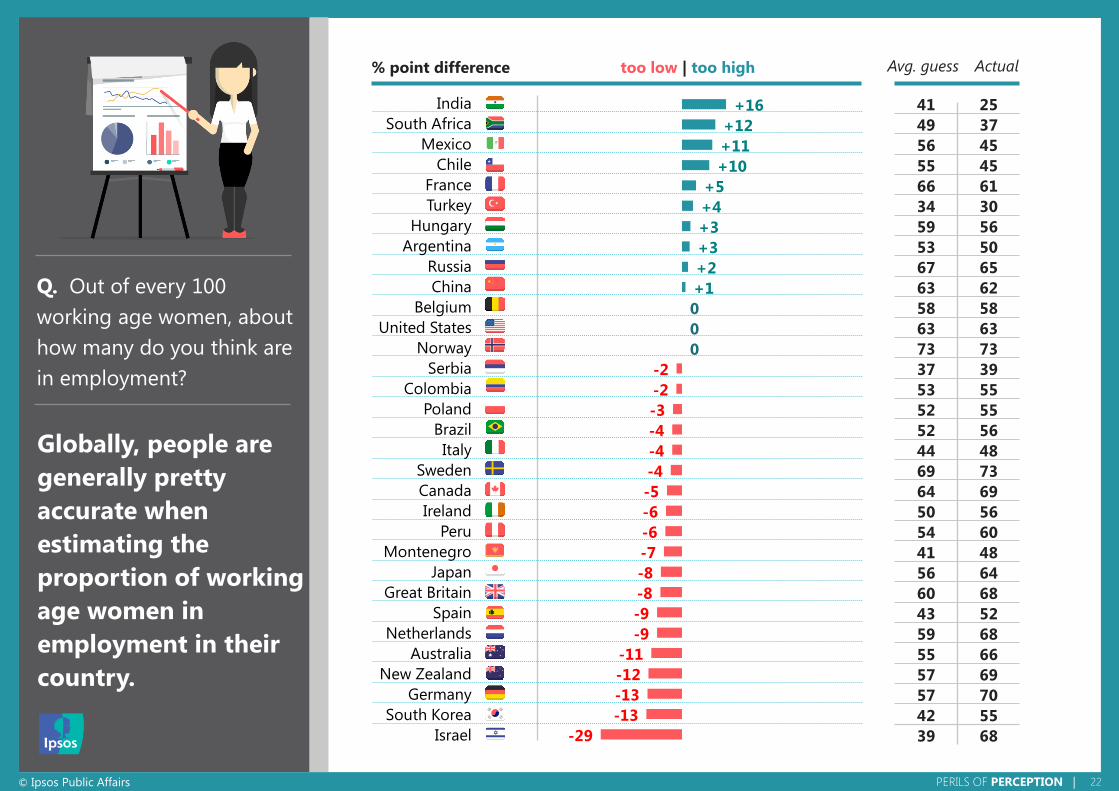
Globally, people are
generally pretty
accurate when
estimating the
proportion of working
age women in
employment in their
country.
41 25
49 37
56 45
55 45
66 61
34 30
59 56
53 50
67 65
63 62
58 58
63 63
73 73
37 39
53 55
52 55
52 56
44 48
69 73
64 69
50 56
54 60
41 48
56 64
60 68
43 52
59 68
55 66
57 69
57 70
42 55
39 68
Q. Out of every 100
working age women, about
how many do you think are
in employment?
% point difference too low | too high Avg. guess Actual
23 © Ipsos Public Affairs PERILS OF PERCEPTION |
IN YOUR COUNTRY
LIVE IN A RURAL AREA?
WHAT PERCENTAGE OF PEOPLE
24 © Ipsos Public Affairs PERILS OF PERCEPTION |
+49
+36
+29
+28
+25
+24
+23
+22
+22
+21
+19
+19
+17
+16
+16
+16
+15
+15
+15
+14
+13
+13
+12
+12
+11
+9
+6
+5
+4
-2
-6
-10
-13
Japan
Belgium
Turkey
Mexico
Peru
Argentina
Chile
France
Netherlands
New Zealand
Brazil
Sweden
South Africa
Norway
United States
Canada
Australia
Colombia
Hungary
Israel
Germany
Italy
South Korea
Great Britain
Spain
Saudi Arabia
China
Ireland
Russia
Poland
Montenegro
Serbia
India
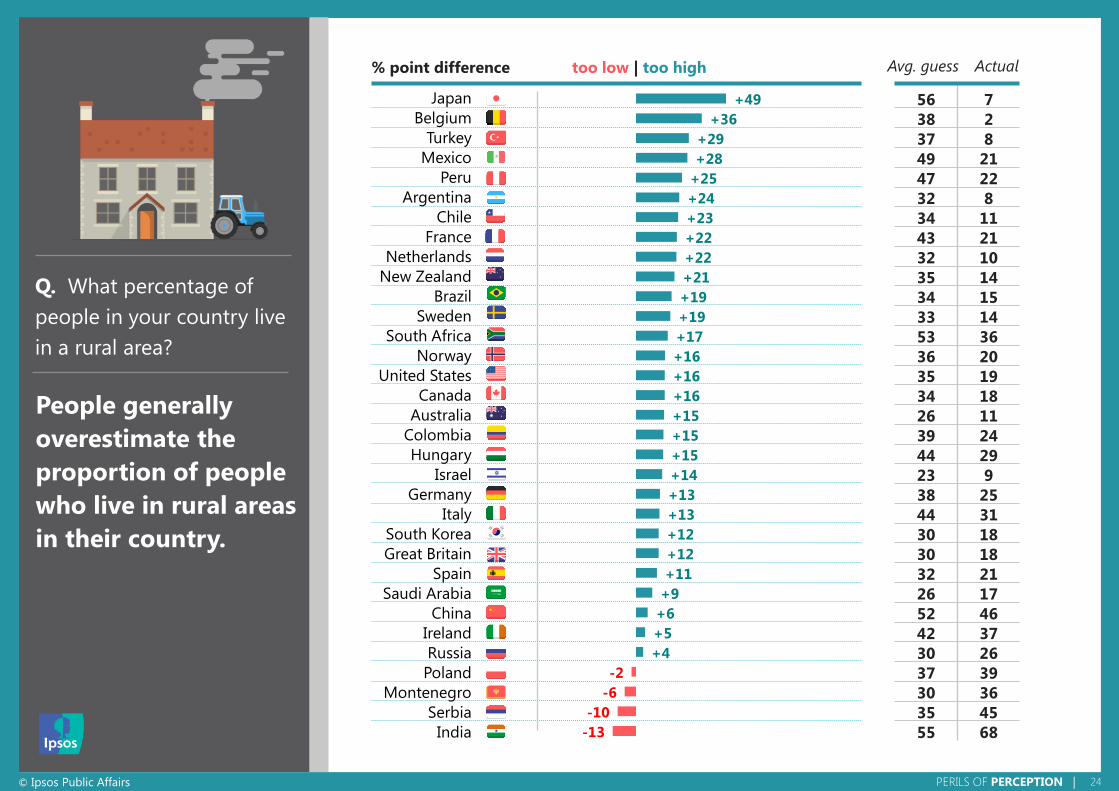
People generally
overestimate the
proportion of people
who live in rural areas
in their country.
56 7
38 2
37 8
49 21
47 22
32 8
34 11
43 21
32 10
35 14
34 15
33 14
53 36
36 20
35 19
34 18
26 11
39 24
44 29
23 9
38 25
44 31
30 18
30 18
32 21
26 17
52 46
42 37
30 26
37 39
30 36
35 45
55 68
Q. What percentage of
people in your country live
in a rural area?
% point difference too low | too high Avg. guess Actual
25 © Ipsos Public Affairs PERILS OF PERCEPTION |
OUT OF EVERY 100 PEOPLE
ABOUT HOW MANY DO YOU THINK
HAVE ACCESS TO THE INTERNET AT HOME
EITHER THROUGH A COMPUTER OR
MOBILE DEVICE?
26 © Ipsos Public Affairs PERILS OF PERCEPTION |
+41
+28
+26
+21
+21
+20
+19
+18
+16
+15
+13
+11
+10
+9
+3
+2
+1
-3
-4
-4
-5
-6
-6
-7
-8
-9
-9
-10
-11
-12
-12
-12
-16
India
Peru
China
Turkey
South Africa
Mexico
Brazil
Colombia
Serbia
Italy
Argentina
Chile
Montenegro
Poland
Russia
Spain
Saudi Arabia
Germany
Sweden
Hungary
Ireland
France
Norway
Belgium
Australia
Great Britain
South Korea
Netherlands
United States
New Zealand
Canada
Japan
Israel
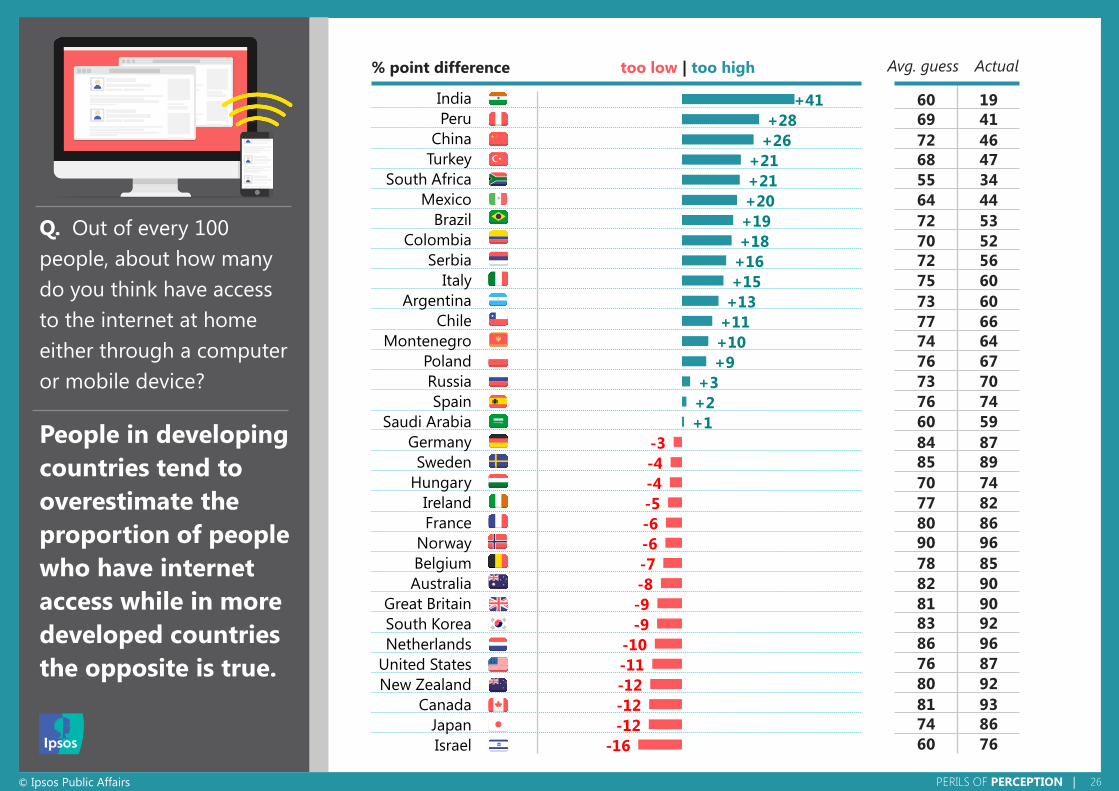
People in developing
countries tend to
overestimate the
proportion of people
who have internet
access while in more
developed countries
the opposite is true.
60 19
69 41
72 46
68 47
55 34
64 44
72 53
70 52
72 56
75 60
73 60
77 66
74 64
76 67
73 70
76 74
60 59
84 87
85 89
70 74
77 82
80 86
90 96
78 85
82 90
81 90
83 92
86 96
76 87
80 92
81 93
74 86
60 76
% point difference too low | too high Avg. guess Actual
Q. Out of every 100
people, about how many
do you think have access
to the internet at home
either through a computer
or mobile device?
27 © Ipsos Public Affairs PERILS OF PERCEPTION |
Looking across all questions,
we have calculated a
measure of how accurate the
population of each country
is.
This gives us our
“Index of Ignorance”
28 © Ipsos Public Affairs PERILS OF PERCEPTION |
18th
Germany
23rd
Sweden
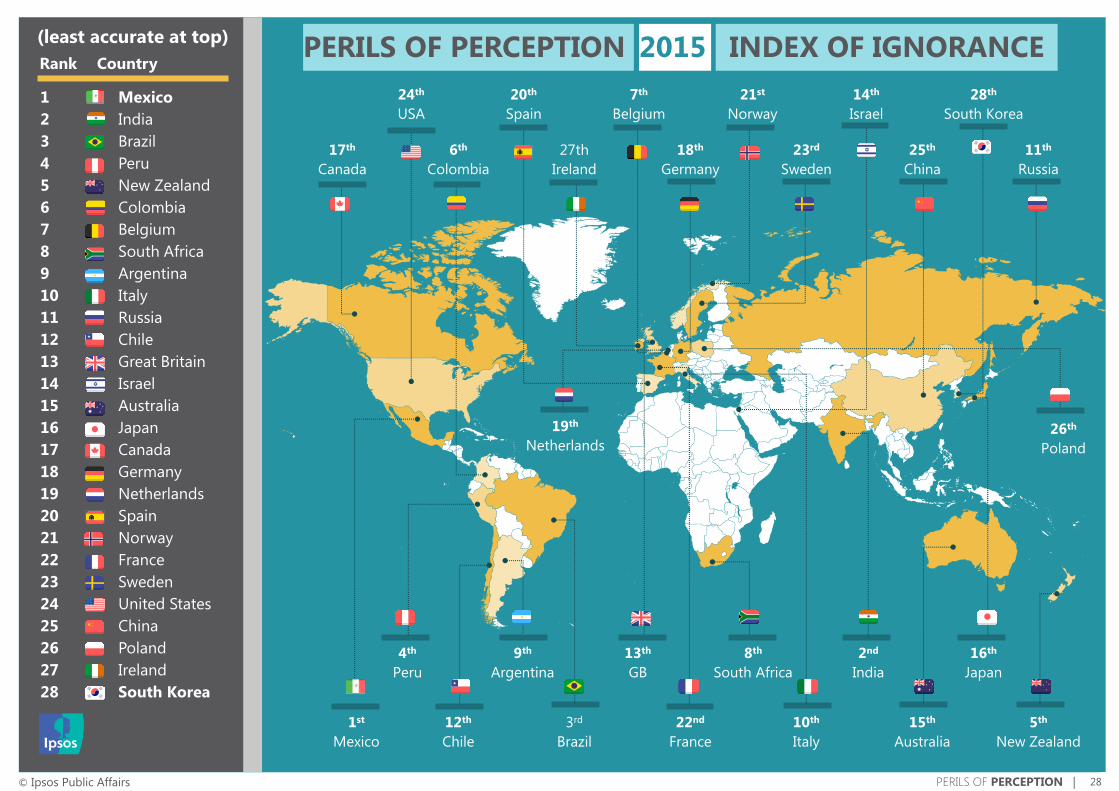
1 Mexico
2 India
3 Brazil
4 Peru
5 New Zealand
6 Colombia
7 Belgium
8 South Africa
9 Argentina
10 Italy
11 Russia
12 Chile
13 Great Britain
14 Israel
15 Australia
16 Japan
17 Canada
18 Germany
19 Netherlands
20 Spain
21 Norway
22 France
23 Sweden
24 United States
25 China
26 Poland
27 Ireland
28 South Korea
INDEX OF IGNORANCE (least accurate at top)
Rank Country
1st
Mexico
15th
Australia
13th
GB
9th
Argentina
5th
New Zealand
24th
USA
7th
Belgium
22nd
France
3rd
Brazil
8th
South Africa
21st
Norway
17th
Canada
27th
Ireland
10th
Italy
2nd
India
16th
Japan
6th
Colombia
20th
Spain
14th
Israel
25th
China
11th
Russia
28th
South Korea
12th
Chile
4th
Peru
19th
Netherlands 26th
Poland
PERILS OF PERCEPTION 2015
29 © Ipsos Public Affairs PERILS OF PERCEPTION |
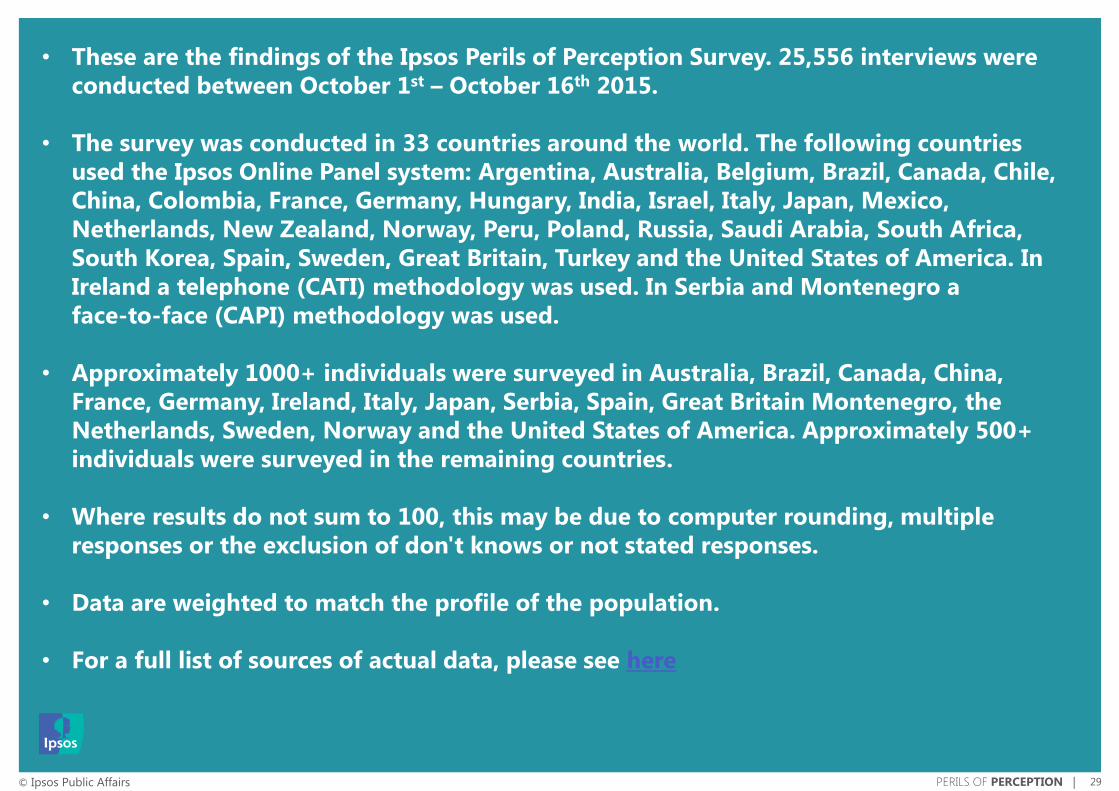
• These are the findings of the Ipsos Perils of Perception Survey. 25,556 interviews were
conducted between October 1st – October 16th 2015.
• The survey was conducted in 33 countries around the world. The following countries
used the Ipsos Online Panel system: Argentina, Australia, Belgium, Brazil, Canada, Chile,
China, Colombia, France, Germany, Hungary, India, Israel, Italy, Japan, Mexico,
Netherlands, New Zealand, Norway, Peru, Poland, Russia, Saudi Arabia, South Africa,
South Korea, Spain, Sweden, Great Britain, Turkey and the United States of America. In
Ireland a telephone (CATI) methodology was used. In Serbia and Montenegro a
face-to-face (CAPI) methodology was used.
• Approximately 1000+ individuals were surveyed in Australia, Brazil, Canada, China,
France, Germany, Ireland, Italy, Japan, Serbia, Spain, Great Britain Montenegro, the
Netherlands, Sweden, Norway and the United States of America. Approximately 500+
individuals were surveyed in the remaining countries.
• Where results do not sum to 100, this may be due to computer rounding, multiple
responses or the exclusion of don't knows or not stated responses.
• Data are weighted to match the profile of the population.
• For a full list of sources of actual data, please see here
30
For more information, please contact:
Bobby Duffy
@BobbyIpsosMORI
James Stannard
PERILS OF PERCEPTION 2015