Embed Size (px)
Citation preview
International Journal of Management Research and Development (IJMRD), ISSN 2248 – 938X(Print)
ISSN 2248 – 9398(Online), Volume 1, Number 2, May-October (2011)
62
CO-INTEGRATION AND CAUSALITY ANALYSIS OF DYNAMIC
LINKAGES BETWEEN INDIA AND DEVELOPED EQUITY
MARKETS: POST GLOBAL RECESSION PERIOD
Dr. MOHD. ASIF KHAN
ABSTRACT
This paper examines the relationship between Indian stock market and equity markets
of developed world for the post global recession period i.e. from March 2010 to March 2013
by using Johansen Multivariate Cointegration analysis and Granger Causality Test. Johansen
and Juselius Multivariate Cointegration analysis indicates that markets are integrated and
there exist a long term relationship between these markets. However pairwise Cointegration
analysis shows that Indian stock market is not cointegrated with equity market of Germany,
Japan and U.S.A, therefore funds managers of Germany, Japan and U.S.A can get the
benefits of portfolio diversification by investing in the Indian stock market for long term,
while it is cointegrated with Australia, France U.K and Hong-Kong, so, the stock market of
India does not qualify as a diversification opportunity for international portfolio managers of
these countries. Granger Causality Test analysis short run relationship between stock
markets of Japan, France, Germany, U.K, Hong-Kong and Australia and the stock market of
India. So, any development in these countries should be considered for policy making about
stock market of India.
Keywords: Stock Market, Johansen Multivariate Cointegration, Integration, Diversification.
1. INTRODUCTION
Today’s world is going in a new direction due to the globalization factor. Financial
world is reshaping itself. New market structures and practices are need of time due to
financial liberalization and elimination of traditional regulatory barriers and advancement of
technology .We are marching towards a globally integrated financial world. Emerging equity
markets are attracting the attention of global fund managers because these offer opportunity
for portfolio diversification. The benefits and costs of international portfolio
diversification need to be considered by anyone holding a financial Portfolio. Similarly, the
firm that is considering raising new resource needs to address the requirements of the global
marketplace.
© PRJ
PUBLICATION
International Journal of Management Research and
Development (IJMRD), ISSN 2248 – 938X(Print)
ISSN 2248 – 9398(Online), Volume 1, Number 2
May-October (2011), pp. 62-71
© PRJ Publication,
http://www.prjpublication.com/IJMRD.asp
IJMRD
International Journal of Management Research and Development (IJMRD), ISSN 2248 – 938X(Print)
ISSN 2248 – 9398(Online), Volume 1, Number 2, May-October (2011)
63
Since from last two decades, globalization is most visible feature in financial
markets. In globally integrated financial markets, investors and policy makers are
interested in taking advantage of efficiency enhancing aspects of market interaction.
An efficient monitoring and controlling of this process of market interaction is necessary
to avoid the undesirable destabilizing effects. Interdependence of markets, businesses,
regions, and continents has increased the interest of academician exploring international
market linkages.
The globalization of economic activity, the increased world wealth, and
the reduction in transaction costs associated with the information revolution all direct
investors to consider the newly emerging financial markets. Interaction of financial markets
is one of the most extensively discussed topics of financial literature. Various factors
contributed in this dimension. These include cross border movement of funds, the
technological innovations in communications, scientific trading and settlement systems, and
the introduction of innovative financial products. Globalizations also played a pivotal role in
increase the interest in the study of dynamic inter-linkages among financial markets.
So this study is aimed to understand the dynamic inter-linkages between India stock
market and the equity markets of developed world after global recession period. These
countries include USA, UK, France Germany, Japan Hong-Kong and Australia. If these
markets are not integrated then benefits of portfolio diversification can be reaped by investors
of these countries. Moreover, policy makers and regulators in these countries should not
worry about any contagious effects.
2. LITERATURE REVIEW
The majority of previous studies indicate that there is a long run relationship among
the financial markets in the world. Floros et al. (2005) investigated the long run and short run
relationships among stock prices in US, Japan and UK. He found that there is a long run
relationship among the mature markets. He also showed that there is a Granger bidirectional
causality between Nikkei 225—FTSE-100, and unidirectional causalities between S&P
500—FTSE-100 and S&P 500 –Nikkei 225.
Taylor and Tonks (1989) found the long run relationship between UK, Germany,
Netherlands and Japan stock markets. Yet, they could not find any cointegration for US. Kasa
(1992) analyzed the relationship of mature markets, namely US, Japan, UK, Canada and
Germany based on monthly data. He applied to Johansen estimation technique and reported
that there are four cointegrating vectors indicating a common stochastic trend among the
markets. Blackman, Holden and Thomas (1994) searched the improvement of cointegration.
They utilize Engle-Granger approach and find that comparing to 1970s cointegration has
increased in 1980s. Thus, this tells us that the scope for diversification has decreased during
the concerned time. Choudhry (1997) investigated the Latin American stock markets and US
stock market using cointegration technique. Corhay et al. (1994) and Chan and Lai (1993)
studied cointegration for US and Asia Pacific markets.
Masih and Masih (1997) investigated the dynamic relation between South Asian
countries, Taiwan, South Korea, Singapore, Hong Kong and developed countries US,
Germany, UK, and Japan. They found cointegration between these two. Wu and Su (1998)
did another study about Asia and US. They found cointegration among the US, Japan, UK
and Hong Kong stock markets. Jochum, Kirchgitssner and Platek, (1999) analyzed the long
run relationship between Eastern European stock markets for the period 1995-1998 and the
1997/98 Crisis in Emerging Markets. They found cointegration for these markets before the
International Journal of Management Research and Development (IJMRD), ISSN 2248 – 938X(Print)
ISSN 2248 – 9398(Online), Volume 1, Number 2, May-October (2011)
64
crisis using the Johansen methodology. In the third quarter of 1997, the long run equilibrium
is gone and there was massive changes in short run behavior of the markets. Goh (2005)
looked at the dynamic relationship among the five ASEAN markets, namely, Singapore,
Malaysia,Indonesia, Thailand and the Philippines. They found that the cointegration among
the stock indices before the crisisbut not during the crisis. Short-run linkages of Malaysia
with the other markets have weakened after the crisis.
However, some researchers could not find cointegration among the stock indices for
different countries. Arhanapalli and Doukas (1996) could not find the long term relationship
among Asian markets based on daily data by using Johansen estimation technique. Kanas
(1998) could not find any cointegration between US and Germany, UK, France, Switzerland,
Italy and Netherlands using Johansen technique either. Rirchards (1995) could not confirm
Kasa’s findings and concluded no cointegration using the same data. Richards imply that
there cannot be cointegration because this means stock prices can be predictable. Fernandez-
Serrano and Sosvilla-Rivero (2001) could not confirm any cointegration for stock indices of
Japan, Taiwan, South Korea, Singapore and Hong Kong using the Johansen technique for the
period 1977-1999.
This paper is important in the literature since India is the emerging stock market and
represent the success in the region to attract foreign direct investments and to benefit from the
globalization. We expect that there will be some connection between India and the developed
equity markets. Furthermore, there is no study done about these countries’ stock indices
during the concerned period i.e. post global recession period. This will be another
contribution of cointegration to the literature.
3. DATA DESCRIPTION AND METHODOLOGY
This empirical study is based on daily closing values of the stock market indices of 07
important equity markets of the developed world. Daily closing prices S&P500 Index (USA),
FTSE 100 (UK) index, CAC 40 index (France), DAX index (Germany), Nikkei 225 index
(Japan), HANGSENG (Hong-Kong) and AORD index (Australia) for the period March 1,
2010 to March 30, 2013 has been taken from Yahoo Finance. The continuously compounded
rate of return is calculated by using the following formula:
Rt = ln (Pt/Pt-1)*100
Where:
Rt = Return on day‘t’;
Pt = Index closing value on week‘t’
Pt-1 =Index closing value on week‘t-1’
ln= Natural log.
There are several methods for testing the flow of information and co-movement of
prices in stock markets across the countries. In this study the emphasis is given to test the
inter-market relationship among the stock market in Pakistan with that of equity markets of
developed world, via; (i). Descriptive statistics; (ii). Correlation matrix, (iii) Co integration
tests, and (iv) Granger causality test
Cointrgration analysis requires that time series should be integrated of same order.
Stationarity of time series has been examined by using unit root tests. Augmented Dickey-
Fuller Test and Phillips- Perron Test have been employed for said purpose.
International Journal of Management Research and Development (IJMRD), ISSN 2248 – 938X(Print)
ISSN 2248 – 9398(Online), Volume 1, Number 2, May-October (2011)
65
The Augumented Dickey Fuller test examines the presence of unit root in an autoregressive
model. A simple AR (1) model is
yt = ρyt − 1 + ut, where yt is the variable of interest, t is the time index, ρ is a coefficient, and
ut is the disturbance term. The regression model can be written as
∆yt = (ρ−1) yt−1 + ut = δyt − 1 + ut,
Where, ∆ is the first difference operator. This model can be estimated and testing for a unit
root is equivalent to testing. δ = 0.
A financial time series is said to be integrated of one order i.e, I (1), if it becomes
stationary after differencing once. If two series are integrated of order one, there may have a
linear combination that may be stationary without differencing. If said condition fulfills then
these are called cointegrated.
The Johansen (1988) and Johansen and Juselius (1990) procedure test the presence of
long run relationship between the variables. Johansen and Juselius propose two likelihood
ratio tests for the determination of the number of cointegrated vectors. One is the maximal
eigenvalue test which evaluates the null hypothesis that there are at most r cointegrating
vectors against the alternative of r + 1 cointegrating vectors. The maximum eigen value
statistic is given by,
λmax = - T ln (1 - λr+1)
Where λ r+1,…,λn are the n-r smallest squared canonical correlations and T = the number of
observations.
The second test is based on the trace statistic which tests the null hypothesis of r cointegrating
vectors against the alternative of r or more cointegrating vectors. This statistic is given by:
λ trace = -T Σ ln (1 - λi)
In order to apply the Johansen procedure, a lag length must be selected for the VAR. A lag
length of is selected on the basis of the Akaike Information Criterion (AIC).
Granger representation theorem provides that if two variables are cointegrated then Granger
causality must exist in at least one direction, which is a consequence of the relationships
described by the ECM. Error Correction Model enables us to capture both the short-run
dynamics and long-run relationships between the indices.
4. EMPIRICAL RESULTS
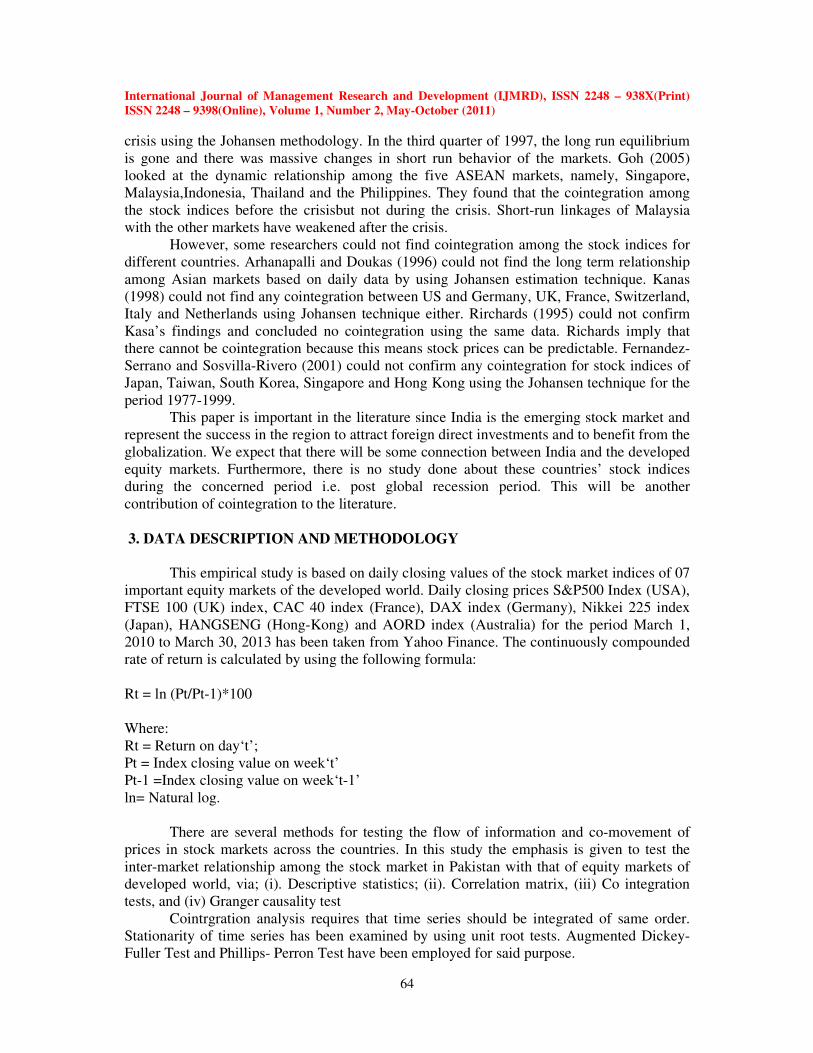
Descriptive statistics for the stock indices returns are given in Table 1. These include
the distribution of mean, standard deviation, skewness and kurtosis etc. A careful
examination reveals that S&P 500 U.S offers the highest return 0.04% per day at a reasonable
risk level, while Germany (DAX) and Japan (NIKKEI) offering second highest return. India
and U.K are offering low returns around 3% per annum and France market is offering
negative returns. All of the markets are negatively skewed except India and France.
International Journal of Management Research and Development (IJMRD), ISSN 2248 – 938X(Print)
ISSN 2248 – 9398(Online), Volume 1, Number 2, May-October (2011)
66
Table 1: Descriptive Statistics
RTNAORD RTNBSE RTNCAC RTNDAX RTNFTSE RTNHENG RTNNIK RTNSP
Mean 0.000006 0.012231 -0.00376 0.029903 0.014138 0.006803 0.026248 0.038216
Median 0.000305 0 0.004117 0.041082 0 0 0 0.038915
Maximum 0.034368 3.518089 9.220798 5.210379 5.032269 5.518693 5.52232 4.631738
Minimum -0.043 -4.21288 -5.63464 -5.99466 -4.77923 -5.82703 -11.1534 -6.89583
Std. Dev. 0.009566 1.059612 1.527628 1.405489 1.092364 1.230456 1.298092 1.13274
Skewness -0.2897 0.077198 0.09197 -0.12688 -0.13556 -0.28061 -0.86203 -0.42791
Kurtosis 4.402807 3.63357 6.01552 5.336138 5.060517 5.710135 10.42962 7.119857
Jarque-Bera 76.49809 14.12181 303.0989 183.3743 143.4345 254.3695 1931.784 587.975
Probability 0 0.000858 0 0 0 0 0 0
Sum 0.048095 9.74812 -2.99508 23.83283 11.26776 5.422161 20.91988 30.45808
Sum Sq Dev 0.072843 893.7318 1857.584 1572.418 949.835 1205.162 1341.295 1021.347
Observations 797 797 797 797 797 797 797 797
Fig: 1 Graph of Markets Movements
The linked image cannot be display ed. The file may hav e been mov ed, renamed, or deleted. V erify that the link points to the correct file and location.
International Journal of Management Research and Development (IJMRD), ISSN 2248 – 938X(Print)
ISSN 2248 – 9398(Online), Volume 1, Number 2, May-October (2011)
67
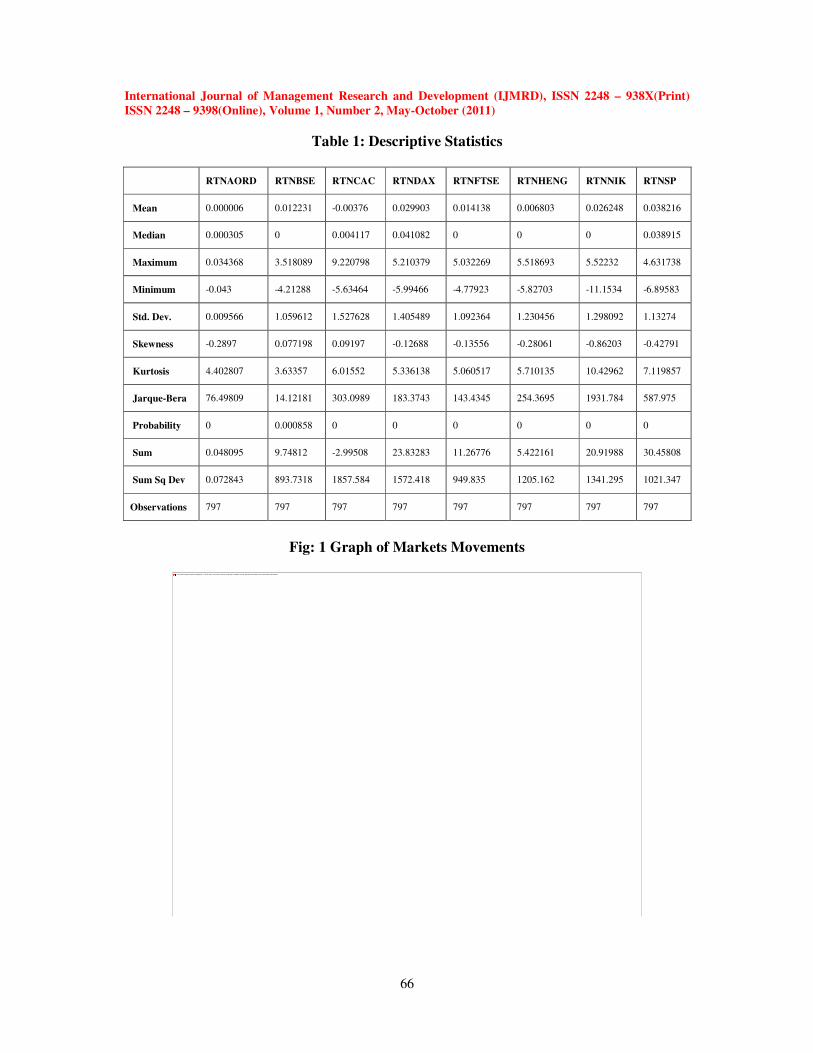
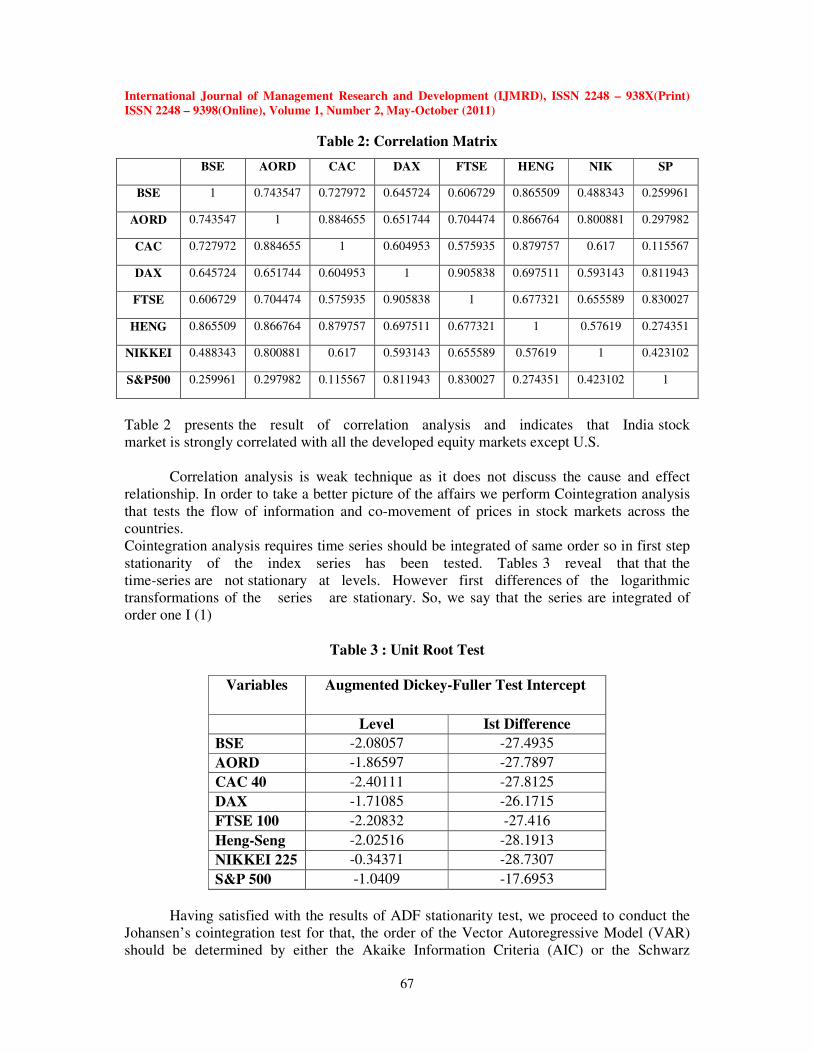
Table 2: Correlation Matrix
Table 2 presents the result of correlation analysis and indicates that India stock
market is strongly correlated with all the developed equity markets except U.S.
Correlation analysis is weak technique as it does not discuss the cause and effect
relationship. In order to take a better picture of the affairs we perform Cointegration analysis
that tests the flow of information and co-movement of prices in stock markets across the
countries.
Cointegration analysis requires time series should be integrated of same order so in first step
stationarity of the index series has been tested. Tables 3 reveal that that the
time-series are not stationary at levels. However first differences of the logarithmic
transformations of the series are stationary. So, we say that the series are integrated of
order one I (1)
Table 3 : Unit Root Test
Variables Augmented Dickey-Fuller Test Intercept
Level Ist Difference
BSE -2.08057 -27.4935
AORD -1.86597 -27.7897
CAC 40 -2.40111 -27.8125
DAX -1.71085 -26.1715
FTSE 100 -2.20832 -27.416
Heng-Seng -2.02516 -28.1913
NIKKEI 225 -0.34371 -28.7307
S&P 500 -1.0409 -17.6953
Having satisfied with the results of ADF stationarity test, we proceed to conduct the
Johansen’s cointegration test for that, the order of the Vector Autoregressive Model (VAR)
should be determined by either the Akaike Information Criteria (AIC) or the Schwarz
BSE AORD CAC DAX FTSE HENG NIK SP
BSE 1 0.743547 0.727972 0.645724 0.606729 0.865509 0.488343 0.259961
AORD 0.743547 1 0.884655 0.651744 0.704474 0.866764 0.800881 0.297982
CAC 0.727972 0.884655 1 0.604953 0.575935 0.879757 0.617 0.115567
DAX 0.645724 0.651744 0.604953 1 0.905838 0.697511 0.593143 0.811943
FTSE 0.606729 0.704474 0.575935 0.905838 1 0.677321 0.655589 0.830027
HENG 0.865509 0.866764 0.879757 0.697511 0.677321 1 0.57619 0.274351
NIKKEI 0.488343 0.800881 0.617 0.593143 0.655589 0.57619 1 0.423102
S&P500 0.259961 0.297982 0.115567 0.811943 0.830027 0.274351 0.423102 1
International Journal of Management Research and Development (IJMRD), ISSN 2248 – 938X(Print)
ISSN 2248 – 9398(Online), Volume 1, Number 2, May-October (2011)
68
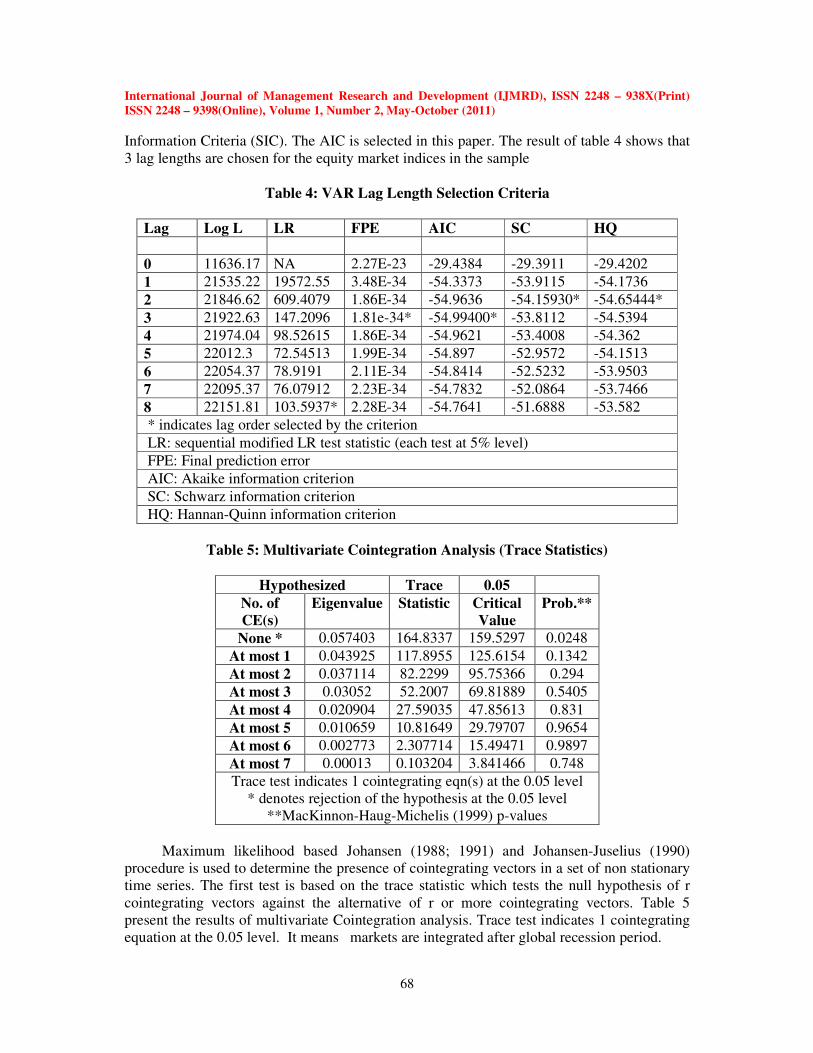
Information Criteria (SIC). The AIC is selected in this paper. The result of table 4 shows that
3 lag lengths are chosen for the equity market indices in the sample
Table 4: VAR Lag Length Selection Criteria
Lag Log L LR FPE AIC SC HQ
0 11636.17 NA 2.27E-23 -29.4384 -29.3911 -29.4202
1 21535.22 19572.55 3.48E-34 -54.3373 -53.9115 -54.1736
2 21846.62 609.4079 1.86E-34 -54.9636 -54.15930* -54.65444*
3 21922.63 147.2096 1.81e-34* -54.99400* -53.8112 -54.5394
4 21974.04 98.52615 1.86E-34 -54.9621 -53.4008 -54.362
5 22012.3 72.54513 1.99E-34 -54.897 -52.9572 -54.1513
6 22054.37 78.9191 2.11E-34 -54.8414 -52.5232 -53.9503
7 22095.37 76.07912 2.23E-34 -54.7832 -52.0864 -53.7466
8 22151.81 103.5937* 2.28E-34 -54.7641 -51.6888 -53.582
* indicates lag order selected by the criterion
LR: sequential modified LR test statistic (each test at 5% level)
FPE: Final prediction error
AIC: Akaike information criterion
SC: Schwarz information criterion
HQ: Hannan-Quinn information criterion
Table 5: Multivariate Cointegration Analysis (Trace Statistics)
Hypothesized Trace 0.05
No. of
CE(s)
Eigenvalue Statistic Critical
Value
Prob.**
None * 0.057403 164.8337 159.5297 0.0248
At most 1 0.043925 117.8955 125.6154 0.1342
At most 2 0.037114 82.2299 95.75366 0.294
At most 3 0.03052 52.2007 69.81889 0.5405
At most 4 0.020904 27.59035 47.85613 0.831
At most 5 0.010659 10.81649 29.79707 0.9654
At most 6 0.002773 2.307714 15.49471 0.9897
At most 7 0.00013 0.103204 3.841466 0.748
Trace test indicates 1 cointegrating eqn(s) at the 0.05 level
* denotes rejection of the hypothesis at the 0.05 level
**MacKinnon-Haug-Michelis (1999) p-values
Maximum likelihood based Johansen (1988; 1991) and Johansen-Juselius (1990)
procedure is used to determine the presence of cointegrating vectors in a set of non stationary
time series. The first test is based on the trace statistic which tests the null hypothesis of r
cointegrating vectors against the alternative of r or more cointegrating vectors. Table 5
present the results of multivariate Cointegration analysis. Trace test indicates 1 cointegrating
equation at the 0.05 level. It means markets are integrated after global recession period.
International Journal of Management Research and Development (IJMRD), ISSN 2248 – 938X(Print)
ISSN 2248 – 9398(Online), Volume 1, Number 2, May-October (2011)
69
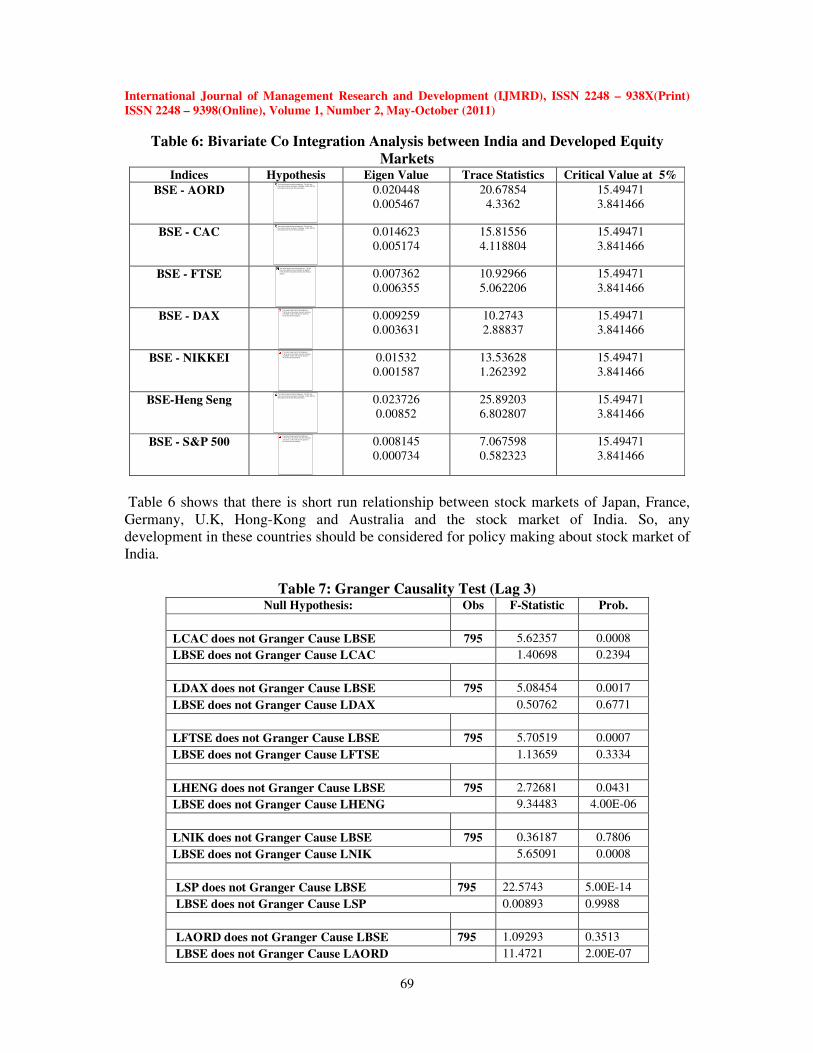
Table 6: Bivariate Co Integration Analysis between India and Developed Equity
Markets Indices Hypothesis Eigen Value Trace Statistics Critical Value at 5%
BSE - AORD
0.020448
0.005467
20.67854
4.3362
15.49471
3.841466
BSE - CAC
0.014623
0.005174
15.81556
4.118804
15.49471
3.841466
BSE - FTSE
0.007362
0.006355
10.92966
5.062206
15.49471
3.841466
BSE - DAX
0.009259
0.003631
10.2743
2.88837
15.49471
3.841466
BSE - NIKKEI
0.01532
0.001587
13.53628
1.262392
15.49471
3.841466
BSE-Heng Seng
0.023726
0.00852
25.89203
6.802807
15.49471
3.841466
BSE - S&P 500
0.008145
0.000734
7.067598
0.582323
15.49471
3.841466
Table 6 shows that there is short run relationship between stock markets of Japan, France,
Germany, U.K, Hong-Kong and Australia and the stock market of India. So, any
development in these countries should be considered for policy making about stock market of
India.
Table 7: Granger Causality Test (Lag 3) Null Hypothesis: Obs F-Statistic Prob.
LCAC does not Granger Cause LBSE 795 5.62357 0.0008
LBSE does not Granger Cause LCAC 1.40698 0.2394
LDAX does not Granger Cause LBSE 795 5.08454 0.0017
LBSE does not Granger Cause LDAX 0.50762 0.6771
LFTSE does not Granger Cause LBSE 795 5.70519 0.0007
LBSE does not Granger Cause LFTSE 1.13659 0.3334
LHENG does not Granger Cause LBSE 795 2.72681 0.0431
LBSE does not Granger Cause LHENG 9.34483 4.00E-06
LNIK does not Granger Cause LBSE 795 0.36187 0.7806
LBSE does not Granger Cause LNIK 5.65091 0.0008
LSP does not Granger Cause LBSE 795 22.5743 5.00E-14
LBSE does not Granger Cause LSP 0.00893 0.9988
LAORD does not Granger Cause LBSE 795 1.09293 0.3513
LBSE does not Granger Cause LAORD 11.4721 2.00E-07
The linked image cannot be display ed. The file may
hav e been mov ed, renamed, or deleted. V erify that the
link points to the correct file and location.
The linked image cannot be display ed. The file may
hav e been mov ed, renamed, or deleted. V erify that the
link points to the correct file and location.
The linked image cannot be display ed. The file
may hav e been mov ed, renamed, or deleted.
V erify that the link points to the correct file and
location.
The linked image cannot be display ed.
The file may hav e been mov ed, renamed,
or deleted. V erify that the link points to
the correct file and location.
The linked image cannot be display ed.
The file may hav e been mov ed, renamed,
or deleted. V erify that the link points to
the correct file and location.
The linked image cannot be display ed. The file may
hav e been mov ed, renamed, or deleted. V erify that the
link points to the correct file and location.
The linked image cannot be display ed.
The file may hav e been mov ed, renamed,
or deleted. V erify that the link points to
the correct file and location.
International Journal of Management Research and Development (IJMRD), ISSN 2248 – 938X(Print)
ISSN 2248 – 9398(Online), Volume 1, Number 2, May-October (2011)
70
According to representation theorem, if two variables are cointegrated then Granger-
causality must exist in at least one direction. Results of Granger causality are reported in
Table 7. Rejection of the null hypothesis at 5% indicates that there exist bidirectional granger
causality from India to Hong Kong and unidirectional causality from India to Japan and
Australia while Germany, France and U.K causes India stock market in short term. So any
change occurs in Germany, France U.K stock market will affect the Indian stock market.
5. CONCLUSION
This study empirically investigates the co movement of India’s equity market with
seven selected international stock markets (i.e. Australia, Germany, France, UK, USA, Hong
Kong and Japan). Based on the results on daily stock indices it is found that among all the
selected indices of different countries, Americas’ equity market (S&P 500) earned highest
average daily return with medium standard deviation. It is also evident from the results that
there is no integration of the India stock market with the markets of Germany, Japan and
U.S.A. This situation implies that stock market of India provides as an attractive
diversification opportunity for international portfolio managers of these countries. However
the stock market of India is integrated with Australia, France U.K and Hong-Kong, so, the
stock market of India does not qualify as a diversification opportunity for international
portfolio managers of these countries. It is also concluded that there is short run relationship
between stock markets of Japan, France, Germany, U.K, Hong-Kong and Australia and the
stock market of India. So, any development in these countries should be considered for policy
making about stock market of India.
REFERENCES
1. Arshanapalli, B. and J. Doukas (1996), “Pacific Basin Stock Market Linkages”, Research
in International Business and Finance, Supplement (I), pp. 101-109.
2. Blackman, S., K. Holden, and W. Thomas (1994), “Long-term Relationships between
International Share Prices”, Applied Financial Economics4 (4), pp. 297-304.
3. Chan, K., and P. Lai (1993)“Unit Root and Cointegration Tests of World Stock Prices”, In
R-Stanley (ed.), International Financial Market Integration. Oxford: Blackwell.
4. Choudhry, T. (1997), “Stochastic Trends in Stock Prices: Evidence from Latin American
Markets”, Journal of Macroeconomics19 (2), pp. 285-304.
5. Corhay, A., A. Rad, and J.-P. Urbain (1994), “Co-movements and Dynamic
Interrelationships in Pacific Basin Stock Markets”, Research in International Business and
FinanceI 1 (B), pp. 93-105.
6. Dornbusch, R., Y. C. Park and S. Claessens (2000), “Contagion: Understanding How It
Spreads”, The World Bank Research Observer15, pp. 177–97.
7. Floros, C. (2005), “Price Linkages Betweenthe US, Japan and UK Stock Markets”,
Financial Markets and Portfolio Management19, 2, pp. 169-178.
8. Fernandez-Serrano, J. L. and S. Sosvilla-Rivero (2001), “Modeling Evolving Long-run
Relationships: The Linkages between Stock Markets in Asia”, Japan and the World Economy
13(2), 145–160.
9. Granger, C. W. J. (1986), “Developments in the Study of Cointegrated Economic
Variables”, Oxford Bulletin of Economics and Statistics 48, pp. 213–228.
International Journal of Management Research and Development (IJMRD), ISSN 2248 – 938X(Print)
ISSN 2248 – 9398(Online), Volume 1, Number 2, May-October (2011)
71
10. Goh, Kim_Leng, Y-C, Wong, K-L Kok (2005), “Financial Crisis and Intertemporal
Linkages Across the ASEAN-5 Stock Markets”, Review of Quantitative Finance and
Accounting, 24, pp. 359–377.
11. Jochum, C., Kirchgitssner, G., and Platek, M. (1999), “A Long-Run Relationship between
Eastern European Stock Markets? Cointegration and the 1997/98 Crisis in Emerging
Markets”, Review of World Economics135, pp. 454-479.
12. Johansen, S. (1988), “Statistical Analysis of Cointegrating Vectors”, Journal of Economic
Dynamics and Control12, pp. 231–254.
13. Johansen, S. and K. Jusellius (1990), “Maximum Likelihood Estimation and Inference on
Cointegration- with Applications to the Demand for Money”, Oxford Bulletin of Economics
and Statistics52, pp. 169–210.
14. Kanas, A. (1998), “Linkages Between the US and European Equity Markets: Further
Evidence from Cointegration Tests”, Applied Financial Economics8, pp. 607–614.
15. Kasa, K. (1992), “Common Stochastic Trends in International Stock Markets”, Journal of
Monetary Economics29 (1), pp. 95-124.
16. Masih A.M.M. and R. Masih (1997), “A Comparative Analysis of the Propagation of
Stock Market Fluctuations in Alternative Models of Dynamic Causal Linkages”, Applied
Financial Economics7 (1), pp. 59-74.
17. Richards, A. (1995), “Co-movements in National Stock Market Returns: Evidence of
Predictability, but not Cointegration”, Journal of Monetary Economics36 (3), pp. 631-654.
18. Taylor, M. P. and I. Tonks (1989), “The Internationalization of Stock Markets and the
Abolition of UK Exchange Control”, Review of Economics and Statistics71, pp. 332–336.
19. Wu, C. and Y. Su (1998), “Dynamic Relations among International Stock Markets”,
International Review of Economics and Finance7, pp. 63–84