Embed Size (px)
Citation preview

WestRock Investor PresentationMarch 2017

2
Forward-looking statements
This presentation contains forward-looking statements within the meaning of the Private Securities Litigation Reform Act of 1995, including but not
limited to the statements on the slides entitled “Building a Paper and Packaging Leader”, “Q1 FY17 Quarter Results on Track”, “Synergy and
Performance Improvements”, “Guidance Update”, “WestRock to Acquire Multi Packaging Solutions – Transaction Summary”, “$85 Million
Opportunity for Synergies and Performance Improvements by End of FY19”, “Combined Financial Profile”, “Q1 FY17 Consumer Packaging Results”
and “Key Commodity Annual Consumption Volumes and FX by Currency” that give guidance or estimates for future periods as well as statements
regarding, among other things, that we expect a run-rate of $800 million in synergy and performance improvements by end of FY17 and to achieve
$1 billion goal by end of FY18; the at we anticipate net proceeds of approximately $1 billion, after taxes and transaction expenses related to the sale
of our Home, health and Beauty business; that PPW published price declines in SBS are expected to carry throughout FY17; that the Multi
Packaging Solutions transaction advances our strategy to provide differentiated, high value-added solutions to our customers, enhances our
capabilities to serve new and existing customers, expands our participation into attractive end markets, creates meaningful synergy and performance
improvement opportunities of $85 million by end of FY19, increases our paperboard consumption by approx. 225k tons, of which we expect 35% –
45% to be supplied by WestRock, replaces pulp production with SBS across the system, balances our Corrugated / Consumer sales mix and is
expected to close in fiscal Q3 2017; that the acquisition will be immediately free cash flow and EPS accretive; that the acquisition offers attractive
synergy opportunities and upside from commercial and cross-selling opportunities; that we expect FY17 Adjusted Free Cash Flow to be $1.2 billion;
certain sequential benefits and negative sequential impacts on Q2 FY17 pretax earnings; scheduled maintenance downtime in FY17, and expected
annual consumption volumes.
Forward-looking statements are based on our current expectations, beliefs, plans or forecasts and are typically identified by words or phrases such
as "may," "will," "could," "should," "would," "anticipate," "estimate," "expect," "project," "intend," "plan," "believe," "target," "prospects," "potential" and
"forecast," and other words, terms and phrases of similar meaning. Forward-looking statements involve estimates, expectations, projections, goals,
forecasts, assumptions, risks and uncertainties. We caution readers that a forward-looking statement is not a guarantee of future performance and
that actual results could differ materially from those contained in the forward-looking statement. With respect to these statements, we have made
assumptions regarding, among other things, the results and impacts of the merger of MeadWestvaco and RockTenn; the potential results and
impacts of the proposed acquisition of Multi Packaging Solutions; economic, competitive and market conditions generally; volumes and price levels
of purchases by customers; competitive conditions in our businesses and possible adverse actions of their customers, competitors and suppliers.
Further, our businesses are subject to a number of general risks that would affect any such forward-looking statements including, among others,
decreases in demand for their products; increases in energy, raw materials, shipping and capital equipment costs; reduced supplies of raw materials;
fluctuations in selling prices and volumes; intense competition; the potential loss of certain customers; the scope, costs, timing and impact of any
restructuring of our operations and corporate and tax structure; the occurrence of a natural disaster or other unanticipated problems such as labor
difficulties, equipment failure or unscheduled maintenance and repair, which could result in operational disruptions of varied duration; our desire or
ability to continue to repurchase company stock; and adverse changes in general market and industry conditions. Such risks and other factors that
may impact management's assumptions are more particularly described in our filings with the Securities and Exchange Commission, including in
Item 1A under the caption "Risk Factors" in our Annual Report on Form 10-K for the fiscal year ended September 30, 2016 and our Form 10-Q for
the quarterly period ending December 31, 2016. The information contained herein speaks as of the date hereof and WestRock does not have or
undertake any obligation to update or revise its forward-looking statements, whether as a result of new information, future events or otherwise.

3
Disclaimer; non-GAAP financial measures
We may from time to time be in possession of certain information regarding WestRock that applicable law would not require us to disclose to the
public in the ordinary course of business, but would require us to disclose if we were engaged in the purchase or sale of our securities. This
presentation shall not be considered to be part of any solicitation of an offer to buy or sell WestRock securities. This presentation also may not
include all of the information regarding WestRock that you may need to make an investment decision regarding WestRock securities. Any investment
decision should be made on the basis of the total mix of information regarding WestRock that is publicly available as of the date of the decision.
We report our financial results in accordance with accounting principles generally accepted in the United States ("GAAP"). However, management
believes certain non-GAAP financial measures provide users with additional meaningful financial information that should be considered when
assessing our ongoing performance. Management also uses these non-GAAP financial measures in making financial, operating and planning
decisions and in evaluating our performance. Non-GAAP financial measures should be viewed in addition to, and not as an alternative for, our GAAP
results. The non-GAAP financial measures we present may differ from similarly captioned measures presented by other companies. See the
Appendix for details about these non-GAAP financial measures, as well as the required reconciliations.

4
Building a Paper and Packaging Leader
1) Non-GAAP Financial Measure. We believe the most directly comparable GAAP measure is Operating Cash Flow. See Use of Non-GAAP Financial Measures and Reconciliation in Appendix.
Comprehensive
Portfolio of
Paper and Packaging
Solutions
• Holds #1 or #2 positions in attractive paper and packaging markets
• Unmatched breadth of product offerings, capabilities and geographic reach
• Differentiated paper and packaging solutions that help our customers win
Track Record of Solid
Execution
• Solid execution in synergy and productivity improvements: run-rate of $580 million through Q1 FY17; expect $800 million run-rate by end of FY17 and to achieve $1 billion goal by end of FY18
• Q1 FY17 Adjusted Free Cash Flow of $369 million(1)
• Purchased SP Fiber and Cenveo Packaging, formed Gondi JV, and completed Ingevity separation in FY16
Growing Shareholder
Value Using
Balanced Capital
Allocation
• Announced divestiture of Home, Health and Beauty business for $1.025 billion and anticipated net proceeds of approx. $1 billion, after taxes and transaction expenses
• Announced acquisition of Multi Packaging Solutions
• Returned $1.3 billion to stockholders since merger through dividends and share repurchases
5
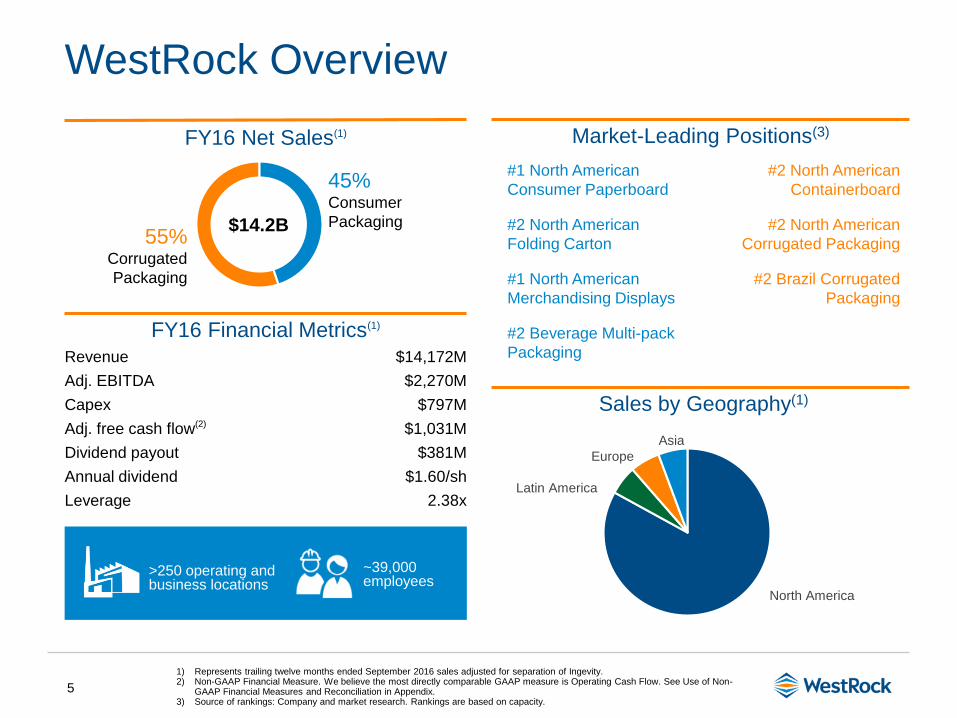
WestRock Overview
FY16 Net Sales(1)
45%Consumer
Packaging55%
Corrugated
Packaging
$14.2B
North America
Latin America
Europe
Asia
1) Represents trailing twelve months ended September 2016 sales adjusted for separation of Ingevity.2) Non-GAAP Financial Measure. We believe the most directly comparable GAAP measure is Operating Cash Flow. See Use of Non-
GAAP Financial Measures and Reconciliation in Appendix.3) Source of rankings: Company and market research. Rankings are based on capacity.
~39,000 employees
>250 operating and business locations
FY16 Financial Metrics(1)
Revenue $14,172M
Adj. EBITDA $2,270M
Capex $797M
Adj. free cash flow(2) $1,031M
Dividend payout $381M
Annual dividend $1.60/sh
Leverage 2.38x
Market-Leading Positions(3)
#1 North American
Consumer Paperboard
#2 North American
Folding Carton
#1 North American
Merchandising Displays
#2 Beverage Multi-pack
Packaging
#2 North American
Containerboard
#2 North American
Corrugated Packaging
#2 Brazil Corrugated
Packaging
Sales by Geography(1)

6
Growth in North America and Brazil corrugated box demand
Solid EBITDA margins from merger synergies and productivity benefits
• Q1 FY17 segment sales of $1,944 million
• Box shipments up +2.2% in Q1 on a per day basis
• Grupo Gondi joint venture sales of $186 million, EBITDA margins (2) of almost 20% (3)
• Strong volume growth in Brazil with box shipments per day up 7% yoy
• Successfully implementing containerboard price increase
• Q1 FY17 segment sales of $1,511 million
• Q1 FY17 EBITDA margin(2) of 14.2%
• Strong operational execution and realization of productivity benefits
• Stable shipments of paperboard and converted products
• Paperboard inventory declined by 87k tons yoy
Q1 FY17 Quarter Results on Track
Expected to deliver $1.2 billion of adjusted free cash flow(1) in FY17
Q1 FY17 EBITDA Margin(2)
North America: 15.8%
Brazil: 24.4%
Consumer Packaging
Q1 FY17 EBITDA Margin(2)
Consumer: 14.2%
1) Non-GAAP financial measure. We believe the most directly comparable GAAP measure is Operating Cash Flow. See Use of Non-GAAP Financial Measures and Reconciliation in Appendix.
2) Non-GAAP financial measure. See reconciliation in Appendix.3) We hold a 25% ownership interest in Grupo Gondi.
Corrugated Packaging

7
$165million
$580million
$800million
$1billion
$255million
$350million
$425million
$500million
Q4 FY15 Q1 FY16 Q2 FY16 Q3 FY16 Q4 FY16 Q1 FY17 FY17 FY18
Synergy and Performance Improvements
On track to achieve $1 billion
objective by end of FY18
• Achieved annualized run-rate of $580 million at 12/31
• Estimate annualized run-rate of $800 million by end
of FY17
(1)
(1)
37%
28%
23%
12%
Procurement
Capital
Investment
Ongoing
Productivity
Corporate & Support
$580
million
35%
30%
25%
10%
Duplicative Corp & Support Functions
Capital
Investment
Procurement
Ongoing
Productivity
Q1 FY17 Progress Run Rate at 12/31/16
Three Year Goal
$1
billion

8
JULY
2 0 1 5
OCTOBER
2 0 1 5
JANUARY
2 0 1 6
Merged MWV and RockTenn to form WestRock
Acquired SP Fiber
Acquired Cenveo
APRIL
2 0 1 6Completed
joint venture with Grupo
Gondi
MAY
2 0 1 6
Completed separation of
Ingevity
JANUARY
2 0 1 7Announced sale of HHB
to Silgan
JANUARY
2 0 1 7
Announced acquisition
of MPS
Strengthening the WestRock Portfolio

Acquisition of Multi Packaging Solutions

10
WestRock to Acquire Multi Packaging SolutionsTransaction Summary
Compelling Strategic
Combination
• Advances strategy to provide differentiated, high value-added solutions to our customers
• Enhances capabilities to serve new and existing customers
• Expands participation into attractive end markets
• Creates opportunity for meaningful synergies and performance improvements of $85 million by end of FY19
• Increases annual paperboard consumption by approx. 225k tons, of which we expect 35% – 45% to be supplied by WestRock
• Replaces pulp production with SBS across the system
• Balances Corrugated / Consumer sales mix
Attractive Financial
Profile
• Purchase price of $18.00 per share; total enterprise value of $2.28 billion
• 9.6x LTM EBITDA as of 9/30/16; 7.1x including anticipated synergy and performance improvements
• Expected to be immediately free cash flow and EPS accretive, inclusive of purchase accounting adjustments
• 100% cash offer, financed through a combination of current cash, anticipated HH&B proceeds and existing lines of credit
• Pro forma net leverage of 2.55x including synergies
Timeline• Subject to MPS shareholder approval and other customary closing conditions
• Expected to close in fiscal Q3 2017

11
Consumer
Healthcare
Multi-Media
Multi Packaging Solutions Overview
A leading global provider of specialty packaging solutions
• High value-added solutions primarily
focused on the consumer and healthcare
markets
Diverse customer base with long‐term
relationships
• Global footprint with 59 sites in Europe,
North America and Asia
• Financial Highlights(1):
LTM Revenue of $1.6 billion
LTM Adjusted EBITDA of $237 million
14.7% adjusted EBITDA margin
• Led by CEO Marc Shore and President
Dennis Kaltman. Both will join WestRock
Combined 50+ years industry experience
EN
D M
AR
KE
T
Net Sales Breakdown(1)
Premium Folding Carton
Inserts
Labels
Rigid Packaging
Other
North America
Europe
Asia
PR
OD
UC
TG
EO
GR
AP
HY
(1) LTM as of 9/30/16

12
$85 Million Opportunity for Synergies and Performance Improvements by End of FY19
Attractive synergy opportunities and upside from commercial and cross-sell opportunities
+ SBS
Sold
SBS
Paperboard Integration
Ongoing Performance
Improvements
Procurement & Supply Chain
SG&A & Public Co Costs
Asset Optimization
$85 million

13
($ in millions) LTM: 12/31/16 LTM: 9/30/16
Sale ofHome, Health and Beauty
Revenue $14,148 $1,610 ($571) $15,187
Adjusted
EBITDA(1)$2,219 $237 ($107) $2,434(2)
% Margin(1) 15.7% 14.7% 16.0%
Est. Debt at
Closing$6,382
Est. Leverage
Ratio2.38x 3.7x 2.55x(2)
Combined Financial Profile
(1) Non-GAAP Financial Measure. See Use of Non-GAAP Financial Measures and Reconciliations in Appendix.
(2) Includes $85 million of run-rate synergies

14
WestRockBuilding a Paper and Packaging Leader
A Comprehensive
Paper and Packaging
Portfolio
A Solid Track
Record of Execution
Disciplined and
Balanced Capital
Allocation

15
Appendix

16
Non-GAAP Financial Measures
Credit Agreement EBITDA
“Credit Agreement EBITDA” is calculated in accordance with the definition contained in our Credit Agreement. Credit Agreement EBITDA is generally
defined as Consolidated Net Income plus: consolidated interest expense, income taxes of the consolidated companies determined in accordance
with GAAP, depreciation and amortization expense of the consolidated companies determined in accordance with GAAP, loss on extinguishment of
debt and financing fees, certain non-cash and cash charges incurred, including goodwill impairment, certain restructuring and other costs, merger /
acquisition and integration costs, charges and expenses associated with the write-up of inventory acquired and other items. LTM Credit Agreement
EBITDA margin is calculated by dividing LTM Credit Agreement EBITDA by Net Sales adjusted for Trade Sales.
Adjusted Free Cash Flow
Free Cash Flow is defined as Cash Provided by Operating Activities, excluding after-tax cash restructuring costs minus capital expenditures. We
believe the most directly comparable GAAP measure is net cash provided by operating activities. Management believes this is an important measure
in evaluating our financial performance and measures our ability to generate cash without incurring additional external financings.
Total Funded Debt and Leverage Ratio
“Total Funded Debt” is calculated in accordance with the definition contained in our Credit Agreement. Total Funded Debt is generally defined as
aggregate debt obligations reflected in our balance sheet less the stepped up value of said debt, less non-recourse debt except for Securitization
related debt, less trade payables related debt that may be recharacterized as debt, less insurance policy loans to the extent offset by assets of the
applicable insurance policies, obligations with the hedge adjustments resulting from terminated and existing fair value interest rate derivatives or
swaps, if any, less certain cash, plus additional outstanding letters of credit not already reflected in debt and certain guarantees.
Our management uses Credit Agreement EBITDA and Total Funded Debt to evaluate compliance with our debt covenants and borrowing capacity
available under our Credit Agreement, as a measure of operating performance and to compare to our target Leverage Ratio of 2.25x – 2.50x.
Management believes that investors also use these measures to evaluate our compliance with our debt covenants and available borrowing capacity.
Borrowing capacity is dependent upon, in addition to other measures, the “Credit Agreement Debt/EBITDA ratio” or the “Leverage Ratio,” which is
defined as Total Funded Debt divided by Credit Agreement EBITDA. As of the December 31, 2016 calculation, our Leverage Ratio was 2.38 times.
While the Leverage Ratio under the Credit Agreement determines the credit spread on our debt we are not subject to a Leverage Ratio cap. The
Credit Agreement is subject to a Debt to Capitalization and Consolidated Interest Coverage Ratio, as defined in the Credit Agreement.

17
Non-GAAP Financial Measures (cont.)
Adjusted Segment EBITDA Margins
Our management uses “Adjusted Segment EBITDA Margins”, along with other factors, to evaluate our segment performance against our peers.
Management believes that investors also use this measure to evaluate our performance relative to our peers. “Adjusted Segment EBITDA Margin” is
calculated for each segment by dividing that segment’s Adjusted Segment EBITDA by Adjusted Segment Sales. “Adjusted Segment EBITDA” is
calculated for each segment by adding that segment’s “Adjusted Segment Income” to its Depreciation, Depletion and Amortization.
Adjusted Earnings Per Diluted Share
We also use the non-GAAP measure “adjusted earnings per diluted share,” also referred to as “adjusted earnings per share” or “Adjusted EPS.”
Management believes this non-GAAP financial measure provides our board of directors, investors, potential investors, securities analysts and others
with useful information to evaluate our performance because it excludes restructuring and other costs, net, and other specific items that management
believes are not indicative of the ongoing operating results of the business. We and our board of directors use this information to evaluate our
performance relative to other periods.
Forward-looking Guidance
We are not providing forward-looking guidance for U.S. GAAP reported financial measures or a reconciliation of forward-looking non-GAAP financial
measures to the most directly comparable U.S. GAAP measure because it is unable to predict with reasonable certainty the ultimate outcome of
certain significant items without unreasonable effort. These items include, but are not limited to, merger and acquisition-related expenses,
restructuring expenses, asset impairments, litigation settlements, changes to contingent consideration and certain other gains or losses. These items
are uncertain, depend on various factors, and could have a material impact on U.S. GAAP reported results for the guidance period.

18
Q1 FY17 WestRock Consolidated Results
1) Non-GAAP Financial Measure. See Use of Non-GAAP Financial Measures and Reconciliations in Appendix.
Q1 FY17 Business Highlights:
• Adjusted earnings per share of $0.47 (1)
• Adjusted free cash flow of $369 million (1)
• Productivity initiatives contributed $85 million
• Leverage of 2.38x, within targeted range
• Repurchased 1.35 million shares of WestRock
• Significant cost inflation impact
Financial Performance
($ in millions, except percentages and per share items) Q1 FY17 Q1 FY16
Segment Sales $3,447 $3,471
Adj. Segment Income (1) $216 $270
Adj. Segment EBITDA (1) $490 $541
% Margin (1) 14.2% 15.6%
Adjusted Earnings from Continuing
Operations per Diluted Share (1) $0.47 $0.57
Adjusted Free Cash Flow (1) $369 $351
Adjusted Segment EBITDA (1) ($ in millions)$541
85
$490 (12)(19)
(50)
(32)
(13) (10)
Q1FY16
Volume Price / Mix E/M/F Wage &Other
Inflation
Productivity Hurricane Other Q1FY17

19
Q1 FY17 Corrugated Packaging Results
1) Non-GAAP Financial Measure. See Use of Non-GAAP Financial Measures and Reconciliations in Appendix.
2) We hold a 25% ownership interest in Grupo Gondi.
North America:
• Box shipments up +2.2% yoy on a per day basis
• Successfully implementing containerboard price increase;
realized $14 million in the quarter
• Strong supply and demand fundamentals; 115K tons of
maintenance downtime; no economic downtime
• Cost inflation impact
Grupo Gondi (Unconsolidated Joint Venture) (2):
• JV sales of $186 million; EBITDA margins of almost 20%(1)
• WestRock supplied 59K tons of containerboard to Gondi
Brazil:
• Growth in box volumes and strong execution yoy; box volumes
up 7% yoy as compared to industry decline of 4%
Segment EBITDA Key Bridge Variances:
• Volume: N.A. shipments up 18K tons yoy (excl. Hurricane
Matthew tons)
• Price / Mix: Price increase implementation on track, with box
price increase not yet offsetting last year’s pricing declines;
executing on export price increases
• E/M/F: Increases in recycled fiber, chemicals, and natural gas;
only partially offset by lower virgin fiber prices
• Productivity: Realizing benefits from mill footprint optimization,
process improvements and purchasing initiatives
• Hurricane: 33K tons of lost volume
Financial Performance
($ in millions, except percentages) Q1 FY17 Q1 FY16
Segment Sales $1,944 $1,964
Adj. Segment Income (1) $142 $181
Adj. Segment EBITDA (1) $287 $325
% Margin (1) 15.3% 17.1%
North America EBITDA Margin (1) 15.8% 17.7%
Brazil EBITDA Margin (1) 24.4% 24.8%
Adjusted Segment EBITDA (1) ($ in millions)
Foreign exchange translation impact to Q1 FY17 sales and segment income is +$15
million and +$2 million, respectively
$325 5
42
$287
(12)
(34)
(17)
(13)(9)
Q1FY16
Volume Price / Mix E/M/F Wageand
OtherInflation
Prod. Hurricane FX &Other
Q1FY17

20
Q1 FY17 Consumer Packaging Results
1) Non-GAAP Financial Measure. See Use of Non-GAAP Financial Measures and Reconciliations in Appendix.
Segment Highlights:
• Stable shipments of paperboard and converted products
• Softer demand in export tobacco, commercial print and food
packaging, offset by solid demand in foodservice and liquid
packaging
• Strong operational execution and realization of productivity
benefits; scheduled maintenance outages at three virgin mills
lowered pulp volume
• Flow through of previously announced paperboard price
decreases
• Paperboard inventory declined by 87k tons yoy
• Cost inflation impact
Segment EBITDA Key Bridge Variances:
• Volume: Lower pulp and Merchandising Display sales
partially offset by a modest increase in paperboard and
converted products shipments
• Price / Mix: PPW published price declines in SBS and CRB
impacted Q1 and are expected to carry throughout FY17;
stable converting price/mix
• E/M/F: Increases in recycled fiber, chemicals and energy,
partially offset by lower virgin fiber prices
• Productivity: Strong synergy and productivity improvements
from internalizing SBS volume, procurement savings and
operations productivity
− Integrating 250k tons per year from merger, Carolina
branded products and Cenveo integration
Financial Performance
($ in millions, except percentages) Q1 FY17 Q1 FY16
Segment Sales $1,511 $1,542
Adj. Segment Income (1) $88 $93
Adj. Segment EBITDA (1) $215 $219
% Margin (1) 14.2% 14.2%
Adjusted Segment EBITDA (1) ($ in millions)
Foreign exchange translation impact to Q1 FY17 sales and segment income is $(1)
million and $(1) million, respectively
$219 49 $215
(11)(8)
(16)
(14)
(4)
Q1FY16
Volume Price / Mix E/M/F Wageand
OtherInflation
Prod. Other Q1FY17

21
Adjusted Earnings Per Share Reconciliation
($ in millions, except per share data) Q1 FY17 Q1 FY16
Income from Continuing Operations 78.5$ 30.4$
Restructuring and Other Items, net of income tax expense of $23.9 and $57.5 63.8 117.5
One-time State Tax Benefit (23.8) -
Acquisition Inventory Step-up, net of income tax expense of $0 and $0.9 - 1.9
Noncontrolling Interest from Continuing Operations 2.4 (0.2)
Adjusted Income from Continuing Operations 120.9$ 149.6$
Earnings from Continuing Operations per Diluted Share 0.32$ 0.12$
Restructuring and Other Items 0.24 0.44
One-time State Tax Benefit (0.09) -
Acquisition Inventory Step-up - 0.01
Adjusted Earnings Per Diluted Share 0.47$ 0.57$

22
Q1 FY17 Adjusted Segment Sales, Adjusted
EBITDA and Adjusted EBITDA Margin
Q1 FY17
($ in millions, except percentages)
Corrugated
Packaging
Consumer
Packaging
Land and
Development
Non-Allocated /
Eliminations Consolidated
Segment Net Sales 1,943.6$ 1,510.9$ 54.0$ (61.3)$ 3,447.2$
Less: Trade Sales (74.0) - - - (74.0)
Adjusted Segment Sales 1,869.6$ 1,510.9$ 54.0$ (61.3)$ 3,373.2$
Segment Income and Non-allocated Expenses 141.5$ 87.6$ 1.7$ (14.7)$ 216.1$
Depreciation and Amortization 145.4 127.0 0.2 2.6 275.2
Less: Deferred Financing Costs - - - (1.1) (1.1)
Segment EBITDA 286.9 214.6 1.9 (13.2) 490.2
Plus: Inventory Step-up - - - - -
Adjusted Segment EBITDA and Non-allocated Expenses 286.9$ 214.6$ 1.9$ (13.2)$ 490.2$
Segment EBITDA Margins 14.8% 14.2%
Adjusted Segment EBITDA Margins 15.3% 14.2%

23
Q1 FY16 Adjusted Segment Sales, Adjusted
EBITDA and Adjusted EBITDA Margin
Q1 FY16
($ in millions, except percentages)
Corrugated
Packaging
Consumer
Packaging
Land and
Development
Non-Allocated /
Eliminations Consolidated
Segment Net Sales 1,964.3$ 1,542.2$ 15.4$ (51.0)$ 3,470.9$
Less: Trade Sales (65.1) - - - (65.1)
Adjusted Segment Sales 1,899.2$ 1,542.2$ 15.4$ (51.0)$ 3,405.8$
Segment Income and Non-allocated Expenses 180.1$ 91.2$ 0.7$ (4.5)$ 267.5$
Depreciation and Amortization 144.1 125.1 0.7 1.7 271.6
Less: Deferred Financing Costs - - - (1.2) (1.2)
Segment EBITDA 324.2 216.3 1.4 (4.0) 537.9
Plus: Inventory Step-up 0.6 2.2 - - 2.8
Adjusted Segment EBITDA and Non-allocated Expenses 324.8$ 218.5$ 1.4$ (4.0)$ 540.7$
Segment EBITDA Margins 16.5% 14.0%
Adjusted Segment EBITDA Margins 17.1% 14.2%

24
Corrugated Packaging EBITDA Margins
($ in millions, except percentages) North America Brazil OtherCorrugated
Packaging
Segment Net Sales 1,717.0$ 101.7$ 124.9$ 1,943.6$
Less: Trade Sales (74.0) - - (74.0)
Adjusted Segment Sales 1,643.0$ 101.7$ 124.9$ 1,869.6$
Segment Income (Loss) 131.7$ 9.9$ (0.1)$ 141.5$
Depreciation and Amortization 127.8 14.9 2.7 145.4
Segment EBITDA 259.5 24.8 2.6 286.9
Plus: Inventory Step-up - - - -
Adjusted Segment EBITDA 259.5$ 24.8$ 2.6$ 286.9$
Segment EBITDA Margins 15.1% 24.4% 14.8%
Adjusted Segment EBITDA Margins 15.8% 24.4% 15.3%
($ in millions, except percentages) North America Brazil OtherCorrugated
Packaging
Segment Net Sales 1,762.3$ 86.7$ 115.3$ 1,964.3$
Less: Trade Sales (65.1) - - (65.1)
Adjusted Segment Sales 1,697.2$ 86.7$ 115.3$ 1,899.2$
Segment Income 169.6$ 10.0$ 0.5$ 180.1$
Depreciation and Amortization 130.0 11.4 2.7 144.1
Segment EBITDA 299.6 21.4 3.2 324.2
Plus: Inventory Step-up 0.5 0.1 - 0.6
Adjusted Segment EBITDA 300.1$ 21.5$ 3.2$ 324.8$
Segment EBITDA Margins 17.0% 24.7% 16.5%
Adjusted Segment EBITDA Margins 17.7% 24.8% 17.1%
Q1 FY17
Q1 FY16

25
Q1 FY17 Packaging Shipments Results (1)
1) Combined RKT and MWV shipments for Q1 FY15 to Q3 FY15.
2) Recast to exclude box plants contributed to Grupo Gondi prior to Q3 FY16.
3) Combined North America, Brazil and India shipments.
Corrugated Packaging FY17
North America Corrugated Unit Q1 Q2 Q3 Q4 Q1 Q2 Q3 Q4 Q1
External Box, Containerboard & Kraft Paper Shipments Thousands of tons 1,908.2 1,877.1 1,953.0 1,934.0 1,940.6 1,969.2 2,019.8 2,063.5 1,951.8
Newsprint Shipments Thousands of tons - - - - 26.0 - - - -
Pulp Shipments Thousands of tons 87.6 59.6 79.6 84.0 80.1 71.1 94.3 89.7 80.1
Total North American Corrugated Packaging Shipments Thousands of tons 1,995.8 1,936.7 2,032.6 2,018.0 2,046.7 2,040.3 2,114.1 2,153.2 2,031.9
Corrugated Container Shipments (2)Billions of square feet 18.2 18.1 18.8 18.7 18.7 18.2 18.6 18.9 18.8
Corrugated Container Shipments per Shipping Day (2)Millions of square feet 297.7 292.6 298.7 292.6 306.3 288.6 291.4 294.5 312.9
Corrugated Packaging Maintenance Downtime Thousands of tons 68.5 79.6 104.1 3.1 119.9 68.1 60.5 32.2 115.4
Corrugated Packaging Economic Downtime Thousands of tons 53.1 24.5 29.5 83.9 144.0 30.1 71.7 - 0.1
Brazil and India
Corrugated Packaging Shipments Thousands of tons 166.5 168.2 175.1 171.4 180.2 173.5 166.8 164.8 151.0
Corrugated Container Shipments Billions of square feet 1.4 1.4 1.5 1.4 1.5 1.3 1.4 1.6 1.5
Corrugated Container Shipments per Shipping Day Millions of square feet 18.7 20.4 19.9 18.1 19.2 19.8 19.1 19.6 20.4
Total Corrugated Packaging Segment Shipments (3)Thousands of tons 2,162.3 2,104.9 2,207.7 2,189.4 2,226.9 2,213.8 2,280.9 2,318.0 2,182.9
Consumer Packaging
WestRock
Consumer Packaging Segment Shipments Thousands of tons 871.0 875.4 955.3 955.1 876.0 898.3 911.0 929.9 879.0
Pulp Shipments Thousands of tons 68.3 45.6 60.7 88.8 73.3 76.1 75.3 68.8 37.5
Consumer Packaging Converting Shipments Billions of square feet 8.6 8.6 9.2 9.2 8.8 9.0 9.5 9.4 9.0
FY15 FY16

26
Q1 FY17 LTM Credit Agreement EBITDA
1) Additional Permitted Charges includes among other items, $285 million of restructuring and other costs and $5 million pre-tax expense for inventory
stepped-up in purchase accounting.
($ in millions) LTM Q1 FY17
Income from Continuing Operations 202.9$
Interest Expense, Net 183.7
Income Taxes 68.5
Depreciation, Depletion and Amortization 1,092.9
Additional Permitted Charges (1)730.8
LTM Credit Agreement EBITDA 2,278.8$

27
Q1 FY17 Total Debt, Funded Debt and Leverage
Ratio
($ in millions, except ratios) Q1 FY17
Current Portion of Debt 283.4$
Long-Term Debt Due After One Year 5,483.8
Total Debt 5,767.2
Less: Unamortized Debt Stepped-up to Fair Value in Purchase and Deferred Financing Costs (296.0)
Plus: Letters of Credit, Guarantees and Other Adjustments (58.5)
Total Funded Debt 5,412.7$
LTM Credit Agreement EBITDA 2,278.8$
Leverage Ratio 2.38x

28
Adjusted Free Cash Flow
($ in millions) Q1 FY17 Q1 FY16
Net Cash Provided by Operating Activities 517.4$ 523.0$
Less: Capital Expenditures (176.1) (203.8)
Free Cash Flow 341.3 319.2
Plus: Cash Restructuring and other costs, net of income tax expense of $13.6 and $17.0 27.5 31.6
Adjusted Free Cash Flow 368.8$ 350.8$

29
LTM Q1 FY17 Adjusted EBITDA Reconciliation
($ in millions) Q2 FY16 Q3 FY16 Q4 FY16 Q1 FY17 LTM
Adjusted Segment EBITDA 530.5$ 609.9$ 588.8$ 490.2$ 2,219.4$

30
Q4 FY16 Adjusted Segment Sales, Adjusted
EBITDA and Adjusted EBITDA Margin
Q4 FY16
($ in millions, except percentages)
Corrugated
Packaging
Consumer
Packaging
Land and
Development
Non-Allocated /
Eliminations Consolidated
Segment Net Sales 2,003.7$ 1,621.7$ 43.7$ (57.4)$ 3,611.7$
Less: Trade Sales (71.8) - - - (71.8)
Adjusted Segment Sales 1,931.9$ 1,621.7$ 43.7$ (57.4)$ 3,539.9$
Segment Income (Loss) and Non-allocated Expenses 192.4$ 139.1$ (1.6)$ (20.1)$ 309.8$
Depreciation and Amortization 147.2 127.0 0.2 4.4 278.8
Less: Deferred Financing Costs - - - (1.3) (1.3)
Segment EBITDA 339.6 266.1 (1.4) (17.0) 587.3
Plus: Inventory Step-up - 1.5 - - 1.5
Adjusted Segment EBITDA and Non-allocated Expenses 339.6$ 267.6$ (1.4)$ (17.0)$ 588.8$
Segment EBITDA Margins 16.9% 16.4%
Adjusted Segment EBITDA Margins 17.6% 16.5%

31
Q3 FY16 Adjusted Segment Sales, Adjusted
EBITDA and Adjusted EBITDA Margin
Q3 FY16
($ in millions, except percentages)
Corrugated
Packaging
Consumer
Packaging
Land and
Development
Non-Allocated /
Eliminations Consolidated
Segment Net Sales 1,967.7$ 1,635.8$ 42.0$ (49.0)$ 3,596.5$
Less: Trade Sales (70.6) - - - (70.6)
Adjusted Segment Sales 1,897.1$ 1,635.8$ 42.0$ (49.0)$ 3,525.9$
Segment Income and Non-allocated Expenses 192.4$ 151.7$ 9.5$ (15.3)$ 338.3$
Depreciation and Amortization 144.1 124.2 0.3 2.0 270.6
Less: Deferred Financing Costs - - - (1.0) (1.0)
Segment EBITDA 336.5 275.9 9.8 (14.3) 607.9
Plus: Inventory Step-up 2.8 (0.8) - - 2.0
Adjusted Segment EBITDA and Non-allocated Expenses 339.3$ 275.1$ 9.8$ (14.3)$ 609.9$
Segment EBITDA Margins 17.1% 16.9%
Adjusted Segment EBITDA Margins 17.9% 16.8%

32
Q2 FY16 Adjusted Segment Sales, Adjusted
EBITDA and Adjusted EBITDA Margin
Q2 FY16
($ in millions, except percentages)
Corrugated
Packaging
Consumer
Packaging
Land and
Development
Non-Allocated /
Eliminations Consolidated
Segment Net Sales 1,932.8$ 1,588.4$ 18.7$ (47.2)$ 3,492.7$
Less: Trade Sales (67.4) - - - (67.4)
Adjusted Segment Sales 1,865.4$ 1,588.4$ 18.7$ (47.2)$ 3,425.3$
Segment Income (Loss) and Non-allocated Expenses 175.0$ 99.7$ (4.0)$ (9.2)$ 261.5$
Depreciation and Amortization 140.8 122.6 0.2 4.7 268.3
Less: Deferred Financing Costs - - - (1.1) (1.1)
Segment EBITDA 315.8 222.3 (3.8) (5.6) 528.7
Plus: Inventory Step-up - 1.8 - - 1.8
Adjusted Segment EBITDA and Non-allocated Expenses 315.8$ 224.1$ (3.8)$ (5.6)$ 530.5$
Segment EBITDA Margins 16.3% 14.0%
Adjusted Segment EBITDA Margins 16.9% 14.1%

33
Key Commodity Annual Consumption Volumes and
FX by Currency
Commodity Category Volume
Recycled Fiber (tons millions) 5
Wood (tons millions) 31
Natural Gas (cubic feet billions) 65
Diesel (gallons millions) 87
Electricity (kwh billions) 4.7
Polyethylene (lbs millions) 40
Caustic Soda (tons thousands) 194
Starch (lbs millions) 524
Expected Annual Consumption Volumes FX By Currency in Q1 FY17
Sensitivity Analysis
CategoryIncrease in Spot
Price
Annual EPS
Impact
Recycled Fiber (tons millions) +$10.00 / ton ($0.11)
Natural Gas (cubic feet billions) +$0.25 / MMBTU ($0.04)
FX Translation Impact+10% USD
Appreciation($0.05 - $0.06)
84% USD
7% CAD
3% EUR
3% BRL
3% Other
Revenue by
Transaction
Currency

34
Additional Information / Participants in Solicitation
Additional Information and Where to Find It
This communication may be deemed to be solicitation material in respect of the proposed acquisition of Multi Packaging Solutions International Limited
("MPS") by WestRock. In connection with the proposed MPS acquisition, MPS intends to file relevant materials with the SEC, including MPS' proxy
statement in preliminary and definitive form. Shareholders of MPS are urged to read all relevant documents filed with the SEC, including MPS' definitive
proxy statement, because they will contain important information about the proposed transaction. Investors and security holders are able to obtain the
documents (once available) free of charge at the SEC’s web site, http://www.sec.gov. Such documents are not currently availab le.
Participants in Solicitation
WestRock and its directors and executive officers, and MPS and its directors and executive officers, may be deemed to be participants in the solicitation
of proxies from the holders of MPS common shares in respect of the proposed transaction. Information about the directors and executive officers of
WestRock is set forth in the proxy statement for WestRock's 2017 Annual Meeting of stockholders, which was filed with the SEC on December 16, 2016.
Information about the directors and executive officers of MPS is set forth in the proxy statement for MPS's 2016 Annual General Meeting of Members,
which was filed with the SEC on October 6, 2016. Investors may obtain additional information regarding the interest of such participants by reading the
proxy statement regarding the acquisition (once available).