Embed Size (px)
Citation preview

Raymond James 36th Annual Institutional Investors Conference
March 2015

Forward-Looking Statements
This presentation contains certain statements that may be deemed to be forward-looking
statements within the meaning of the Securities Acts. All statements, other than statements of
historical facts, that address activities, events or developments that the Partnership expects,
projects, believes or anticipates will or may occur in the future, including, without limitation, the
outlook for population growth and death rates, general industry conditions including future
operating results of the Partnership’s properties, capital expenditures, asset sales, expansion and
growth opportunities, bank borrowings, financing activities and other such matters, are forward-
looking statements. Although the Partnership believes that its expectations stated in this
presentation are based on reasonable assumptions, actual results may differ from those projected in
the forward-looking statements. When considering forward-looking statements, the reader should
keep in mind the risk factors and other cautionary statements set forth in StoneMor’s Annual
Report on Form 10-K and Quarterly Reports filed with the Securities and Exchange Commission.
Except as required under applicable law, StoneMor assumes no obligation to update or revise
any forward-looking statements made herein or any other forward-looking statements made by
StoneMor, whether as a result of new information, future events, or otherwise.
2

StoneMor at a Glance
3
Second-largest owner and operator of cemeteries in the U.S.
303 cemeteries/98 funeral homes, located across 28 states and Puerto Rico
Complete range of funeral merchandise and services, along with cemetery property, merchandise and services, both at the time of need and on a pre-need basis
Over 12,490 acres of land, equivalent to a weighted average sales life of 240 years
45,470 annual burials / 12,535 funeral service calls
$841 million in Merchandise and Perpetual Care Trusts as of September 30, 2014
We are the only deathcare company structured as a master limited partnership (MLP)
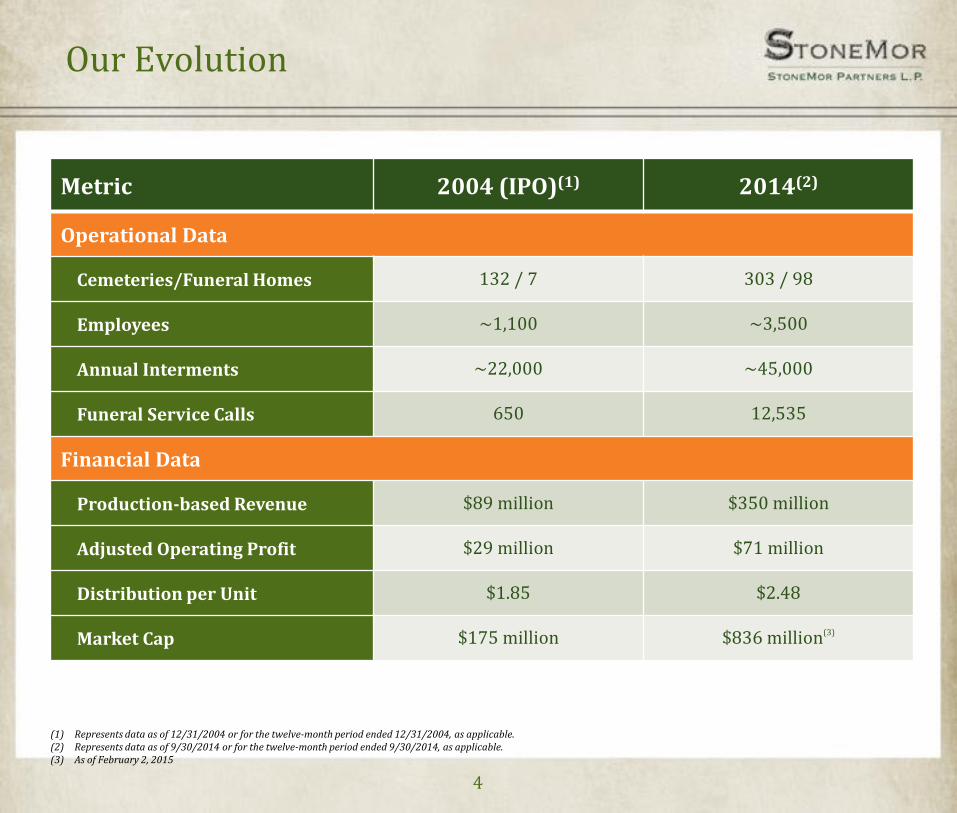
Our Evolution
4
Metric 2004 (IPO)(1) 2014(2)
Operational Data
Cemeteries/Funeral Homes 132 / 7 303 / 98
Employees ~1,100 ~3,500
Annual Interments ~22,000 ~45,000
Funeral Service Calls 650 12,535
Financial Data
Production-based Revenue $89 million $350 million
Adjusted Operating Profit $29 million $71 million
Distribution per Unit $1.85 $2.48
Market Cap $175 million $836 million(3)
(1) Represents data as of 12/31/2004 or for the twelve-month period ended 12/31/2004, as applicable. (2) Represents data as of 9/30/2014 or for the twelve-month period ended 9/30/2014, as applicable. (3) As of February 2, 2015

Our Footprint Today
Significantly enhanced geographic scale and diversity
5
303 Cemeteries
+98 Funeral Homes
= 401 Total Locations
WA
OR
CA CO
KS
IA
IL
MO
AR
IN
MI
OH
PA
WV
KY
TN
VA
NC
SC
GA AL MS
FL
Washington 3 Cemeteries 2 Funeral Homes
Oregon 6 Cemeteries 12 Funeral Homes
California 6 Cemeteries 9 Funeral Homes
Colorado 2 Cemeteries
Kansas 3 Cemeteries 2 Funeral Homes
Hawaii 1 Cemetery
Iowa 1 Cemetery
Illinois 8 Cemeteries 22Funeral Homes
Indiana 11 Cemeteries 5 Funeral Homes Michigan
13 Cemeteries
Kentucky 2 Cemeteries
Ohio 14 Cemeteries 2 Funeral Homes
Rhode Island 2 Cemeteries
Pennsylvania 52 Cemeteries 8 Funeral Homes
New Jersey 6 Cemeteries
Delaware 1 Cemetery
Maryland 10 Cemeteries 1 Funeral Home
West Virginia 33 Cemeteries 2 Funeral Homes
Virginia 31 Cemeteries 2 Funeral Homes
North Carolina 16 Cemeteries South Carolina
8 Cemeteries 3 Funeral Homes
Puerto Rico 7 Cemeteries 5 Funeral Homes
Georgia 7 Cemeteries
Florida 4 Cemeteries 17 Funeral Homes
Tennessee 11 Cemeteries 5 Funeral Homes
Alabama 9 Cemeteries 6 Funeral Homes
Mississippi 2 Cemeteries 1 Funeral Home
Arkansas 2 Funeral Homes
Missouri 6 Cemeteries 5 Funeral Homes
As of September 30, 2014

Diversified Revenue Streams
6
• More than 60% of revenues generated through highly predictable and at-need business.
• StoneMor’s 800+ person sales team creates an unparalleled advantage in pre-need sales.
Pre-need Sales, 37.0%
At-need Sales, 30.6%
Investment Income, 9.9%
Interest Income, 2.8%
Funeral Home Revenues,
18.2%
Other Cemetery
Revenues, 1.5%
Year ended December 31, 2013
BUSINESS MIX BY REVENUE STREAM

Mission-Driven Strategy
7
Mission
Vision
Strategy
To help families memorialize every life with dignity.
To be the preferred operator of deathcare facilities and preferred provider of deathcare services.
To use an opportunistic, yet conservatively financed acquisition strategy to build market share. Leverage these positions to expand service offerings.
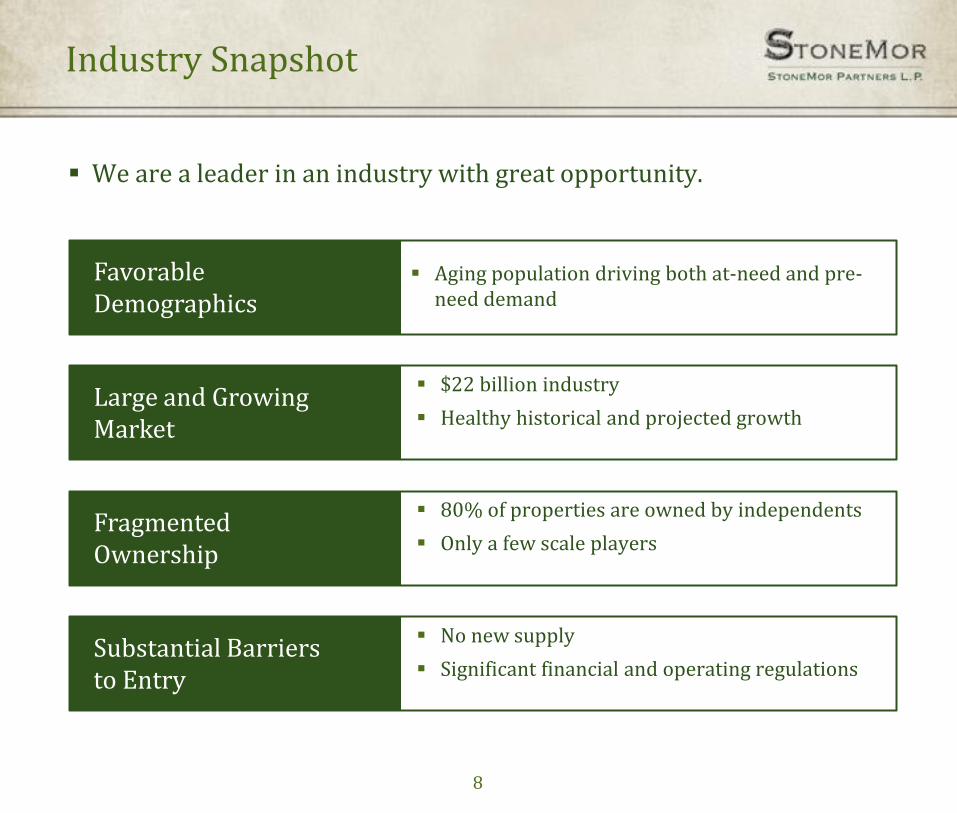
Industry Snapshot
8
We are a leader in an industry with great opportunity.
Aging population driving both at-need and pre-need demand
$22 billion industry
Healthy historical and projected growth
80% of properties are owned by independents
Only a few scale players
No new supply
Significant financial and operating regulations
Favorable Demographics
Large and Growing Market
Fragmented Ownership
Substantial Barriers to Entry

Demographic Tailwinds
9
Source: Department of Health and Human Services.
ANNUAL BIRTHS IN THE U.S. (1930-1960)
Aging of the Baby Boom Generation will:
1. Accelerate the death rate at-need sales
2. Expand our target pre-need market (55 to 65 age range)
− More financially stable and resilient to economic downturns
− Beginning to think of legacy
Source: U.S. Department of Commerce Census Bureau.
PROJECTED U.S. POPULATION OVER 55
87
98 106
112 118
130
2015 2020 2025 2030 2035 2040
(in millions)
1.5
2.0
2.5
3.0
3.5
4.0
4.5
(in millions)

Cemeteries, 10,500, 27%
Funeral Homes &
Crematories 22,000,
73%
$16 billion
$6 billion
Source: National Funeral Directors Association. Source: National Funeral Directors Association; U.S. Census Bureau.
$22 Billion Market
DEATHCARE MARKET SIZE
Large and Growing Industry
Industry growth driven by demographics and supported by ever-
present demand for memorialization and celebrations of life
10
CONTINUED GROWTH
2.1
2.4
2.6
3.3
1990 2000 2010 2030P
Deaths in the U.S. (millions)

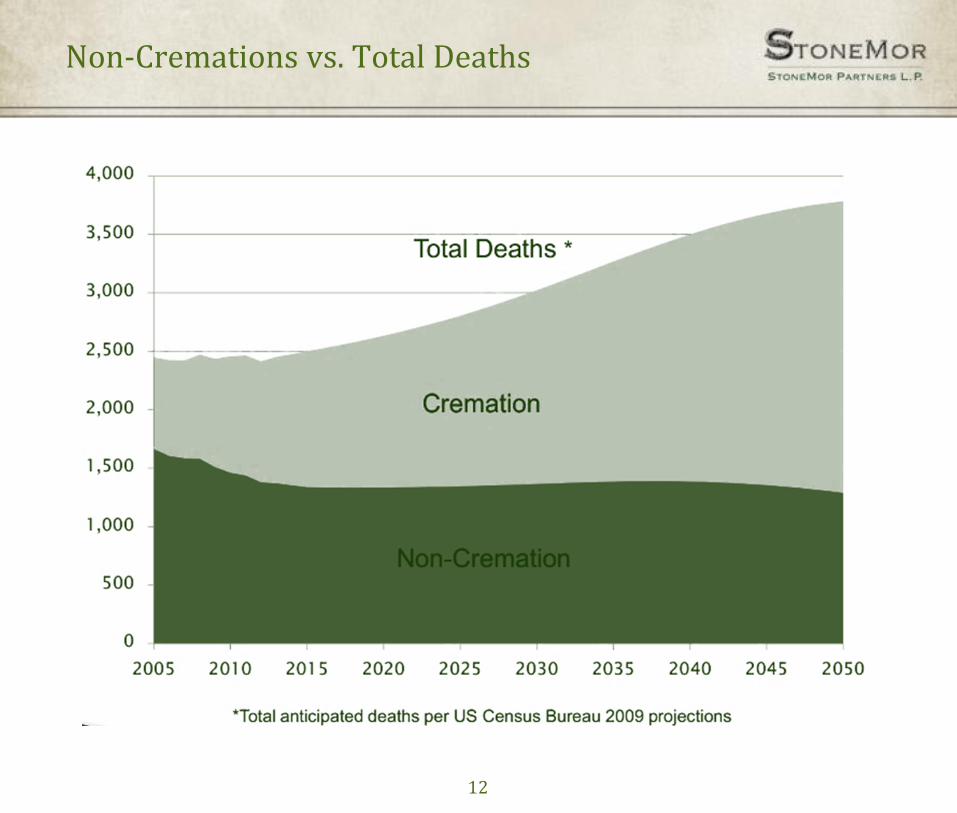
Cremation: Friend (not Foe)
Cremation projected to rise to >50% of total deaths in the U.S. by 2020.
– Well established trend presents a slight headwind for traditional cemetery burials.
However, also represents a key component of our growth strategy.
– Western society still memorializes life regardless of the method of disposition.
11
0%
10%
20%
30%
40%
50%
60%
70%
80%
1995 2000 2005 2010 2015 2020 2025
Cremation as a Percentage of Total Deaths
RISE IN CREMATION…
Stronger linkage between cremation and
memorialization options
− Cremation gardens
− Cremation-related products and services
Increased land utilization
Higher profit margins
Source: National Funeral Directors Association.
…CREATES OPPORTUNITY
12
Non-Cremations vs. Total Deaths

Our Acquisition Approach
13
Disciplined target selection: “never break the model”
Strategic locations to create and/or enhance market clusters
Cemetery
− 25+ year sales life
− 200+ annual interments
Seasoned, professional management
Consolidate office functions into home office
Institute pre-need sales program
Leverage buying power to reduce product costs
Professional trust fund management
Philosophy
Target Criteria
Integration
Funeral
− 150+ Annual Calls
− Strong legacy
Accretive from day one
IRR > cost of capital
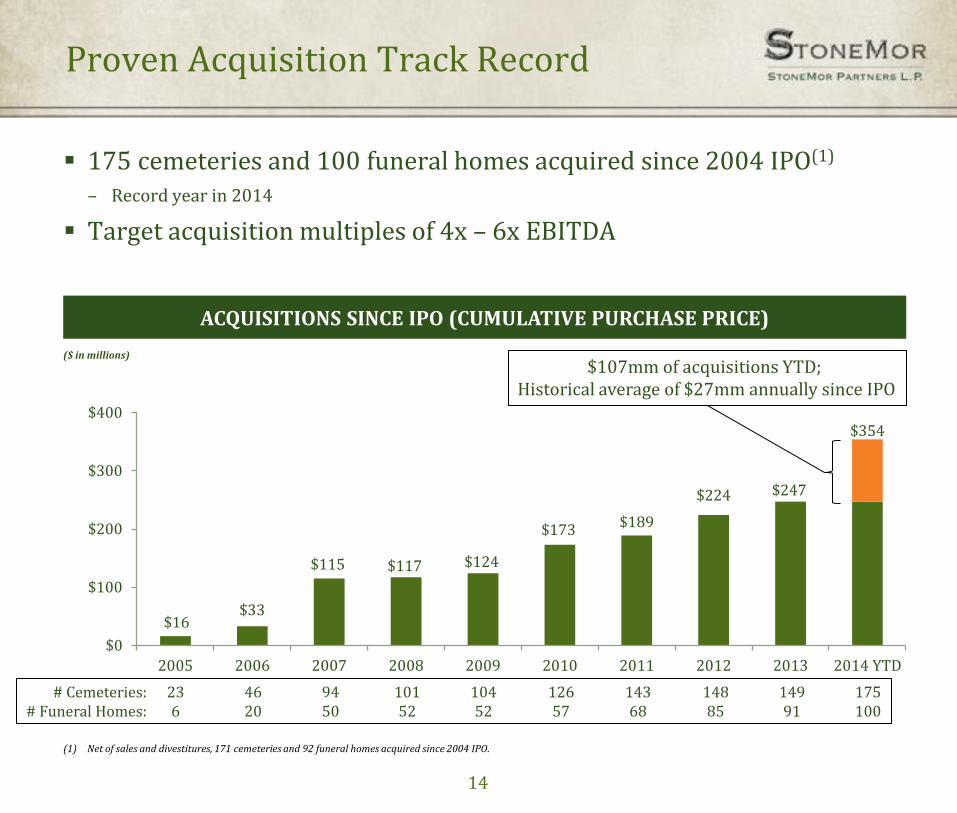
Proven Acquisition Track Record
14
175 cemeteries and 100 funeral homes acquired since 2004 IPO(1)
– Record year in 2014
Target acquisition multiples of 4x – 6x EBITDA
$16 $33
$115 $117 $124
$173 $189
$224 $247
$354
$0
$100
$200
$300
$400
2005 2006 2007 2008 2009 2010 2011 2012 2013 2014 YTD
ACQUISITIONS SINCE IPO (CUMULATIVE PURCHASE PRICE)
# Cemeteries: # Funeral Homes:
($ in millions)
23 6
46 20
94 50
101 52
104 52
126 57
143 68
148 85
149 91
175 100
(1) Net of sales and divestitures, 171 cemeteries and 92 funeral homes acquired since 2004 IPO.
$107mm of acquisitions YTD; Historical average of $27mm annually since IPO

Key Stats 13 cemeteries leased
60-year management agreement
7,000 existing burials per year
Rationale Strengthen market position in Philadelphia backyard
Introduce pre-need sales to large and growing population
Upside from optimizing productivity of land
Significant opportunities for other Archdioceses
2014 Acquisition Highlights: Archdiocese of Philadelphia
Closed in May 2014 with $53 million initial lease payment
15

Key Stats 12 cemeteries, 9 funeral homes
1,140 acres of land: FL, NC, PA, VA
3,500 annual interments
1,900 annual funeral home calls
Rationale Improve footprint in attractive markets
Upside from implementation of pre-need sales
Significant administrative synergies
$54 million acquisition closed in June 2014
2014 Acquisition Highlights: Service Corporation International
16

Keys to Our Success
17
Growth Through
Disciplined Acquisition
Underwriting
Prudent Balance Sheet Management
Deliver Reliable,
Consistent Value to
Unitholders
We have delivered steady, conservatively financed growth.
Transformational 2014 is an inflection point toward future growth.
Avg. $27mm annual acquisitions (’05-’13)
Target 4x – 6x EBITDA purchase prices
$1.90 $1.93 $2.03 $2.12 $2.22 $2.23 $2.33 $2.35 $2.39 $2.43
2005 2006 2007 2008 2009 2010 2011 2012 2013 TTM
Distributions/LP Unit
Proven Track Record Recent Developments
56%
43% 33% 32%
40% 36% 27%
12/08 12/09 12/10 12/11 12/12 12/13 9/14
Debt / Enterprise Value
2014 acquisitions ~4x average annual pace
AOP and SCI properties operating on plan
Well capitalized GP with AIM’s investment
Two equity raises ($120mm) to de-lever
Refinance senior notes to lower cost of debt
Distributions expected to grow by $0.01 per unit each quarter through the end of 2015

Trust Management
18
Merchandise Trust and
Perpetual Care Trust
Measured Performance*
$492 million (Merchandise Trust)
– All principal, interest and dividends accrue to StoneMor over time
$360 Million (Perpetual Care)
– Principal remains in trust in perpetuity
– Interest and dividends accrue to StoneMor
6% 7%
6% 8%
7%
9%
12/08 12/09 12/10 12/11 12/12 12/13
Merchandise Trust
Investment Management
Governed by investment guidelines adopted by Trust and Compliance Committee of BOD
Balanced approach to preservation of capital
Variety of intermediate-term, investment-grade, fixed income securities, high-yield securities, REITS, MLPs, other equities and cash
8% 8% 7%
6% 6% 5%
12/08 12/09 12/10 12/11 12/12 12/13
Perpetual Care Trust
*Past performance is not indicative of future performance

19
Strong Recent Results
PRODUCTION-BASED REVENUE
($ in millions)
ADJUSTED OPERATING PROFIT
($ in millions)
DISTRIBUTABLE FCF
($ in millions)
We deliver reliable, predictable yield with accelerating growth.
We focus on three financial metrics. – Production-based Revenue: total value of contracts written, investment and other income
– Adjusted Operating Profit: normalizes timing-related differences between GAAP and accrual
– Distributable Free Cash Flow: indicator of our ability to pay distributions to our unitholders
$296
$327
$240
$264
$0
$50
$100
$150
$200
$250
$300
$350
2012 2013 Q3'13YTD
Q3'14YTD
$54
$67
$47 $50
$0
$10
$20
$30
$40
$50
$60
$70
$80
2012 2013 Q3'13YTD
Q3'14YTD
$53
$76
$57
$50
$0
$10
$20
$30
$40
$50
$60
$70
$80
2012 2013 Q3'13YTD*
Q3'14YTD
*Includes $11.9 million one-time gain from legal settlement

($ in millions) ($ in millions)
REVENUE OPERATING PROFIT
Historical Performance
Steady growth as we have built the business through acquisitions and pre-need sales efforts
GAAP results not indicative of true financial performance
20
$13
$3
$10
$14
$6
$13
$36 $38
$49
$54
$67 $71
2009 2010 2011 2012 2013 Q3'14TTM
GAAP Old GAAP
$181 $197
$228 $243 $246
$277
$218
$247
$281 $296
$327
$350
2009 2010 2011 2012 2013 Q3'14TTM
GAAP Old GAAP

Low-Risk Balance Sheet
Marketable assets provide full debt protection
21
$656
$191
$41
$154
$270
$0
$100
$200
$300
$400
$500
$600
$700
Cash, AR andMerchandise Trust
AP and AccruedLiabilities
Merchandise Liability Debt Excess Cash and Assets
NET LIQUID ASSETS
($ in millions)
Significant additional value from long-term assets
− Cemetery Property
• Approximately 12,490 acres, weighted average sales life of over 240 years
• $341 million book value as of September 30, 2014
− Perpetual Care Trusts
• Fund future maintenance costs
• Assets of $349 million as of September 30, 2014

22
Substantial Distribution Coverage
History of sustained distributions and significant coverage
($ in millions)
ADJUSTED OPERATING PROFIT AND DISTRIBUTIONS
$36 $38
$49
$54
$67 $71
$27
$32
$45 $47
$51
$59
$13
$3
$10 $14
$6
$13
$0
$10
$20
$30
$40
$50
$60
$70
$80
2009 2010 2011 2012 2013 Q3'14 TTM
Adjusted Operating Profit Distributions GAAP Operating Profit

StoneMor Value Proposition Recap
23
Stable and Growing Cash Flow
Key Attributes of High-Performing MLPs StoneMor?
Long-lived, Secure Assets
Defensible Competitive Advantage
Attractive Industry Fundamentals
Conservative Financial Profile
StoneMor features the key attributes of high-performing MLPs, as well as an attractive total return profile.

STON TEN YEAR AVERAGE ANNUAL TOTAL RETURN vs. BENCHMARK ASSET CLASSES
Total Return Results
24
13.5% 12.8%
11.0% 10.5%
7.8% 7.6%
0%
2%
4%
6%
8%
10%
12%
14%
16%
StoneMor Alerian MLP Index NASDAQ 100 DJ Utility Index Russell 2000 S&P 500
Source: Bloomberg and Index monthly reports. Market data as of 2-26-15.
Total Return %

Thank You