Embed Size (px)
Citation preview
Suominen Corporation Q1 2015 Nina Kopola, President & CEO Tapio Engström, CFO 27 April 2015

Agenda
• Highlights Q1 • Financial review Q1 and outlook • Strategy and its implementation • Q & A
4/27/2014 Suominen is a globally leading supplier of nonwovens for wiping, hygiene and medical applications. 2

Highlights Q1 2015
14.8%
33.2%
4.5 M€ 14%
USD/EUR 30 - 50 M€
4/27/2014 Suominen is a globally leading supplier of nonwovens for wiping, hygiene and medical applications. 3

Net sales increased by 14%
Net sales, M€
Net sales, M€
4/27/2014 Suominen is a globally leading supplier of nonwovens for wiping, hygiene and medical applications. 4
97.2 93.1 93.5 89.8 98.4 95.3 103.3 104.8
111.9
0
20
40
60
80
100
120
55.7 98.3
356.9 373.7 401.8
050
100150200250300350400450
2010 2011 2012 2013 2014
- Net sales grew by 13.8%. The strengthening of the USD increased the net sales by 10.2%. - Demand in the European market improved from the comparison period. - In the comparison period, the net sales of the Paulínia plant are included only for two
months.
Continuing operations. Continuing operations.

39%
20%
11%
22%
8% 1%
41%
15%
12%
22%
8%
Baby Household Industrial Personal Care Hygiene and medical Other
Q1 2015: 111.9 M€
Convenience 92%, Care 8%
2%
Typically products with higher added value
The share of baby wipes increased due to the acquisition of the Paulinia unit in Brazil
Q1 2014: 98.4 M€
4/27/2014 Suominen is a globally leading supplier of nonwovens for wiping, hygiene and medical applications. 5

Operating profit improved 14%
Operating profit excl. NRI, M€ and %
Operating profit excl. NRI, M€ and %
4/27/2014 Suominen is a globally leading supplier of nonwovens for wiping, hygiene and medical applications. 6
- Strengthening of the USD improved operating profit - Operating profit was affected by costs (EUR -0.8 million) arising from the vested share-
based incentive plan 2012–2014. The costs of the incentive plan increased from the initial estimate due to the revisions in the number of shares transferred to key employees and the strongly improved share price.
4.9 % 5.0 % 5,0 %
4.6 %
6.5 % 5.8 %
8.4 %
5.9 % 6.5 %
0%
2%
4%
6%
8%
10%
0.0
2.0
4.0
6.0
8.0
10.0
M€ %
-6.5 % -4.4 %
4.2 %
5.2 %
6.7 %
-8%-6%-4%-2%0%2%4%6%8%
-10-505
1015202530
2010 2011 2012 2013 2014
M€ %Continuing operations. Continuing operations.

Financial review Q1

Profit for the reporting period increased from the comparison period
Profit for the reporting period, M€
4/27/2014 Suominen is a globally leading supplier of nonwovens for wiping, hygiene and medical applications. 8
1.4 1.0
2.6
0.6
2.6 2.2
0.6
4.8
3.5
0
1
2
3
4
5
6
-12.0 -11,8
-2.8
5.7
10.2
-15
-10
-5
0
5
10
15
2010 2011 2012 2013 2014
Profit for the reporting period, M€
Continuing operations. Continuing operations.

Statement of profit or loss
Healthy cost structure Costs of the share-based incentive plan burdened operating profit
Financial expenses grew due to the fluctuations in exchange rates
Net sales grew, strong impact of USD
Effective tax rate 38.6%
EUR thousands 1-3/2015 1-3/2014 1-12/2014 Net sales 111,934 98,353 401,762 Cost of goods sold -97,547 -87,039 -352,091 Gross profit 14,387 11,314 49,671 Other operating income 950 768 2,655 Sales and marketing expenses -1,902 -1,444 -6,278 Research and development -851 -614 -2,877 Administration expenses -4,681 -3,459 -14,144 Other operating expenses -611 -181 -2,177 Operating profit excluding non-recurring items 7,292 6,384 26,851 Non-recurring items − -233 -954 Operating profit / loss 7,292 6,151 25,897 Net financial expenses -1,621 -1,467 -8,075 Profit/loss before income taxes 5,670 4,684 17,822 Income taxes -2,188 -2,099 -7,645
Profit/loss for the period from continuing operations 3,482 2,585 10,177
4/27/2014 Suominen is a globally leading supplier of nonwovens for wiping, hygiene and medical applications. 9
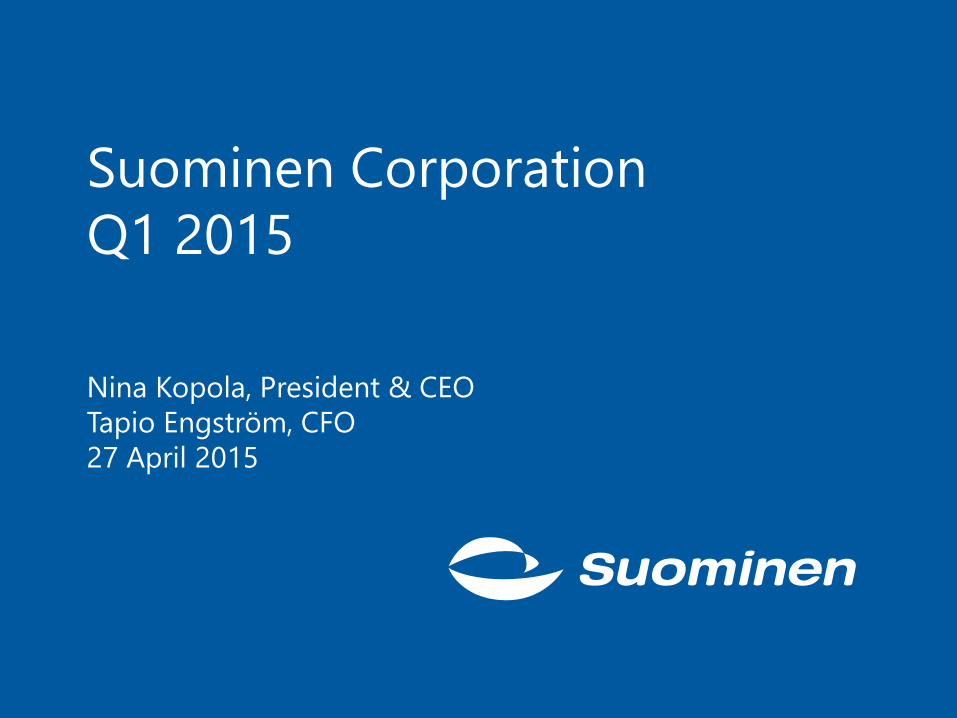
Statement of financial position, assets
4/27/2014 Suominen is a globally leading supplier of nonwovens for wiping, hygiene and medical applications. 10
EUR thousands 31 Mar 2015 31 Mar 2014 31 Dec 2014
Non-current assets Goodwill 15,496 15,496 15,496 Intangible assets 12,598 12,826 12,510 Property, plant and equipment 92,197 106,426 88,721 Loan receivables 8,202 − 8,202 Available-for-sale assets 1,113 938 1,124 Held-to-maturity investments 433 467 450 Other non-current receivables 2,518 511 2,614 Deferred tax assets 5,276 7,313 5,516 Total non-current assets 137,833 143,976 134,633
Current assets Inventories 30,914 36,174 32,380 Trade receivables 60,599 61,894 52,269 Loan receivables 600 59 600 Other current receivables 4,108 7,396 4,618 Assets for current tax 1,381 326 1,682 Cash and cash equivalents 38,036 15,227 38,430 Total current assets 135,639 121,076 129,979
Total assets 273,472 265,052 264,611
Strengthening of the USD impacted working capital

Statement of financial position, equity and liabilities
EUR thousands 31 Mar 2015 31 Mar 2014 31 Dec 2014 Equity Share capital 11,860 11,860 11,860 Share premium account 24,681 24,681 24,681 Reserve for invested unrestricted equity 69,572 97,123 97,192 Treasury shares -44 -44 -44 Fair value and other reserves 14 -1,045 96 Exchange differences 8,216 -2,168 3,419 Other equity -15,901 -48,299 -46,890 Total equity attributable to owners of the parent 98,398 82,108 90,313
Hybrid bond 16,653 17,640 18,424 Total equity 115,051 99,748 108,737
Liabilities Non-current liabilities Deferred tax liabilities 9,832 7,179 8,789 Provisions − 126 − Other non-current liabilities 2,454 1,857 1,729 Debentures 75,000 − 75,000 Other non-current interest-bearing liabilities 6,667 70,388 6,667 Total non-current liabilities 93,953 79,550 92,185 Current liabilities Current interest-bearing liabilities 3,333 24,060 3,347 Liabilities for current tax 941 522 246 Trade payables and other current liabilities 60,194 61,172 60,096 Total current liabilities 64,468 85,754 63,689 Total liabilities 158,421 165,304 155,874 Total equity and liabilities 273,472 265,052 264,611
4/27/2014 Suominen is a globally leading supplier of nonwovens for wiping, hygiene and medical applications. 11
Decrease in the nominal value of the hybrid bond due to the conversions made

Strong cash flow from operations
Cash flow from operations, M€ Cash flow from operations, M€
4/27/2014 Suominen is a globally leading supplier of nonwovens for wiping, hygiene and medical applications. 12
-2.1
2.9 4.3
16.3
-0.4
11.3
16.9
9.3
4.5
-5
0
5
10
15
20
-2.5 -2.9
24.9 21.3
37.1
-505
10152025303540
2010 2011 2012 2013 2014
• In previous years, Suominen’s cash flow from operations has remained negative in the first quarter.

Statement of cash flows
EUR thousands 1-3/2015 1-3/2014 1-12/2014
Cash flow from operations Profit / loss for the period 3,482 2,892 4,973 Total adjustments to profit / loss for the period 8,319 8,254 39,953
Cash flow before changes in net working capital 11,802 11,146 44,927
Change in net working capital -107 -8,856 6,140 Financial items -5,317 -1,534 -6,514 Income taxes -1,886 -1,176 -7,434 Cash flow from operations 4,493 -419 37,119
Cash flow from investments Investments in property, plant and equipment and intangible assets -1,664 -1,122 -7,740
Investments in acquired businesses − -19,334 -19,261 Cash flow from disposed businesses − − 4,736 Sales proceeds from property, plant and equipment and intangible assets 10 31 59
Cash flow from investments -1,654 -20,424 -22,206
The financial items were impacted by currency forward contracts hedging equity and the interests of the debenture bond paid
Less capital tied up
4/27/2014 Suominen is a globally leading supplier of nonwovens for wiping, hygiene and medical applications. 13

Statement of cash flows, continued
Rahavirtalaskelma sisältää myös lopetetut liiketoiminnot.
EUR thousands 1-3/2015 1-3/2014 1-12/2014
Cash flow from financing Drawdown of hybrid bond − 17,500 17,500 Drawdown of debenture bond − − 75,000 Drawdown of other non-current interest-bearing liabilities − − 10,000
Repayment of other non-current interest-bearing liabilities − -14 -78,220
Changes in current interest-bearing liabilities -14 -6 -18,324
Share issue 340 − − Distribution of funds -2,504 − − Cash flow from financing -2,177 17,481 5,956
Change in cash and cash equivalents 662 -3,364 20,869
Cash and cash equivalents at the beginning of the period 38,430 18,585 18,585
Effect of changes in exchange rates -1,056 6 -1,025 Change in cash and cash equivalents 662 -3,364 20,869 Cash and cash equivalents at the end of the period 38,036 15,227 38,430
Cash flow in 2014 includes also discontinued operations.
Distribution of funds to the shareholders
4/27/2014 Suominen is a globally leading supplier of nonwovens for wiping, hygiene and medical applications. 14

Outlook for 2015
• Suominen repeats its previous estimate, disclosed on 30 January 2015, that for the full year 2015 the company expects its net sales and operating profit excluding non-recurring items to improve from year 2014.
• In 2014, Suominen’s net sales amounted to EUR 401.8 million and operating profit excluding non-recurring items to EUR 26.9 million.
4/27/2014 Suominen is a globally leading supplier of nonwovens for wiping, hygiene and medical applications. 15

Strategy for 2015–2017

We target growth, market-driven way of operating and product leadership
Organic growth exceeding industry average
Market-driven way of
operating
Product leadership
17 Suominen is a globally leading supplier of nonwovens for wiping, hygiene and medical applications. 4/27/2014

Understanding the end user remains in the heart of our strategy
Fiber producer
Nonwovens manufacturer
Brand owner
Converter
Retailer
Primary production
18 Suominen is a globally leading supplier of nonwovens for wiping, hygiene and medical applications. 4/27/2014

Purpose – why? Our purpose is to make nonwovens continuously better
for people.
Suominen core
Strategy – how? • Deliver superior value in thoughtfully selected market
applications. • Drive proactive key account management for mutual value
creation. • Execute demand driven supply chain. • Evolve culture and capabilities to build strong product
company.
Vision – where? Market Driven Product Leader
19 Suominen is a globally leading supplier of nonwovens for wiping, hygiene and medical applications. 4/27/2014

We have a focused plan to implement growth strategy
Extend geographical
reach Acquisitions
Not in focus in the strategy period 2015 - 2017
Sustain & improve Retrofit Expand
Projected growth investments 30–50 ME until 2017
20 Suominen is a globally leading supplier of nonwovens for wiping, hygiene and medical applications. 4/27/2014

Growth investment program was launched swiftly and is proceeding as planned
Paulínia, Brazil
Bethune, SC, USA
Nakkila, Finland
Alicante, Spain
21 Suominen is a globally leading supplier of nonwovens for wiping, hygiene and medical applications. 4/27/2014

Three new products with higher added value were launched during Q1
• Fibrella™ Perf - Absorbent and soft nonwoven for wound care as well as surgical
applications. - Investment in the Paulínia plant in Brazil enables the launch for the South
American markets. • Hydraspun® Dispersible Plus
- Dispersible, next-generation nonwoven for flushable wiping products. - Suominen has filed a patent for the range of products.
• Fibrella™ Lite - Extremely lightweight and soft, but also strong and stretchable
nonwoven targeted to the global hygiene market. - Perfect for the next-to-skin components of hygiene products.
4/27/2014 Suominen is a globally leading supplier of nonwovens for wiping, hygiene and medical applications. 22

Mid-term financial targets
• Increase net sales organically at a rate that exceeds the average
growth rate of the industry. (In 2014, Suominen’s net sales grew organically 3.5%, slightly faster than the industry average.)
• Have a solid capital structure with a gearing ratio principally between 40% and 80%. (Q1/2015: 33.2%).
• Clearly improve relative profitability. The target level of the company’s return on investment (ROI) is above 12%. (Q1/2015, rolling 12 months: 14.8%).
4/27/2015 Suominen is a globally leading supplier of nonwovens for wiping, hygiene and medical applications. 23

Summary
4/27/2014 Suominen is a globally leading supplier of nonwovens for wiping, hygiene and medical applications. 24
14.8%
33.2%
4.5 M€ 14%
USD/EUR 30 - 50 M€

Thank you! We’re now ready to answer your questions.
4/27/2014 Suominen is a globally leading supplier of nonwovens for wiping, hygiene and medical applications. 25

![Presentation of results for Q1 2015 · 4 Selected financial data of the Capital Group Presentation of results for Q1 2015 [in PLN million] Q1 2015 Q1 2014 growth Trade receivables](https://img.dokumen.tips/doc/110x75/5f9b4e4a0642d80f9537649f/presentation-of-results-for-q1-2015-4-selected-financial-data-of-the-capital-group.jpg)