Embed Size (px)
Citation preview

Bringing the Sharing Economy to the Social Change Industry
THE RESILIENCE
EXCHANGE
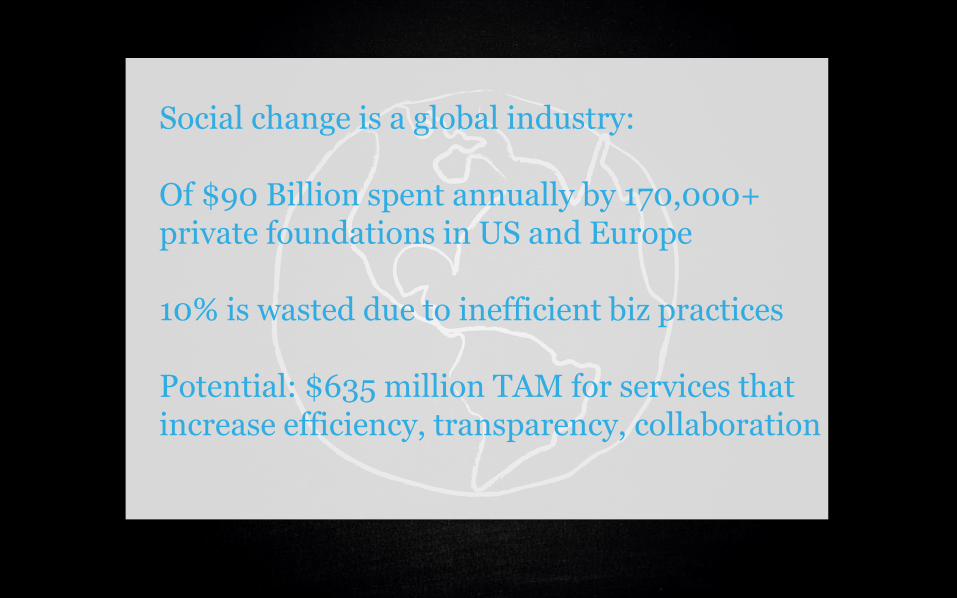
Social change is a global industry: Of $90 Billion spent annually by 170,000+ private foundations in US and Europe 10% is wasted due to inefficient biz practices Potential: $635 million TAM for services that increase efficiency, transparency, collaboration
Key pain points
in the system

Funders don’t hear directly
from beneficiaries about
needs for or outcomes of
programs
Funders don’t learn
what’s already working
Funders Give Money
NGOs Deliver Solutions
Beneficiaries Receive
Outcomes
Practitioners reinvent the wheel
What if there was an Amazon.com for Social Change where Funders can do comparison shopping for what’s already working?

What if there was a GitHub for Social Change where Practitioners can discover, share and repurpose solutions?

What if there was a Yelp for Social Change where Beneficiaries can rank and review solutions that their communities?

The Resilience Exchange is a platform
that generates unprecedented efficiencies in
the social change sector by unlocking the
value behind a significantly underutilized set
of assets – existing, proven Solutions.

We are bringing the sharing economy to the
social change industry.
It’s about mobilizing and making use of
what already works, at a global scale.
THE RESILIENCE EXCHANGE…
• Provides a central infrastructure and repository
• Matches participants with each other and content
• Provides incentives to participate & come back
• Suggests Solutions based on content and intent
• Allows funders to curate branded portals
• Counts what matters to the industry


CUSTOMER CASE:
FOUNDATION
A major foundation is building a new field through investments in multiple organizations. They want to track how those organizations are impacting the field, sharing information and collaborating. They would like to play a more effective role as a grant maker.
OUR SERVICE: They are setting up a Solution Portal to put grantees in touch with each other, and make new grants to collaborators.


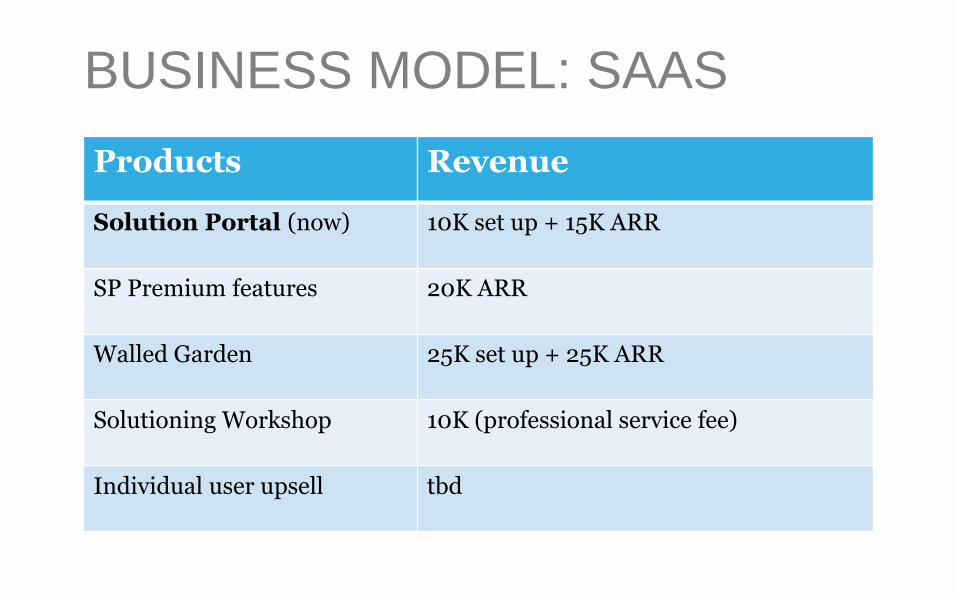
BUSINESS MODEL: SAAS
Products Revenue
Solution Portal (now) 10K set up + 15K ARR
SP Premium features 20K ARR
Walled Garden 25K set up + 25K ARR
Solutioning Workshop 10K (professional service fee)
Individual user upsell tbd
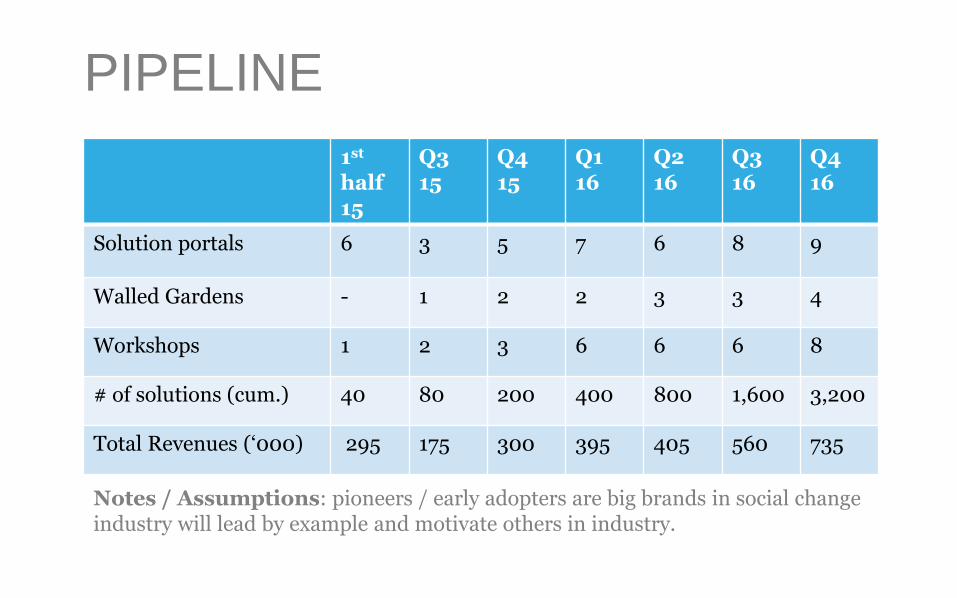
PIPELINE
1st half 15
Q3 15
Q4 15
Q1 16
Q2 16
Q3 16
Q4 16
Solution portals 6 3 5 7 6 8 9
Walled Gardens - 1 2 2 3 3 4
Workshops 1 2 3 6 6 6 8
# of solutions (cum.) 40 80 200 400 800 1,600 3,200
Total Revenues (‘000) 295 175 300 395 405 560 735
Notes / Assumptions: pioneers / early adopters are big brands in social change industry will lead by example and motivate others in industry.
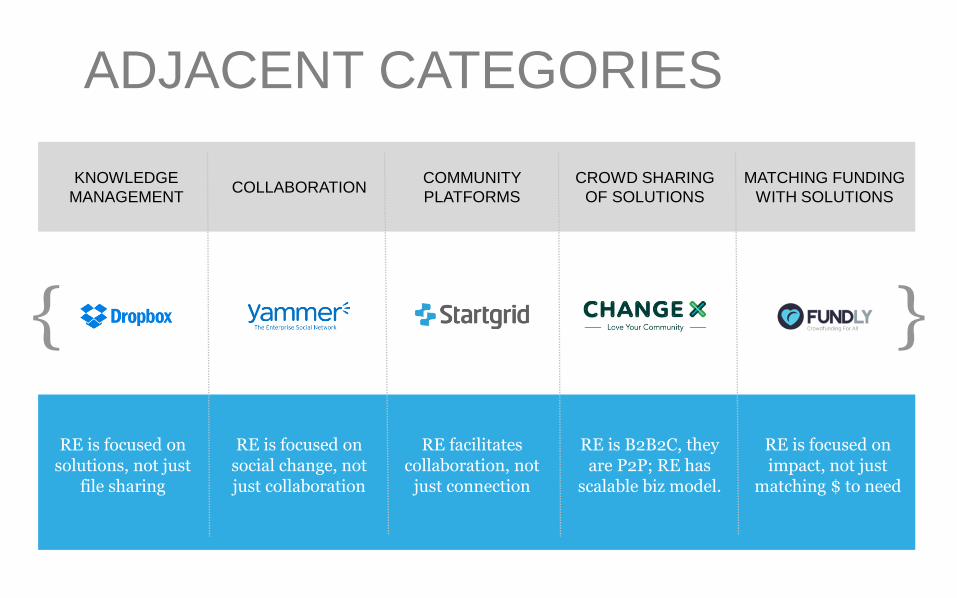
ADJACENT CATEGORIES
KNOWLEDGE
MANAGEMENT COLLABORATION
COMMUNITY
PLATFORMS
CROWD SHARING
OF SOLUTIONS
MATCHING FUNDING
WITH SOLUTIONS
{ }
RE is B2B2C, they are P2P; RE has
scalable biz model.
RE is focused on impact, not just
matching $ to need
RE is focused on solutions, not just
file sharing
RE is focused on social change, not just collaboration
RE facilitates collaboration, not
just connection

Management: Industry Veterans

• Led Ecotrust, a $10M hybrid org with $100M+ AUM
• 15 years in non-profit industry
• Comprehensive skills in management, strategic & program planning and implementation, organizational development, fundraising
• Cal Berkeley Ph.D. in Energy and Resources
ASTRID SCHOLZ CEO

JON KRUSE COO
• 20+ year technology industry
• Director, Intel Capital, $60M+ of SaaS/cloud investments 20% IRR, 2x+ Cash on Cash return
• Functional roles in operational finance, strategic planning, marketing (product line and field), business development
• 20+ for profit (venture backed start ups) and non-profit boards
TROY OLDROYD Tech Lead
• 15+ year technology industry
• VP of Technology, Alliance Health Networks, network of social health communities “Connect”, $100M+ revenue
• Roles in strategy, planning, development and managing innovative software technologies for both web and mobile applications.

FINANCIAL SUMMARY
2015 (Q3+Q4)
2016 2017 2018 2019
Recurring Revenue (‘000) 475 2,095 4,315 7,560 12,235
Prof. Serv’s Rev’s (‘000) 50 260 320 400 400
Head count (at end of period) 17 24 35 43 48
Metrics: Number of customers; conversion rate; number of solutions; users; recombinations of solutions; among others.
Assumptions: sales cycles are long initially, get shorter with adoption by marquee org’s; curation shifts from concierge to customer-led to cognitive computing assisted by 2017; prof. services shift to train-the-trainers model by 2017.
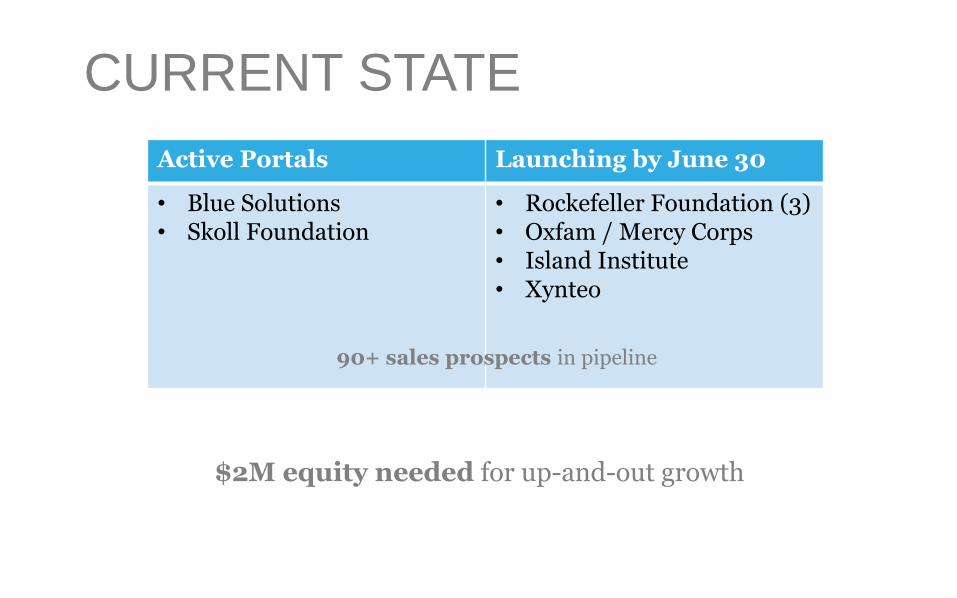
CURRENT STATE
$2M equity needed for up-and-out growth
Active Portals Launching by June 30
• Blue Solutions • Skoll Foundation
• Rockefeller Foundation (3) • Oxfam / Mercy Corps • Island Institute • Xynteo
90+ sales prospects in pipeline
THANK YOU!
Learn more at: resilience-exchange.org