Embed Size (px)
Citation preview
1
August 31, 2016
Second Quarter FY17Financial Results

2
• This presentation contains forward‐looking statements that involve risks and uncertainties, including statements regarding Box’s expectations regarding the size of its market opportunity, the demand for its products, its ability to scale its business, its ability to achieve positive free cash flow, profitability, planned product enhancements, and the success of strategic partnerships, as well as expectations regarding revenue, GAAP and non‐GAAP earnings per share, the related components of GAAP and non‐GAAP earnings per share, and weighted average basic and diluted outstanding share count expectations for Box’s fiscal third quarter and full fiscal year 2017.
• There are a significant number of factors that could cause actual results to differ materially from statements made in this presentation, including: (1) adverse changes in general economic or market conditions; (2) delays or reductions in information technology spending; (3) factors related to Box’s intensely competitive market, including but not limited to pricing pressures, industry consolidation, entry of new competitors and new applications and marketing initiatives by Box’s current or future competitors; (4) the development of the cloud‐based Enterprise Content Management market; (5) risks associated with Box’s ability to manage its rapid growth effectively; (6) Box’s limited operating history, which makes it difficult to predict future results; (7) the risk that Box’s customers do not renew their subscriptions or expand their use of Box’s services; (8) Box’s ability to provide successful enhancements, new features and modifications to its platform and services; (9) actual or perceived security vulnerabilities in Box’s services or any breaches of Box’s security controls; and (10) Box’s ability to realize the expected benefits of its third‐party partnerships. Further information on these and other factors that could affect the forward‐looking statements we make in this presentation can be found in the documents that we file with or furnish to the US Securities and Exchange Commission, including our most recent Quarterly Report on Form 10‐Q filed for the fiscal quarter ended April 30, 2016.
• You should not rely on any forward‐looking statements, and we assume no obligation, nor do we intend, to update them. All information in this presentation is as of August 31, 2016.
• This presentation contains non‐GAAP financial measures and key metrics relating to the company's past and expected future performance. You can find the reconciliation of these measures to the nearest comparable GAAP measures in the appendix at the end of this presentation. You can also find information regarding our use of non‐GAAP financial measures in our earnings release dated August 31, 2016.
Investor Disclosure: Financial Forward‐Looking Statements and Non‐GAAP Measures

3
• Sustained strong revenue growth
• ~95% recurring revenue, SaaS product
• 66,000 customers, 60% of Fortune 500
• Significant new products (Governance, KeySafe, Zones & Platform)
• Focus on positive FCF & Op Margin improvement
• Key alliances with IBM, Microsoft, Apple
• 1,300+ Employees, HQ in Redwood City, CA
$59
$124
$216
$303
FY 2013 FY 2014 FY 2015 FY 2016
The Leading Enterprise Content Management Platform
Revenue Growth ($M)

4
Employees are working in new ways
Every business process is collaborative
Digital is transforming every industry
New security threats emerging every day
Business Today is Changing
5
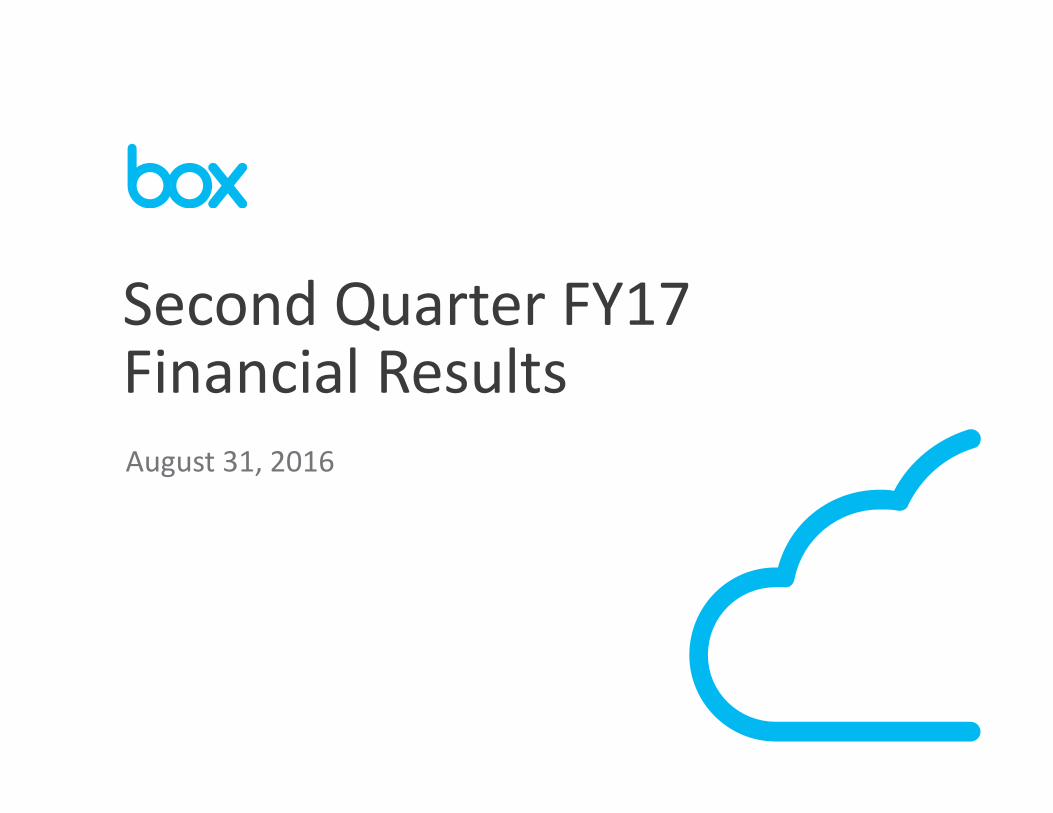
Box is a Content Platform for the Modern Enterprise
Built for cloud and mobile
Connects to all your business apps
Centralized security controls
Comes with unlimited storage for users
6
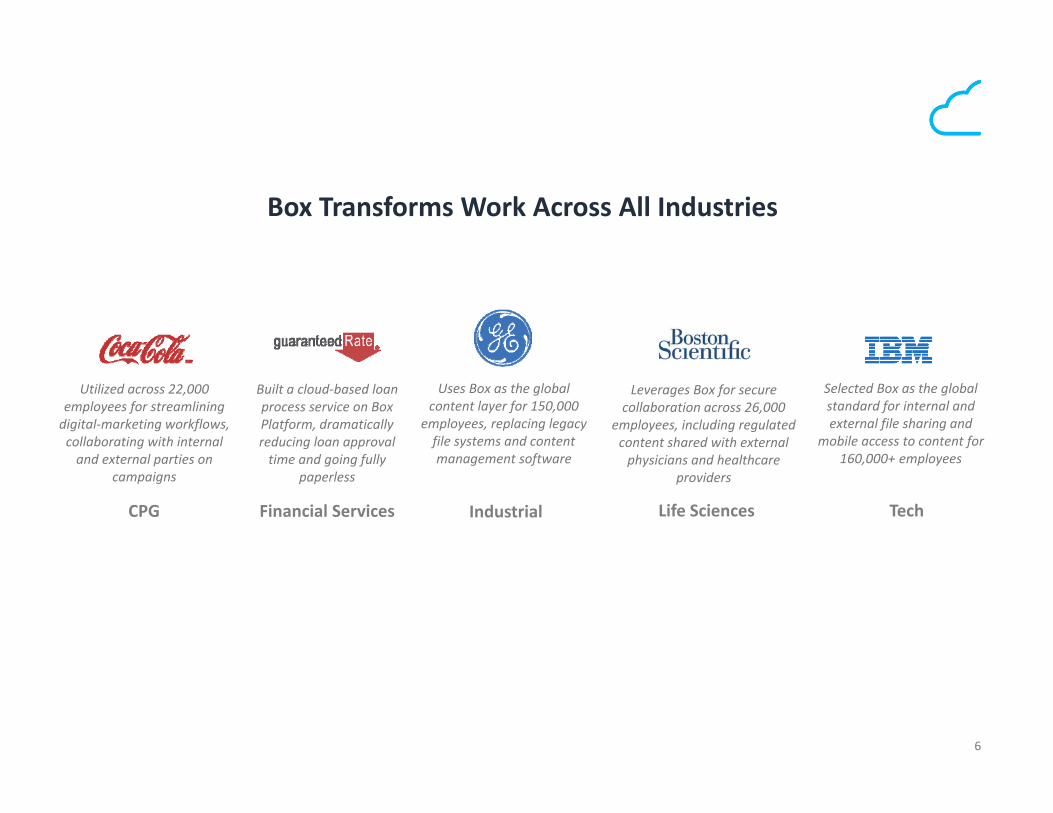
Box Transforms Work Across All Industries
Built a cloud‐based loan process service on Box Platform, dramatically reducing loan approval time and going fully
paperless
Uses Box as the global content layer for 150,000
employees, replacing legacy file systems and content management software
Selected Box as the global standard for internal and external file sharing and
mobile access to content for 160,000+ employees
Leverages Box for secure collaboration across 26,000
employees, including regulated content shared with external physicians and healthcare
providers
Utilized across 22,000 employees for streamlining digital‐marketing workflows, collaborating with internal and external parties on
campaigns
TechLife SciencesIndustrialFinancial ServicesCPG
7
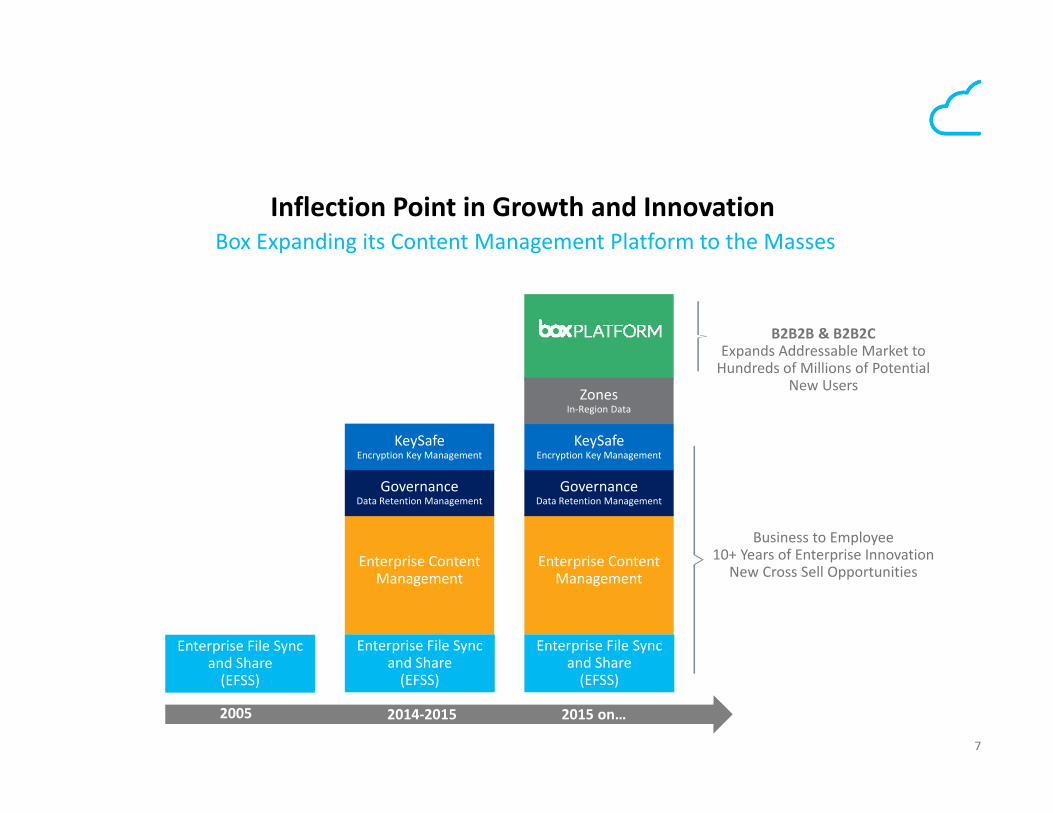
Box Expanding its Content Management Platform to the MassesInflection Point in Growth and Innovation
Enterprise File Sync and Share(EFSS)
Enterprise Content Management
GovernanceData Retention Management
KeySafeEncryption Key Management
2014‐20152005
Business to Employee10+ Years of Enterprise Innovation
New Cross Sell Opportunities
B2B2B & B2B2CExpands Addressable Market to Hundreds of Millions of Potential
New Users
2015 on…
Enterprise File Sync and Share(EFSS)
Enterprise Content Management
GovernanceData Retention Management
KeySafeEncryption Key Management
Enterprise File Sync and Share(EFSS)
ZonesIn‐Region Data
8
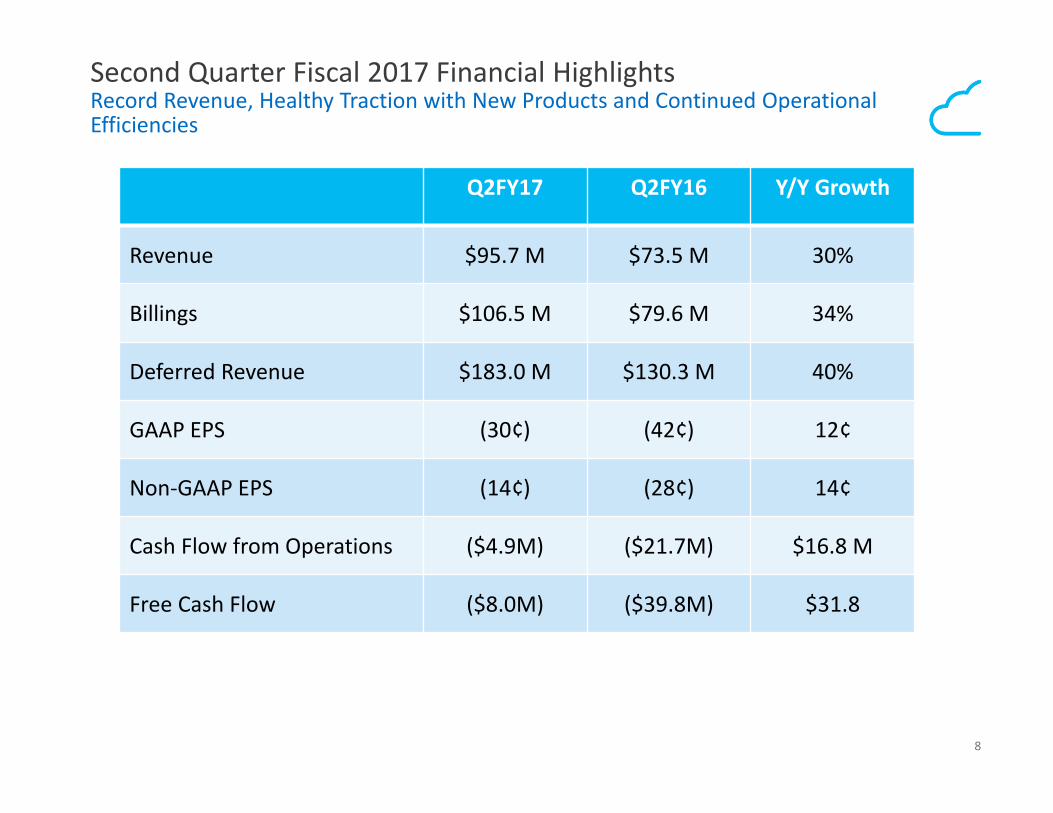
Second Quarter Fiscal 2017 Financial HighlightsRecord Revenue, Healthy Traction with New Products and Continued Operational Efficiencies
Q2FY17 Q2FY16 Y/Y Growth
Revenue $95.7 M $73.5 M 30%
Billings $106.5 M $79.6 M 34%
Deferred Revenue $183.0 M $130.3 M 40%
GAAP EPS (30¢) (42¢) 12¢
Non‐GAAP EPS (14¢) (28¢) 14¢
Cash Flow from Operations ($4.9M) ($21.7M) $16.8 M
Free Cash Flow ($8.0M) ($39.8M) $31.8

9
$73.5$78.7
$85.0$90.2
$95.7
Q2'16 Q3'16 Q4'16 Q1'17 Q2'17
Strong Revenue Growth of 30% YoY in Q2FY17Continued Execution and High Retention Rate
10
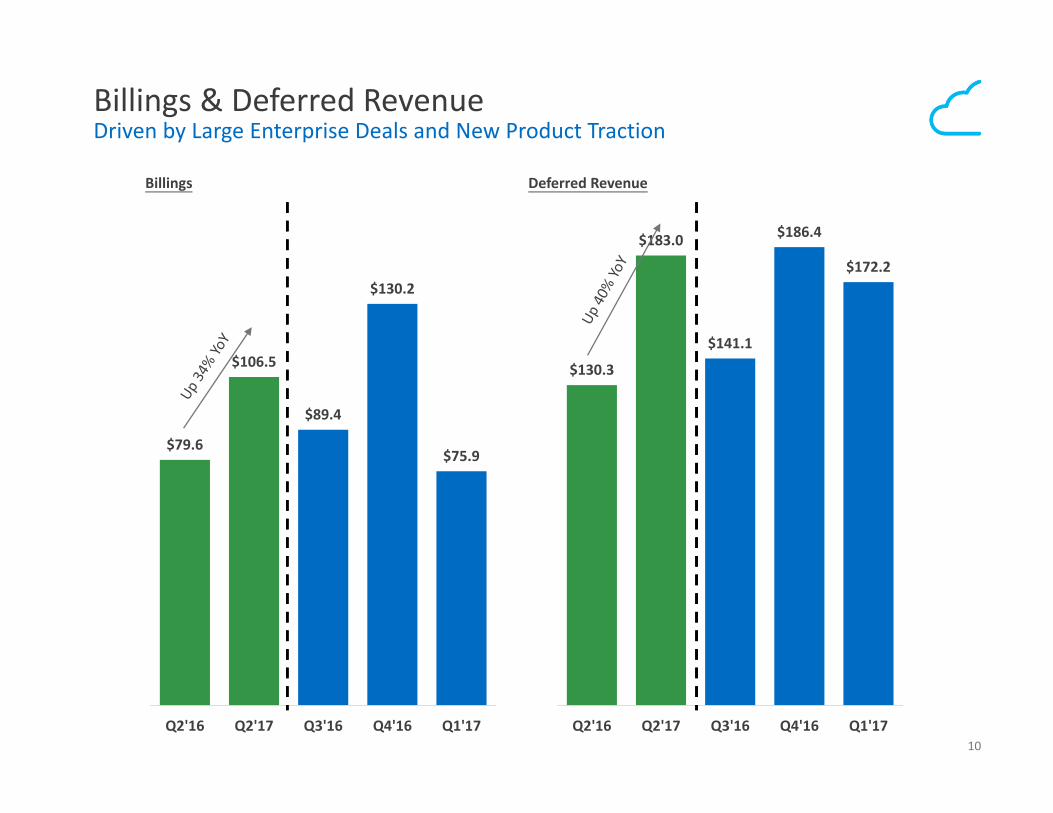
$79.6
$106.5
$89.4
$130.2
$75.9
Q2'16 Q2'17 Q3'16 Q4'16 Q1'17
Billings & Deferred RevenueDriven by Large Enterprise Deals and New Product Traction
$130.3
$183.0
$141.1
$186.4
$172.2
Q2'16 Q2'17 Q3'16 Q4'16 Q1'17
Billings Deferred Revenue
11
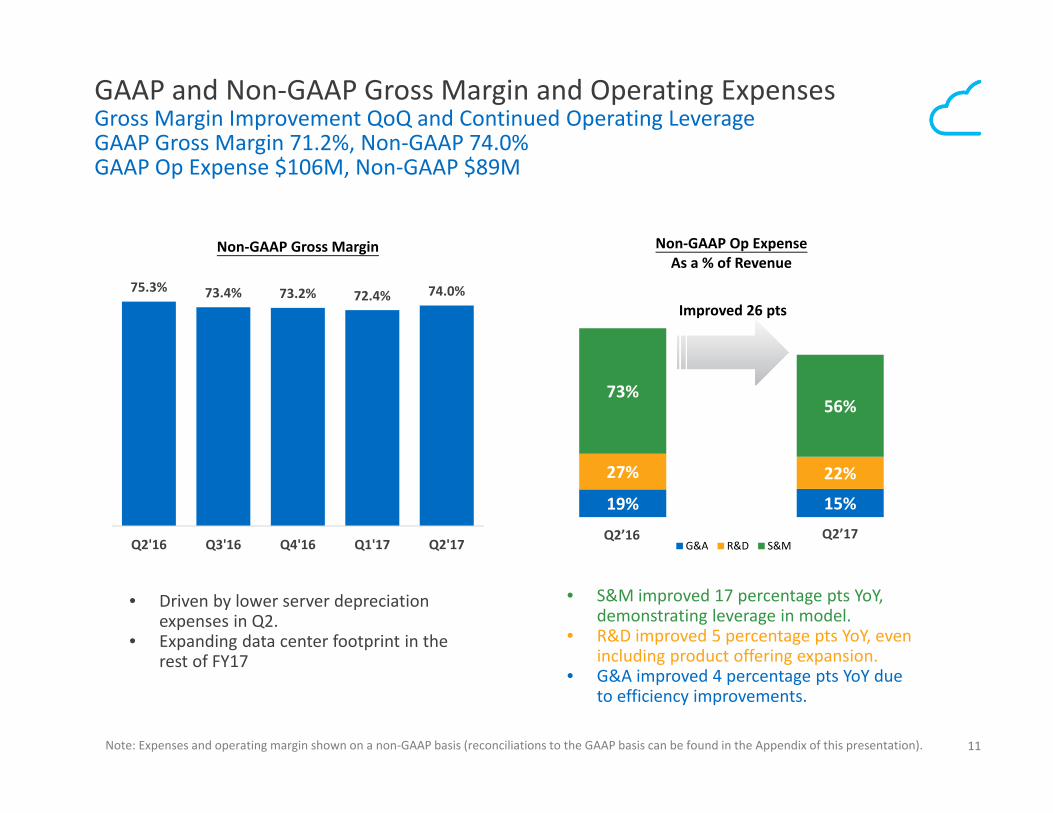
19% 15%
27% 22%
73%56%
Non‐GAAP Op Expense As a % of Revenue
G&A R&D S&MQ2’16 Q2’17
GAAP and Non‐GAAP Gross Margin and Operating ExpensesGross Margin Improvement QoQ and Continued Operating LeverageGAAP Gross Margin 71.2%, Non‐GAAP 74.0%GAAP Op Expense $106M, Non‐GAAP $89M
Note: Expenses and operating margin shown on a non‐GAAP basis (reconciliations to the GAAP basis can be found in the Appendix of this presentation).
• S&M improved 17 percentage pts YoY, demonstrating leverage in model.
• R&D improved 5 percentage pts YoY, even including product offering expansion.
• G&A improved 4 percentage pts YoY due to efficiency improvements.
75.3% 73.4% 73.2% 72.4% 74.0%
Q2'16 Q3'16 Q4'16 Q1'17 Q2'17
Non‐GAAP Gross Margin
Improved 26 pts
• Driven by lower server depreciation expenses in Q2.
• Expanding data center footprint in the rest of FY17
12
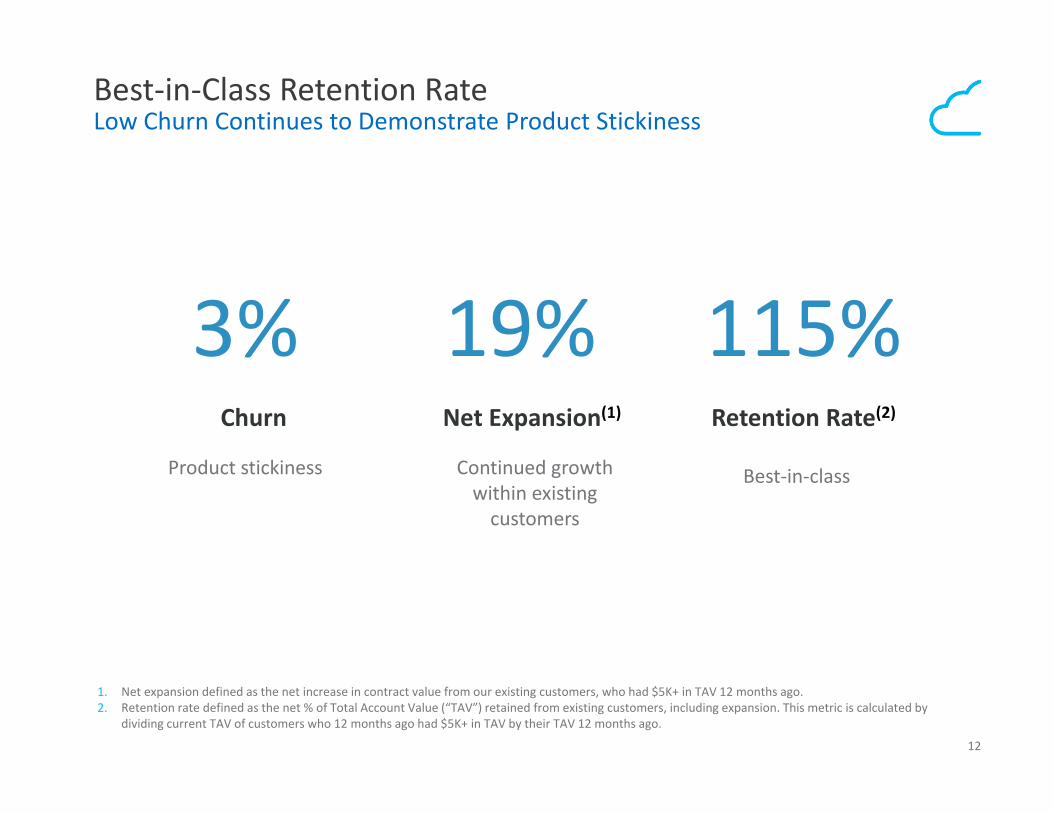
Best‐in‐Class Retention RateLow Churn Continues to Demonstrate Product Stickiness
1. Net expansion defined as the net increase in contract value from our existing customers, who had $5K+ in TAV 12 months ago.2. Retention rate defined as the net % of Total Account Value (“TAV”) retained from existing customers, including expansion. This metric is calculated by
dividing current TAV of customers who 12 months ago had $5K+ in TAV by their TAV 12 months ago.
Retention Rate(2)
115%19%3%Net Expansion(1)Churn
Product stickiness Continued growth within existing customers
Best‐in‐class
13
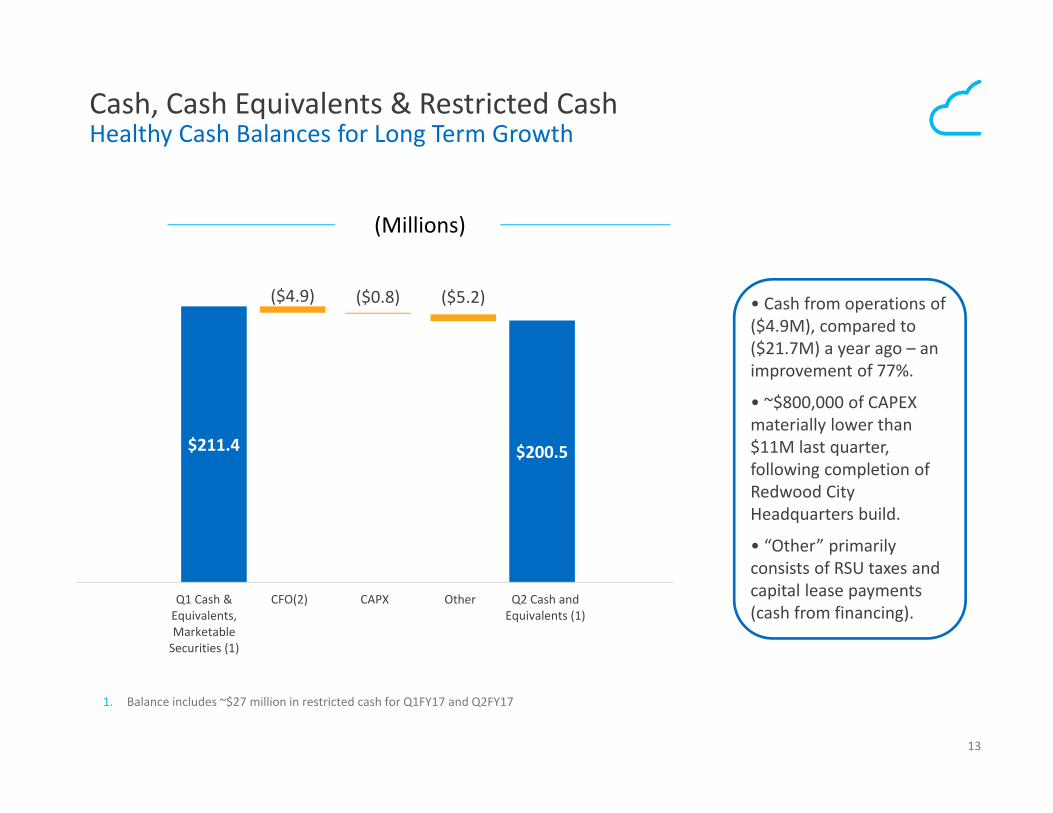
$200.5
($4.9) ($0.8) ($5.2)
$211.4
Q1 Cash &Equivalents,MarketableSecurities (1)
CFO(2) CAPX Other Q2 Cash andEquivalents (1)
Cash, Cash Equivalents & Restricted CashHealthy Cash Balances for Long Term Growth
• Cash from operations of ($4.9M), compared to ($21.7M) a year ago – an improvement of 77%.
• ~$800,000 of CAPEX materially lower than $11M last quarter, following completion of Redwood City Headquarters build.
• “Other” primarily consists of RSU taxes and capital lease payments (cash from financing).
(Millions)
1. Balance includes ~$27 million in restricted cash for Q1FY17 and Q2FY17
14
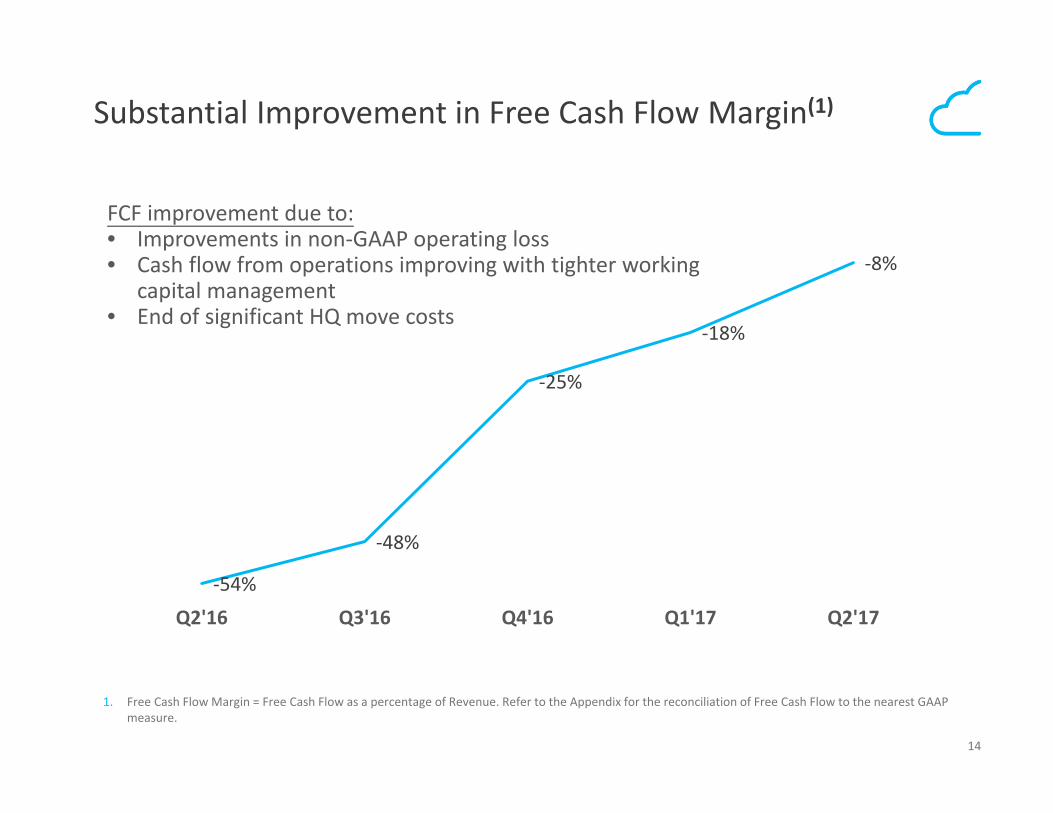
Substantial Improvement in Free Cash Flow Margin(1)
‐54%
‐48%
‐25%
‐18%
‐8%
Q2'16 Q3'16 Q4'16 Q1'17 Q2'17
FCF improvement due to:• Improvements in non‐GAAP operating loss• Cash flow from operations improving with tighter working
capital management• End of significant HQ move costs
1. Free Cash Flow Margin = Free Cash Flow as a percentage of Revenue. Refer to the Appendix for the reconciliation of Free Cash Flow to the nearest GAAP measure.
15
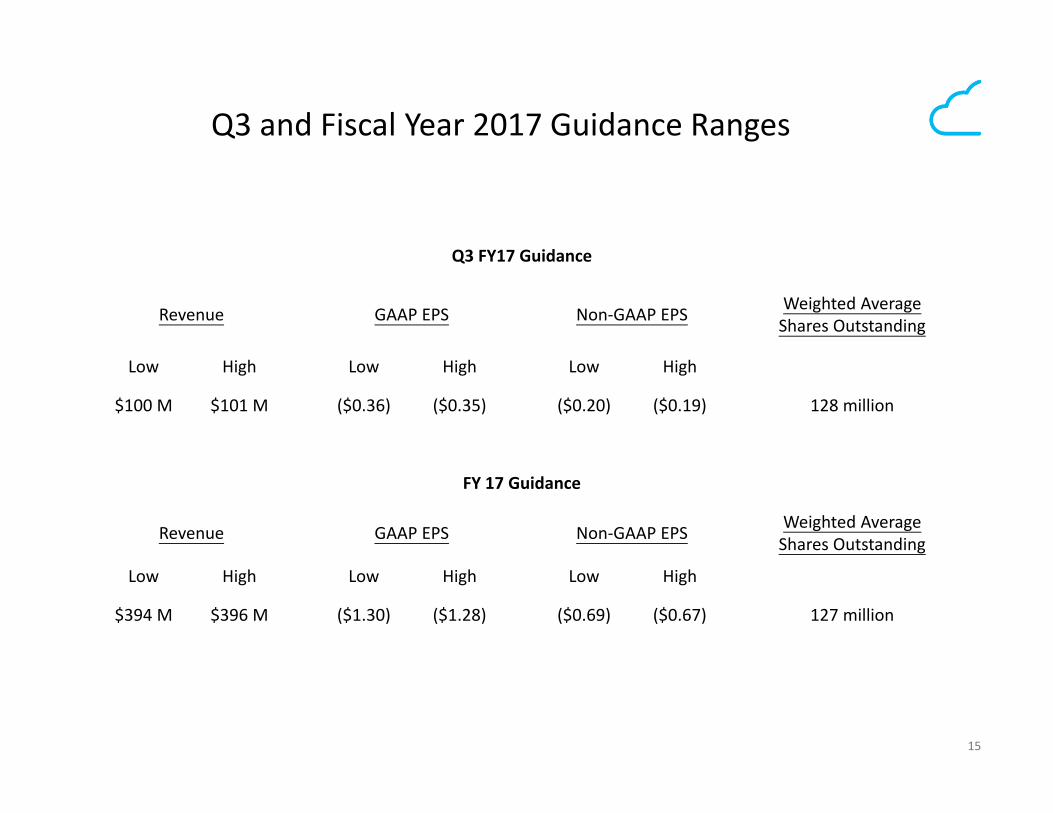
Q3 and Fiscal Year 2017 Guidance Ranges
Q3 FY17 Guidance
Revenue GAAP EPS Non‐GAAP EPS Weighted Average Shares Outstanding
Low High Low High Low High
$100 M $101 M ($0.36) ($0.35) ($0.20) ($0.19) 128 million
FY 17 Guidance
Revenue GAAP EPS Non‐GAAP EPS Weighted Average Shares Outstanding
Low High Low High Low High
$394 M $396 M ($1.30) ($1.28) ($0.69) ($0.67) 127 million
16
Appendix
17
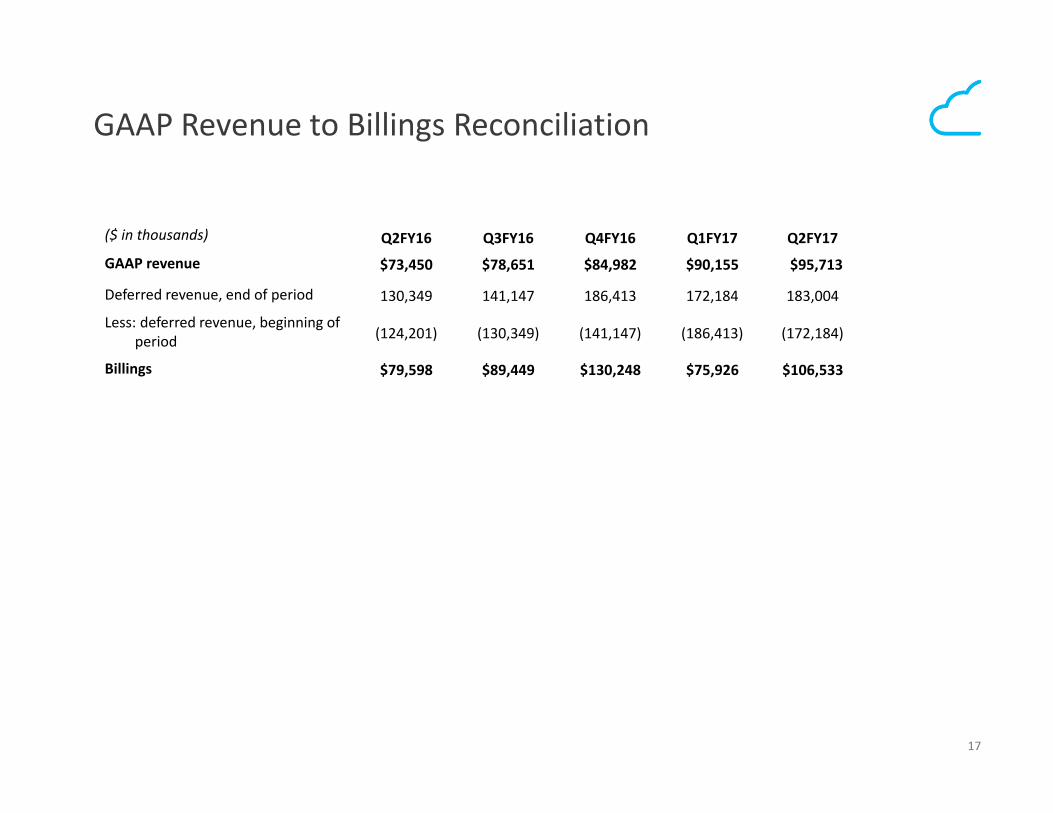
GAAP Revenue to Billings Reconciliation
($ in thousands) Q2FY16 Q3FY16 Q4FY16 Q1FY17 Q2FY17
GAAP revenue $73,450 $78,651 $84,982 $90,155 $95,713
Deferred revenue, end of period 130,349 141,147 186,413 172,184 183,004
Less: deferred revenue, beginning of period (124,201) (130,349) (141,147) (186,413) (172,184)
Billings $79,598 $89,449 $130,248 $75,926 $106,533

18
GAAP to Non‐GAAP Reconciliation – Gross Margin
($ in thousands) Q2FY16As a % of revenue Q3FY16
As a % of revenue Q4FY16
As a % of revenue Q1FY17
As a % of revenue Q2FY17
As a % of revenue
GAAP gross margin $52,814 71.9% $55,021 70.0% $59,301 69.8% $62,296 69.1% $68,111 71.2%Add: Stock‐based
compensation 1,041 1,272 1,500 1,512 1,830
Add: Intangible assets amortization 1,472 1,431 1,433 1,420 878
Non‐GAAP gross margin $55,327 75.3% $57,724 73.4% $62,234 73.2% $65,228 72.4% $70,819 74.0%
19
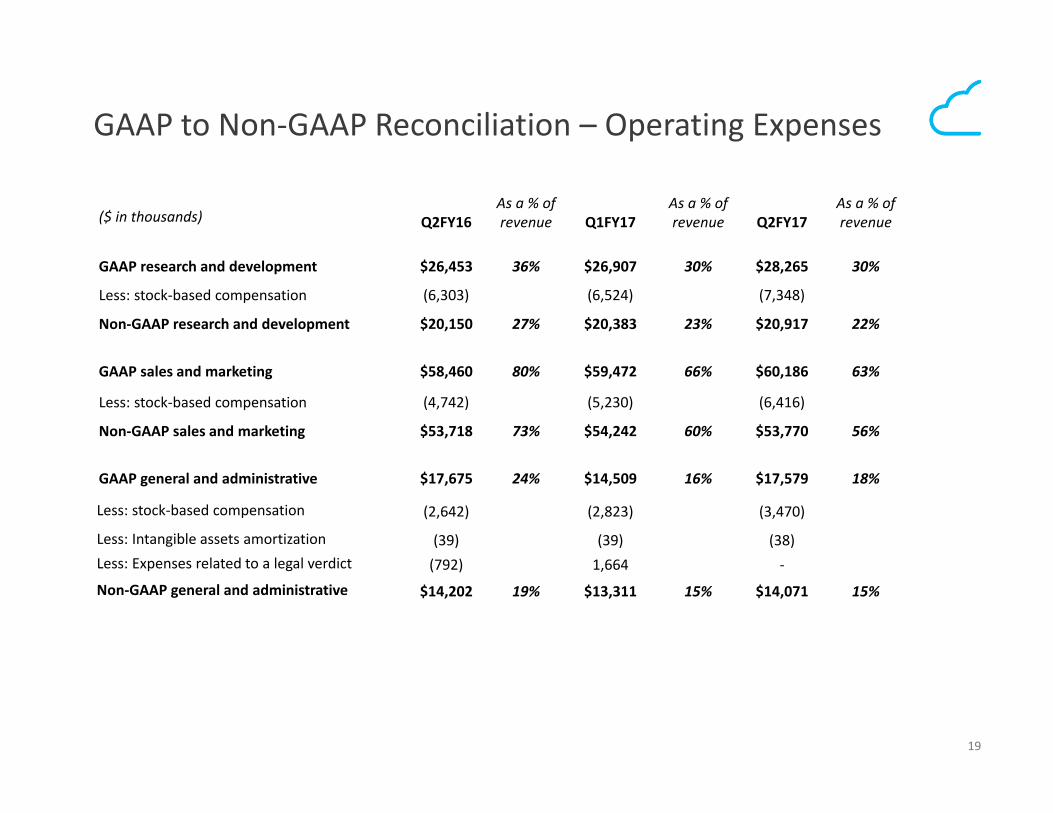
GAAP to Non‐GAAP Reconciliation – Operating Expenses
($ in thousands) Q2FY16As a % of revenue Q1FY17
As a % of revenue Q2FY17
As a % of revenue
GAAP research and development $26,453 36% $26,907 30% $28,265 30%
Less: stock‐based compensation (6,303) (6,524) (7,348)
Non‐GAAP research and development $20,150 27% $20,383 23% $20,917 22%
GAAP sales and marketing $58,460 80% $59,472 66% $60,186 63%
Less: stock‐based compensation (4,742) (5,230) (6,416)
Non‐GAAP sales and marketing $53,718 73% $54,242 60% $53,770 56%
GAAP general and administrative $17,675 24% $14,509 16% $17,579 18%
Less: stock‐based compensation (2,642) (2,823) (3,470)
Less: Intangible assets amortization (39) (39) (38)Less: Expenses related to a legal verdict (792) 1,664 ‐
Non‐GAAP general and administrative $14,202 19% $13,311 15% $14,071 15%
20
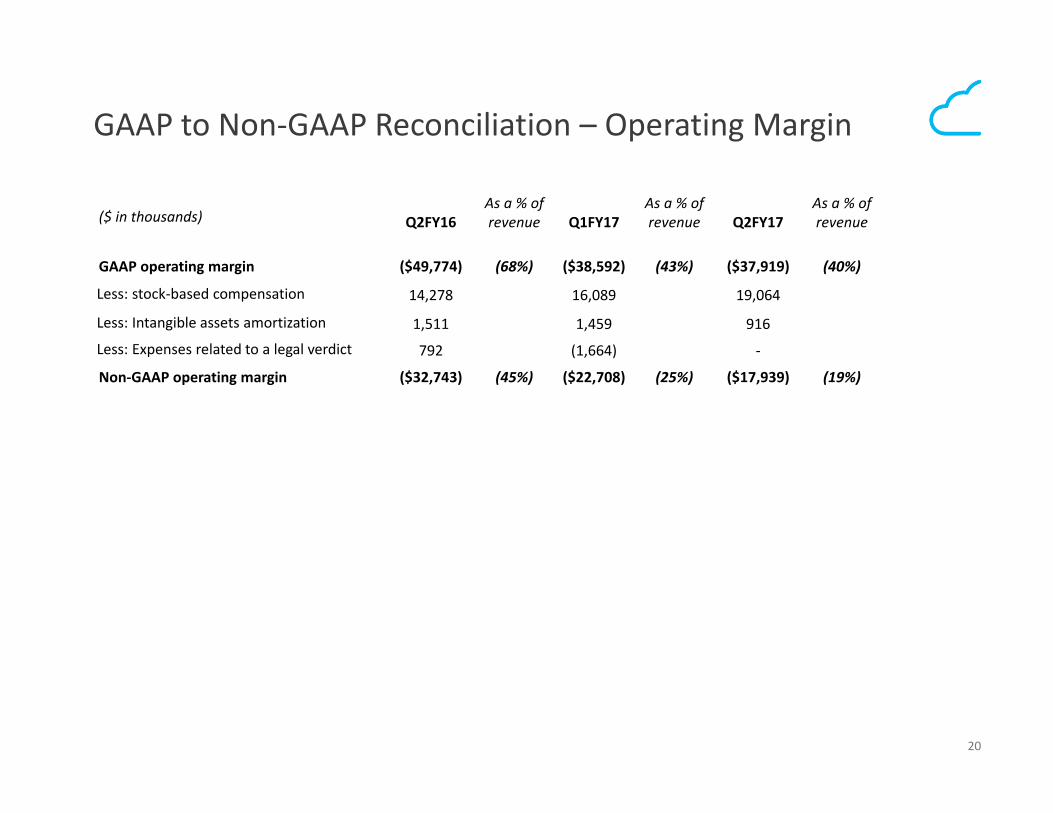
GAAP to Non‐GAAP Reconciliation – Operating Margin
($ in thousands) Q2FY16As a % of revenue Q1FY17
As a % of revenue Q2FY17
As a % of revenue
GAAP operating margin ($49,774) (68%) ($38,592) (43%) ($37,919) (40%)
Less: stock‐based compensation 14,278 16,089 19,064
Less: Intangible assets amortization 1,511 1,459 916
Less: Expenses related to a legal verdict 792 (1,664) ‐
Non‐GAAP operating margin ($32,743) (45%) ($22,708) (25%) ($17,939) (19%)
21
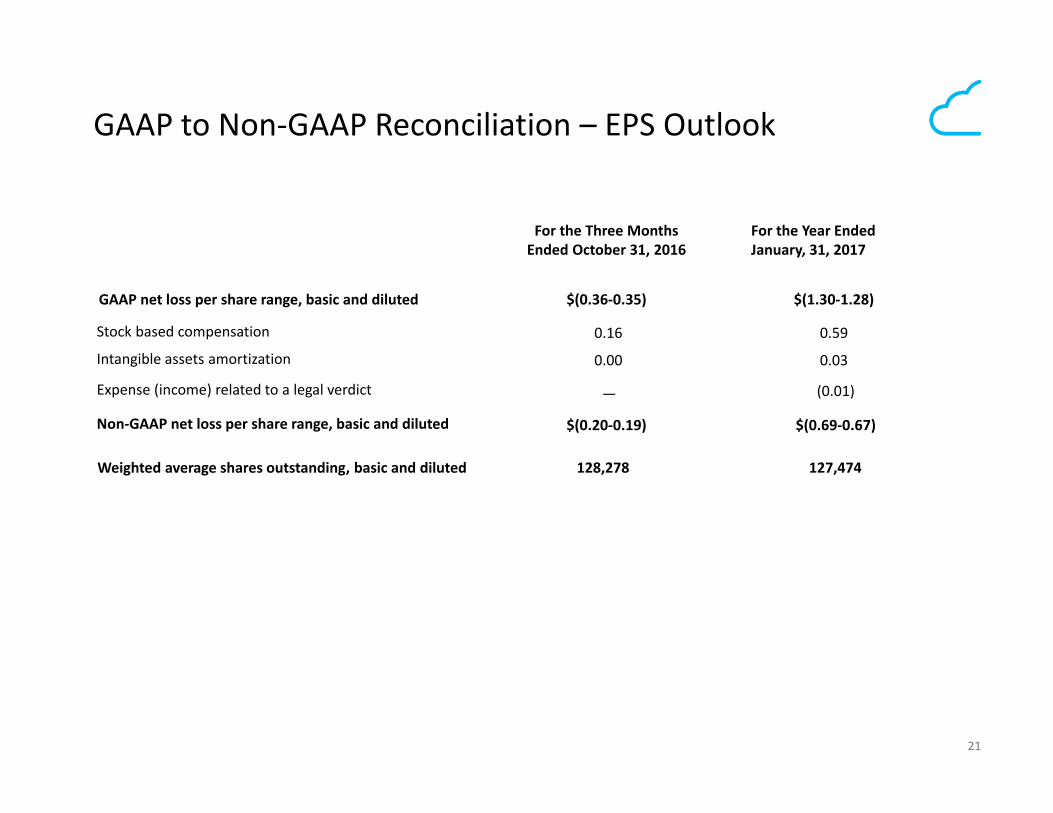
GAAP to Non‐GAAP Reconciliation – EPS Outlook
For the Three Months Ended October 31, 2016
For the Year Ended January, 31, 2017
GAAP net loss per share range, basic and diluted $(0.36‐0.35) $(1.30‐1.28)
Stock based compensation 0.16 0.59
Intangible assets amortization 0.00 0.03
Expense (income) related to a legal verdict — (0.01)
Non‐GAAP net loss per share range, basic and diluted $(0.20‐0.19) $(0.69‐0.67)
Weighted average shares outstanding, basic and diluted 128,278 127,474