Embed Size (px)
Citation preview
Investor PresentationNovember 2017
Newmont Mining Corporation I Investor Presentation I Slide 2November 2017
Cautionary statement
Cautionary statement regarding forward looking statements:
This presentation contains “forward-looking statements” within the meaning of Section 27A of the Securities Act of 1933, as amended, and Section21E of the Securities Exchange Act of 1934, as amended, which are intended to be covered by the safe harbor created by such sections and otherapplicable laws. Such forward-looking statements may include, without limitation: (i) estimates of future production and sales; (ii) estimates offuture costs applicable to sales and All-in sustaining costs; (iii) estimates of future capital expenditures; (iv) estimates of future cost reductions andefficiencies; (v) expectations regarding the development, growth and potential of the Company’s operations, projects and investments, including,without limitation, profitability, returns, IRR, schedule, decision dates, mine life, commercial production, first production, development capital,average production, average AISC and upside potential; (vi) expectations regarding future free cash flow generation, liquidity and balance sheetstrength; (vii) estimates of future closure costs and liabilities; and (viii) expectations of future dividends and returns to shareholders. Estimates orexpectations of future events or results are based upon certain assumptions, which may prove to be incorrect. Such assumptions, include, but arenot limited to: (i) there being no significant change to current geotechnical, metallurgical, hydrological and other physical conditions; (ii) permitting,development, operations and expansion of the Company’s operations and projects being consistent with current expectations and mine plans; (iii)political developments in any jurisdiction in which the Company operates being consistent with its current expectations; (iv) certain exchange rateassumptions for the Australian dollar to the U.S. dollar, as well as other the exchange rates being approximately consistent with current levels; (v)certain price assumptions for gold, copper and oil; (vi) prices for key supplies being approximately consistent with current levels; (vii) the accuracyof our current mineral reserve and mineralized material estimates; and (viii) other assumptions noted herein. Potential additional risks include otherpolitical, regulatory or legal challenges and community and labor issues. Where the Company expresses or implies an expectation or belief as tofuture events or results, such expectation or belief is expressed in good faith and believed to have a reasonable basis. However, such statementsare subject to risks, uncertainties and other factors, which could cause actual results to differ materially from future results expressed, projected orimplied by the “forward-looking statements”. Other risks relating to forward looking statements in regard to the Company’s business and futureperformance may include, but are not limited to, gold and other metals price volatility, currency fluctuations, increased production costs andvariances in ore grade or recovery rates from those assumed in mining plans, political and operational risks, community relations, conflictresolution and outcome of projects or oppositions and governmental regulation and judicial outcomes. For a more detailed discussion of such risksand other factors, see the Company’s 2016 Annual Report on Form 10-K, filed on February 21, 2017, with the Securities and ExchangeCommission (SEC) as well as the Company’s other SEC filings. The Company does not undertake any obligation to release publicly revisions toany “forward-looking statement,” including, without limitation, outlook, to reflect events or circumstances after the date of this presentation, or toreflect the occurrence of unanticipated events, except as may be required under applicable securities laws. Investors should not assume that anylack of update to a previously issued “forward-looking statement” constitutes a reaffirmation of that statement. Continued reliance on “forward-looking statements” is at investors' own risk. Investors are reminded that this presentation should be read in conjunction with Newmont’s Form 10-Q which has been filed on October 26, 2017 with the SEC (also available at www.newmont.com). Investors are also reminded to refer to theendnotes at the back of this presentation and that historical safety performance, reserve statistics and financial results (including AISC andproduction figures) referenced herein exclude results from the Company’s former Batu Hijau operation, which was divested by the Company in2016.
Newmont Mining Corporation I Investor Presentation I Slide 3November 2017
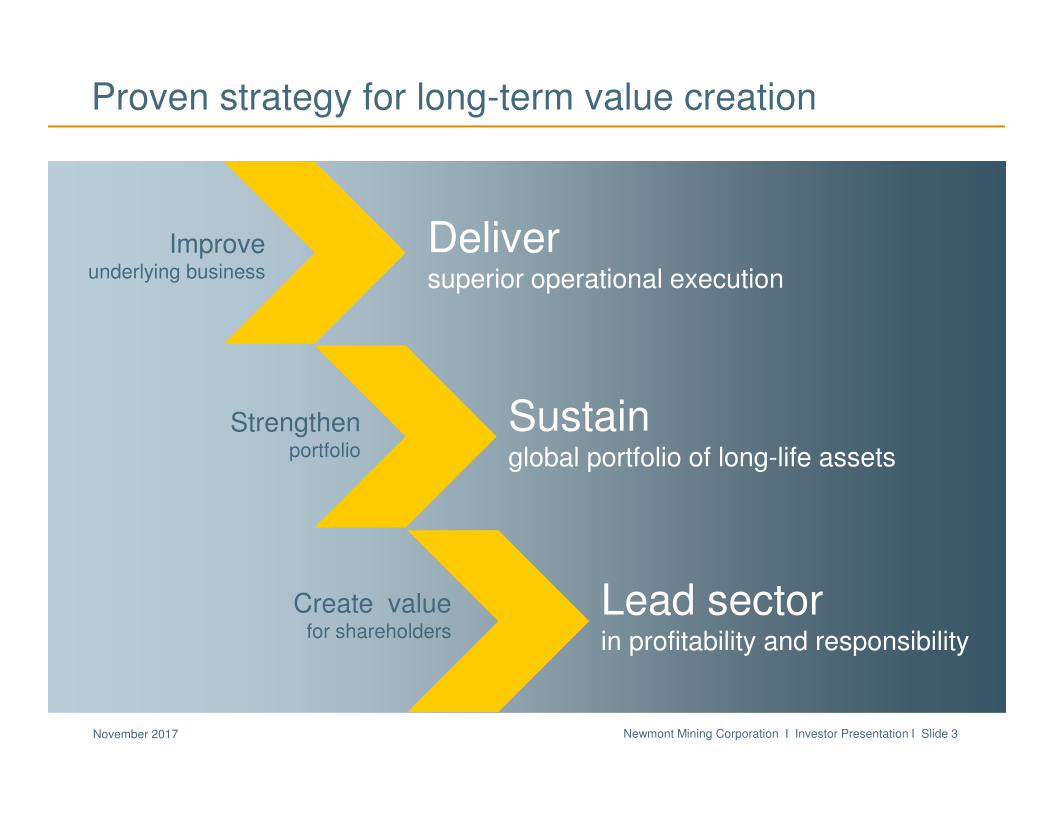
Proven strategy for long-term value creation
Improveunderlying business
Deliversuperior operational execution
Strengthenportfolio
Sustainglobal portfolio of long-life assets
Create valuefor shareholders
Lead sectorin profitability and responsibility
Newmont Mining Corporation I Investor Presentation I Slide 4November 2017
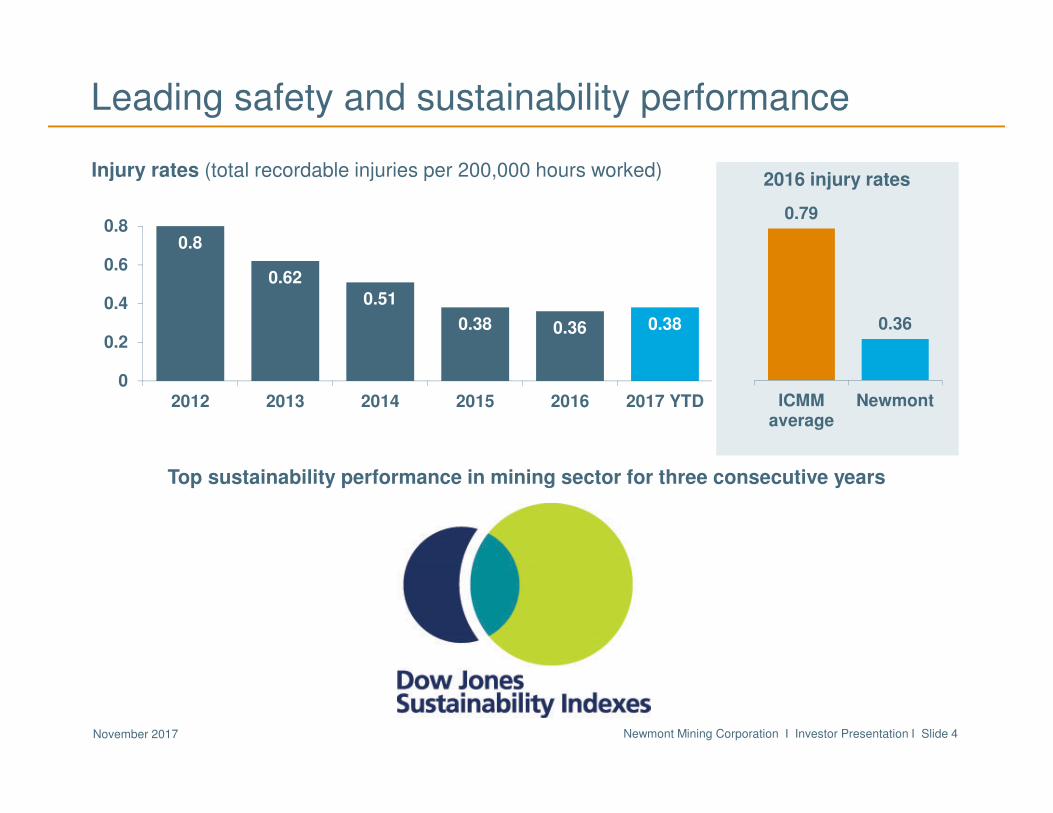
Leading safety and sustainability performance
0.79
0.36
ICMMaverage
Newmont
2016 injury ratesInjury rates (total recordable injuries per 200,000 hours worked)
Top sustainability performance in mining sector for three consecutive years
0.8
0.62
0.51
0.38 0.36 0.38
0
0.2
0.4
0.6
0.8
2012 2013 2014 2015 2016 2017 YTD
Newmont Mining Corporation I Investor Presentation I Slide 5November 2017
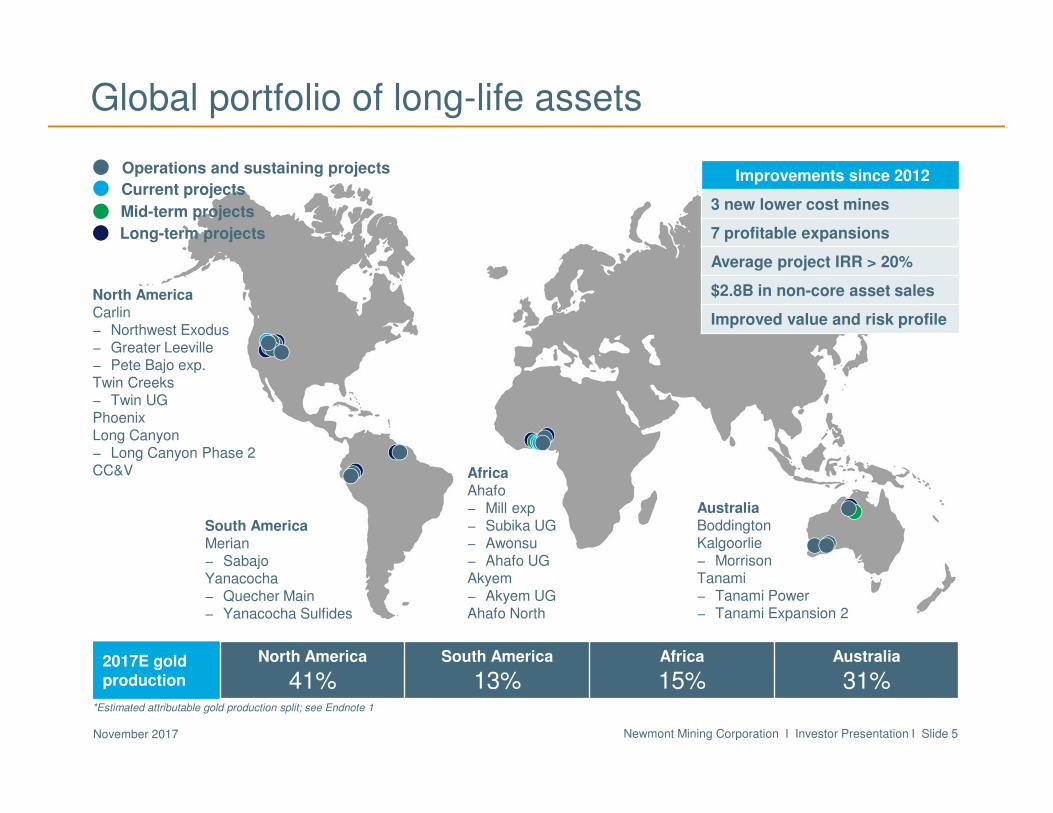
Global portfolio of long-life assets
AustraliaBoddingtonKalgoorlie− MorrisonTanami − Tanami Power− Tanami Expansion 2
North America Carlin − Northwest Exodus− Greater Leeville− Pete Bajo exp.Twin Creeks− Twin UGPhoenixLong Canyon− Long Canyon Phase 2CC&V
South AmericaMerian− SabajoYanacocha− Quecher Main− Yanacocha Sulfides
AfricaAhafo− Mill exp− Subika UG− Awonsu− Ahafo UGAkyem− Akyem UGAhafo North
Operations and sustaining projects Improvements since 2012
3 new lower cost mines
7 profitable expansions
Average project IRR > 20%
$2.8B in non-core asset sales
Improved value and risk profile
Current projects
Mid-term projects
Long-term projects
2017E gold production
North America
41%South America
13%Africa
15%Australia
31%*Estimated attributable gold production split; see Endnote 1

Newmont Mining Corporation I Investor Presentation I Slide 6November 2017
Quecher Main to extend Yanacocha life to 2027
Metrics Quecher Main
Production* 200 Koz
Development capital $250 – $300M
First production early 2019
Commercial production Q4 2019
Internal Rate of Return >10%
From 2020 – 2025, Quecher Main delivers:
• Yanacocha production ~200 Koz/year*
• Average CAS of $750 – $850/oz**
• Average AISC of $900 – $1,000/oz**
• Bridge to development of Yanacocha sulfides
Early Works for Quecher Main
* Production represents Yanacocha (100%) from 2020-2025; ** CAS & AISC represent incremental unit costs 2020-2025. See Endnotes 1 and 2.
Newmont Mining Corporation I Investor Presentation I Slide 7November 2017
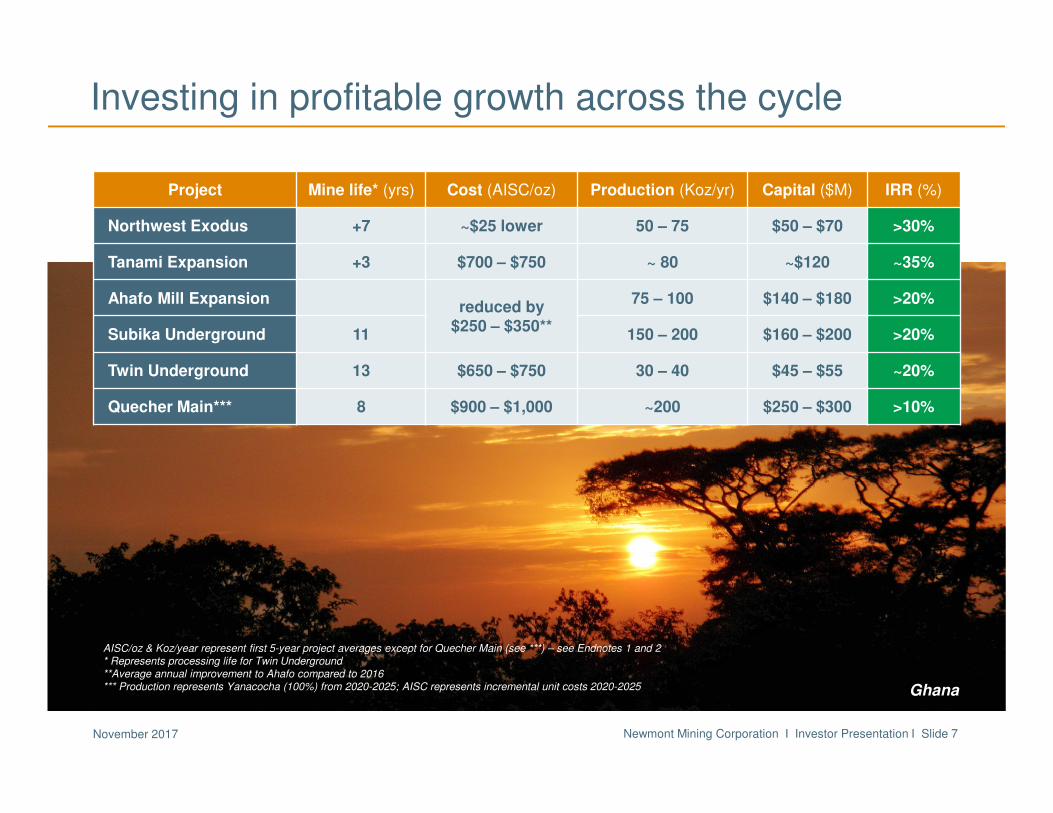
Investing in profitable growth across the cycle
Project Mine life* (yrs) Cost (AISC/oz) Production (Koz/yr) Capital ($M) IRR (%)
Northwest Exodus +7 ~$25 lower 50 – 75 $50 – $70 >30%
Tanami Expansion +3 $700 – $750 ~ 80 ~$120 ~35%
Ahafo Mill Expansionreduced by
$250 – $350**
75 – 100 $140 – $180 >20%
Subika Underground 11 150 – 200 $160 – $200 >20%
Twin Underground 13 $650 – $750 30 – 40 $45 – $55 ~20%
Quecher Main*** 8 $900 – $1,000 ~200 $250 – $300 >10%
AISC/oz & Koz/year represent first 5-year project averages except for Quecher Main (see ***) – see Endnotes 1 and 2* Represents processing life for Twin Underground**Average annual improvement to Ahafo compared to 2016*** Production represents Yanacocha (100%) from 2020-2025; AISC represents incremental unit costs 2020-2025 Ghana
Newmont Mining Corporation I Investor Presentation I Slide 8November 2017
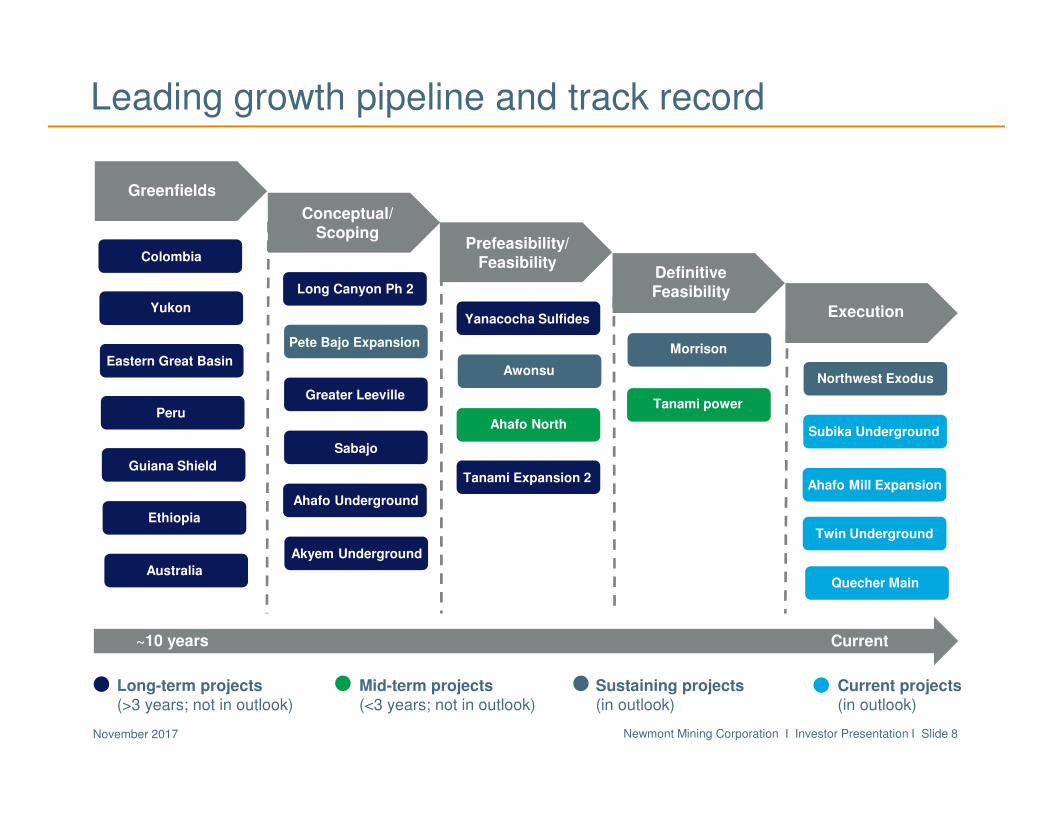
Leading growth pipeline and track record
Morrison
Greenfields
Conceptual/ Scoping
Prefeasibility/ Feasibility
Definitive Feasibility
Execution
Eastern Great Basin
Peru
Guiana Shield
Ethiopia
Australia
Long Canyon Ph 2
Pete Bajo Expansion
Greater Leeville
Sabajo
Akyem Underground
Yanacocha Sulfides
Awonsu
Ahafo Underground
Ahafo North
Tanami Expansion 2
Twin Underground
Quecher Main
Northwest Exodus
Subika Underground
~10 years Current
Ahafo Mill Expansion
Yukon
Colombia
Sustaining projects (in outlook)
Current projects (in outlook)
Mid-term projects (<3 years; not in outlook)
Long-term projects (>3 years; not in outlook)
Tanami power
Newmont Mining Corporation I Investor Presentation I Slide 9November 2017
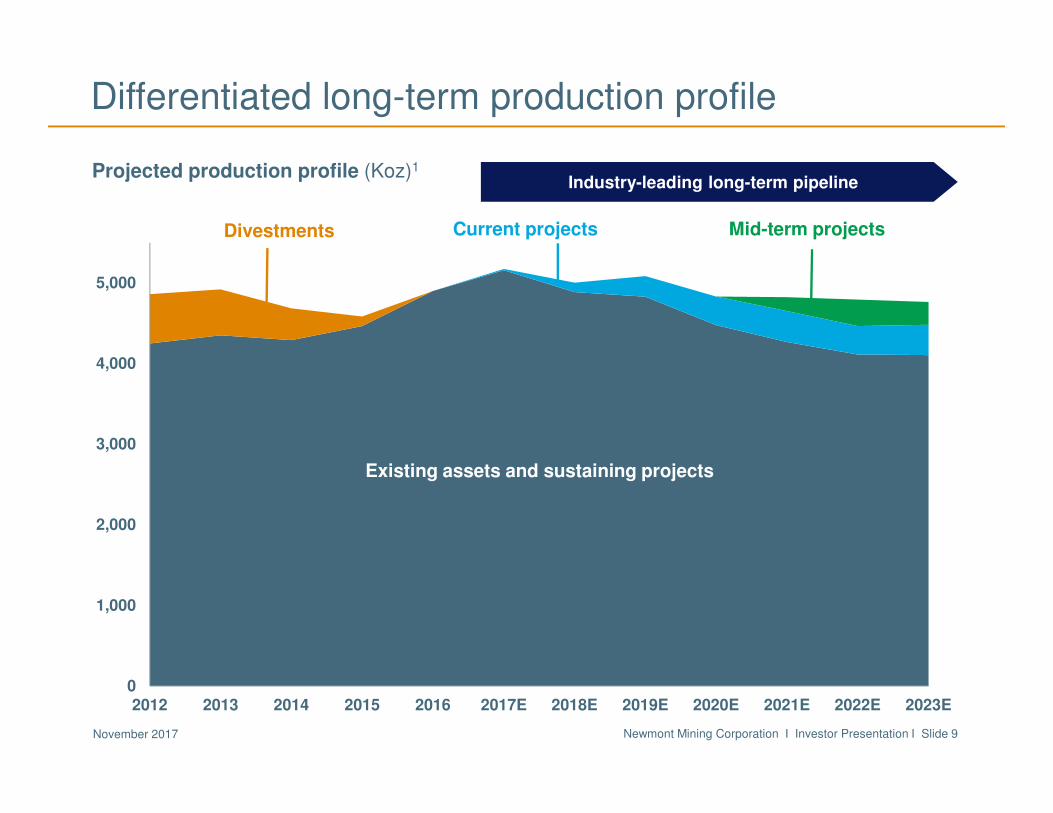
Differentiated long-term production profile
Projected production profile (Koz)1
Industry-leading long-term pipeline
Existing assets and sustaining projects
Existing assets and sustaining projects
0
1,000
2,000
3,000
4,000
5,000
2012 2013 2014 2015 2016 2017E 2018E 2019E 2020E 2021E 2022E 2023E
Divestments Current projects Mid-term projects
Existing assets and sustaining projects
Newmont Mining Corporation I Investor Presentation I Slide 10November 2017
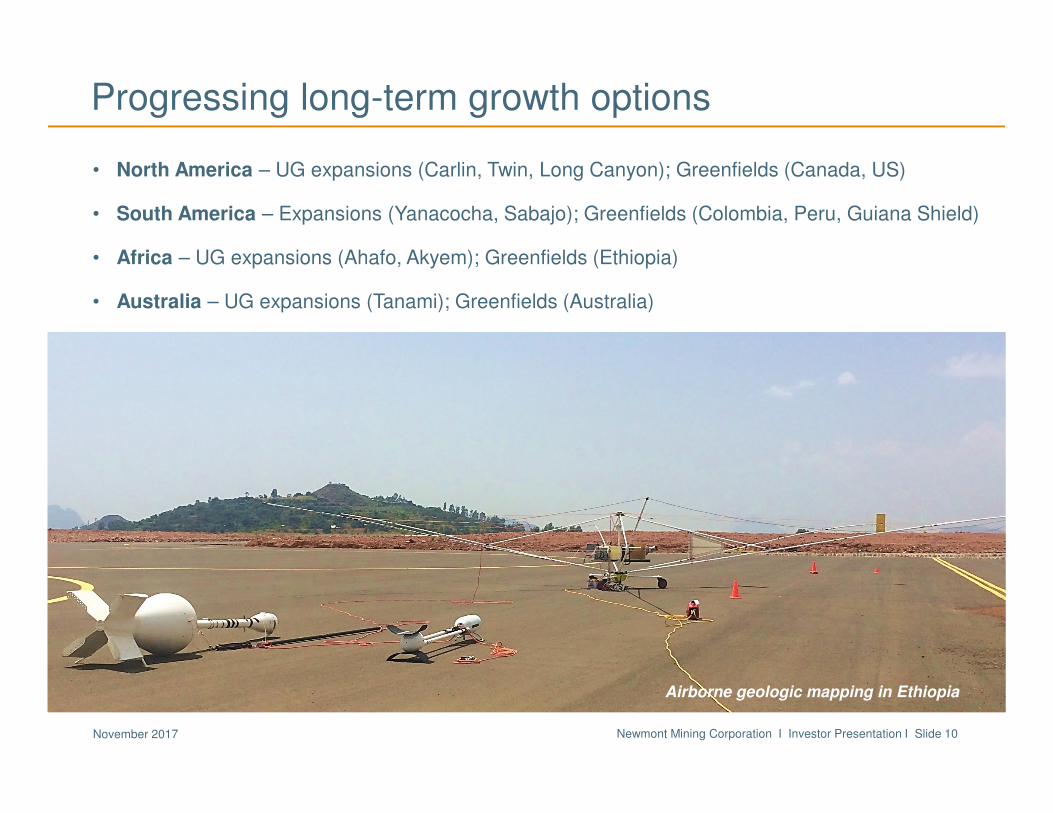
Progressing long-term growth options
• North America – UG expansions (Carlin, Twin, Long Canyon); Greenfields (Canada, US)
• South America – Expansions (Yanacocha, Sabajo); Greenfields (Colombia, Peru, Guiana Shield)
• Africa – UG expansions (Ahafo, Akyem); Greenfields (Ethiopia)
• Australia – UG expansions (Tanami); Greenfields (Australia)
Airborne geologic mapping in Ethiopia
Newmont Mining Corporation I Investor Presentation I Slide 11November 2017
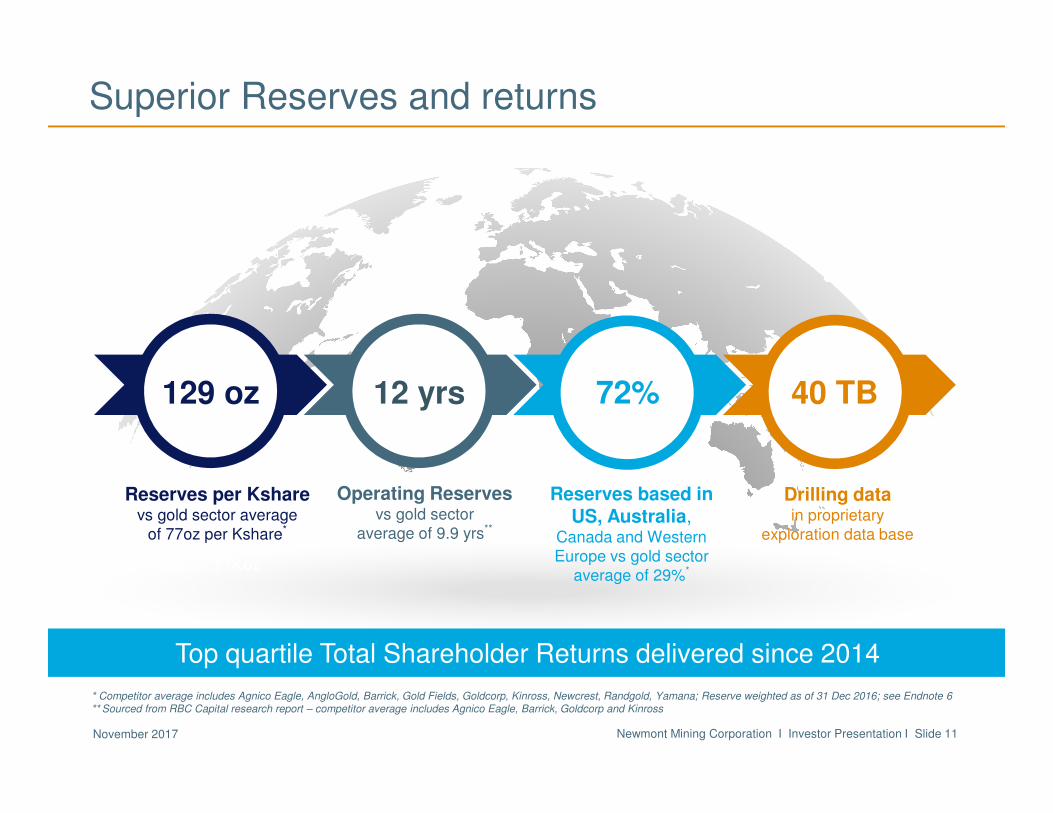
Superior Reserves and returns
* Competitor average includes Agnico Eagle, AngloGold, Barrick, Gold Fields, Goldcorp, Kinross, Newcrest, Randgold and Yamana and is Reserve weighted as of 12/21/2016** Sourced from RBC Capital research report – competitor average includes Agnico Eagle, Barrick, Goldcorp and Kinross *** Need footnote
vs gold sector average of 77Koz
Reserves per Ksharevs gold sector average
of 77oz per Kshare*
Operating Reserves vs gold sector
average of 9.9 yrs**
Reserves based in US, Australia,
Canada and Western Europe vs gold sector
average of 29%*
Drilling datain proprietary
exploration data base
129 oz 12 yrs 72% 40 TB
* Competitor average includes Agnico Eagle, AngloGold, Barrick, Gold Fields, Goldcorp, Kinross, Newcrest, Randgold, Yamana; Reserve weighted as of 31 Dec 2016; see Endnote 6** Sourced from RBC Capital research report – competitor average includes Agnico Eagle, Barrick, Goldcorp and Kinross
Top quartile Total Shareholder Returns delivered since 2014
Newmont Mining Corporation I Investor Presentation I Slide 12November 2017
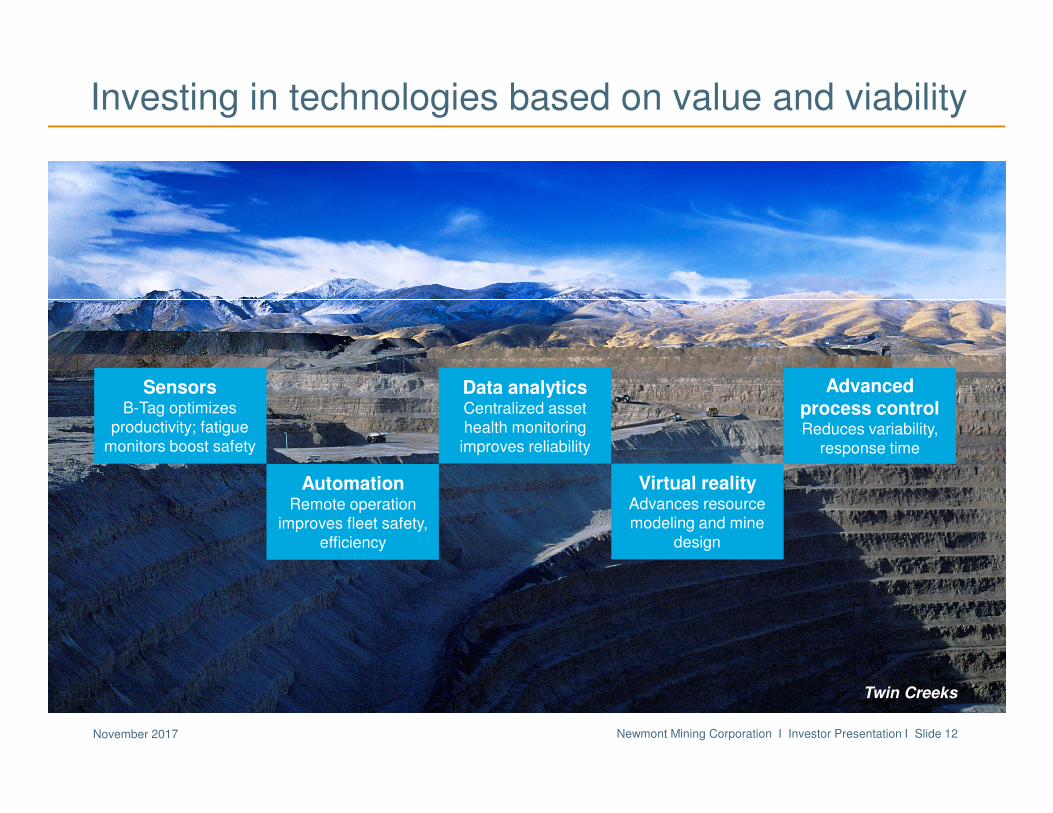
Investing in technologies based on value and viability
SensorsB-Tag optimizes
productivity; fatigue monitors boost safety
AutomationRemote operation
improves fleet safety, efficiency
Virtual realityAdvances resource modeling and mine
design
Advanced process controlReduces variability,
response time
Data analyticsCentralized asset health monitoring improves reliability
Twin Creeks
Newmont Mining Corporation I Investor Presentation I Slide 13November 2017
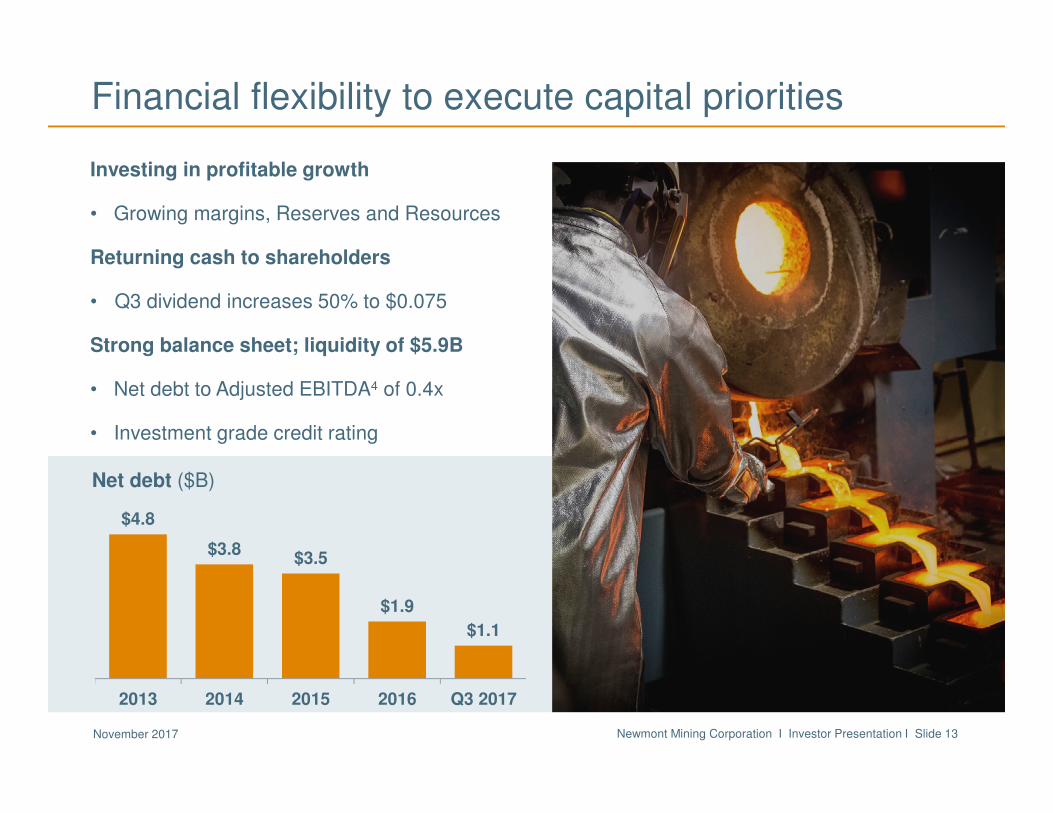
$4.8
$3.8$3.5
$1.9
$1.1
2013 2014 2015 2016 Q3 2017
Financial flexibility to execute capital priorities
Investing in profitable growth
• Growing margins, Reserves and Resources
Returning cash to shareholders
• Q3 dividend increases 50% to $0.075
Strong balance sheet; liquidity of $5.9B
• Net debt to Adjusted EBITDA4 of 0.4x
• Investment grade credit rating
Net debt ($B)
Ahafo gold pour
Newmont Mining Corporation I Investor Presentation I Slide 14November 2017
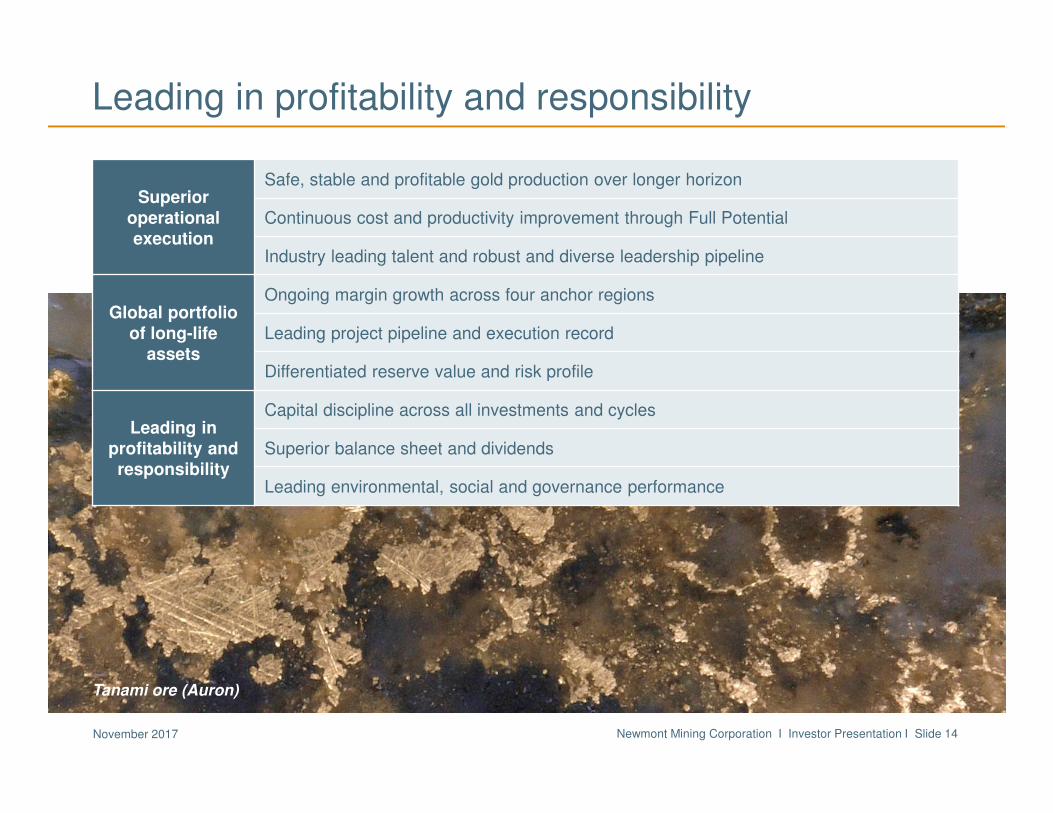
Leading in profitability and responsibility
Superior operationalexecution
Safe, stable and profitable gold production over longer horizon
Continuous cost and productivity improvement through Full Potential
Industry leading talent and robust and diverse leadership pipeline
Global portfolioof long-life
assets
Ongoing margin growth across four anchor regions
Leading project pipeline and execution record
Differentiated reserve value and risk profile
Leading inprofitability and responsibility
Capital discipline across all investments and cycles
Superior balance sheet and dividends
Leading environmental, social and governance performance
Tanami ore (Auron)
Appendix
Newmont Mining Corporation I Investor Presentation I Slide 16November 2017
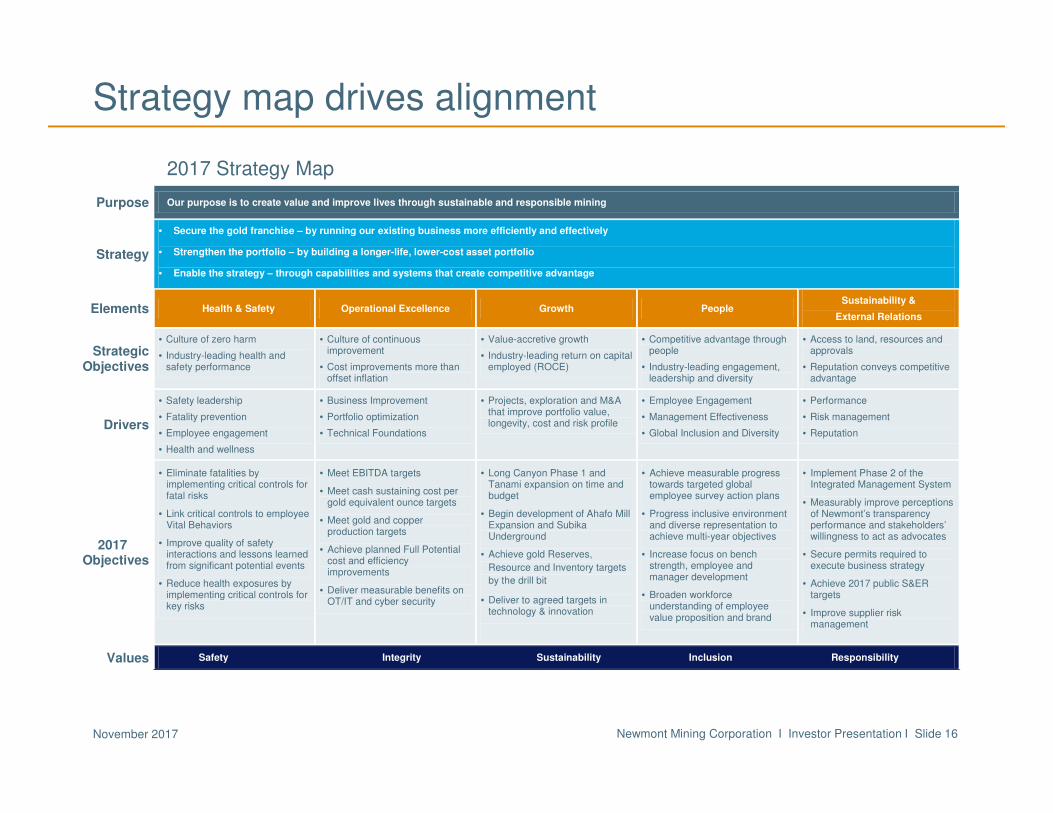
Strategy map drives alignment
2017 Strategy Map
Purpose Our purpose is to create value and improve lives through sustainable and responsible mining
Strategy
• Secure the gold franchise – by running our existing business more efficiently and effectively
• Strengthen the portfolio – by building a longer-life, lower-cost asset portfolio
• Enable the strategy – through capabilities and systems that create competitive advantage
Elements Health & Safety Operational Excellence Growth People Sustainability &
External Relations
Strategic Objectives
• Culture of zero harm
• Industry-leading health and safety performance
• Culture of continuous improvement
• Cost improvements more than offset inflation
• Value-accretive growth
• Industry-leading return on capital employed (ROCE)
• Competitive advantage through people
• Industry-leading engagement, leadership and diversity
• Access to land, resources and approvals
• Reputation conveys competitive advantage
Drivers
• Safety leadership
• Fatality prevention
• Employee engagement
• Health and wellness
• Business Improvement
• Portfolio optimization
• Technical Foundations
• Projects, exploration and M&A that improve portfolio value, longevity, cost and risk profile
• Employee Engagement
• Management Effectiveness
• Global Inclusion and Diversity
• Performance
• Risk management
• Reputation
2017 BP Objectives
• Eliminate fatalities by implementing critical controls for fatal risks
• Link critical controls to employee Vital Behaviors
• Improve quality of safety interactions and lessons learned from significant potential events
• Reduce health exposures by implementing critical controls for key risks
• Meet EBITDA targets
• Meet cash sustaining cost per gold equivalent ounce targets
• Meet gold and copper production targets
• Achieve planned Full Potential cost and efficiency improvements
• Deliver measurable benefits on OT/IT and cyber security
• Long Canyon Phase 1 and Tanami expansion on time and budget
• Begin development of Ahafo Mill Expansion and Subika Underground
• Achieve gold Reserves,
Resource and Inventory targets
by the drill bit
• Deliver to agreed targets in technology & innovation
• Achieve measurable progress towards targeted global employee survey action plans
• Progress inclusive environment and diverse representation to achieve multi-year objectives
• Increase focus on bench strength, employee and manager development
• Broaden workforce understanding of employee value proposition and brand
• Implement Phase 2 of the Integrated Management System
• Measurably improve perceptions of Newmont’s transparency performance and stakeholders’ willingness to act as advocates
• Secure permits required to execute business strategy
• Achieve 2017 public S&ER targets
• Improve supplier risk management
Values Safety Integrity Sustainability Inclusion Responsibility
Newmont Mining Corporation I Investor Presentation I Slide 17November 2017
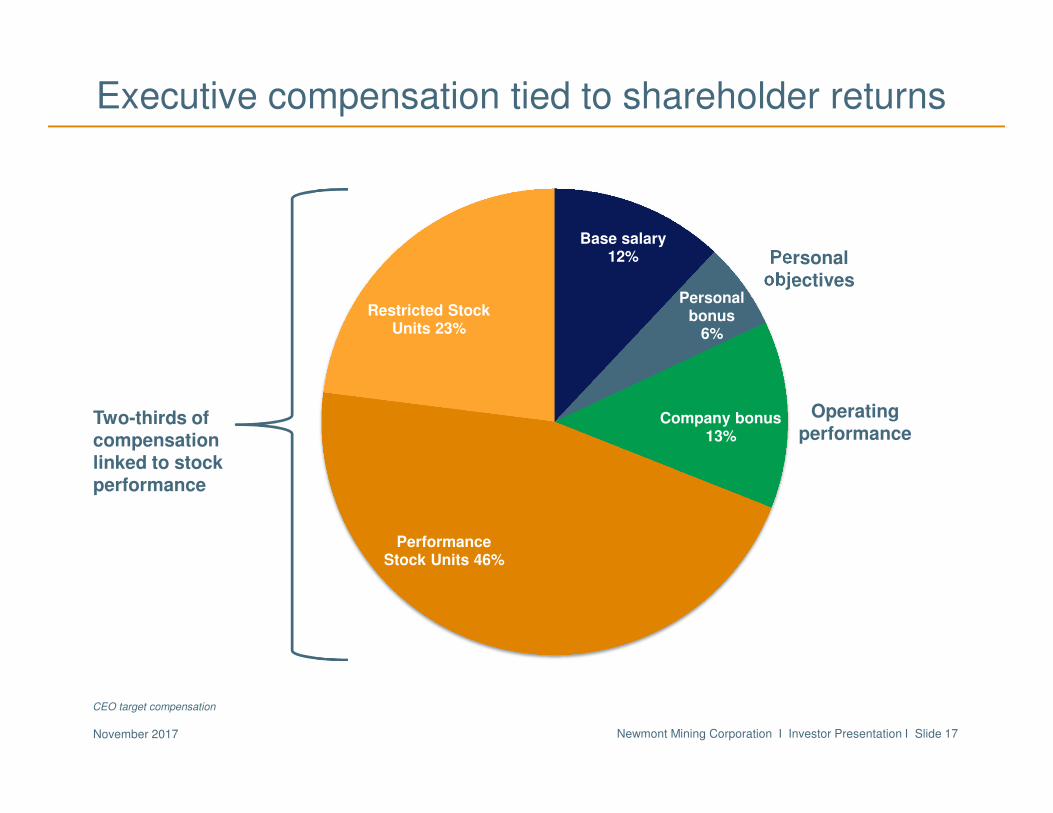
Personal objectives
Two-thirds of compensation linked to stock performance
Operating performance
Executive compensation tied to shareholder returns
CEO target compensation
Base salary 12%
Personal bonus
6%
Company bonus 13%
Performance Stock Units 46%
Restricted Stock Units 23%
Newmont Mining Corporation I Investor Presentation I Slide 18November 2017
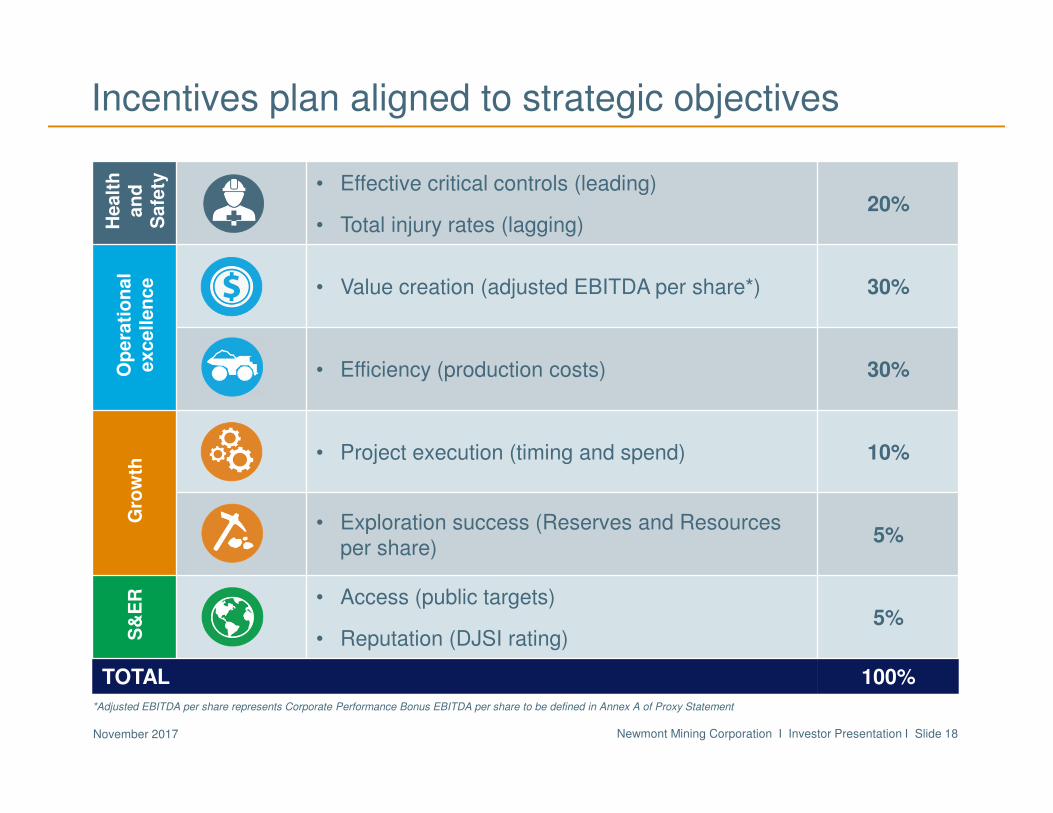
Incentives plan aligned to strategic objectivesH
ealt
h
an
d
Safe
ty • Effective critical controls (leading)
• Total injury rates (lagging)20%
Op
era
tio
nal
excell
en
ce • Value creation (adjusted EBITDA per share*) 30%
• Efficiency (production costs) 30%
Gro
wth
• Project execution (timing and spend) 10%
• Exploration success (Reserves and Resources per share)
5%
S&
ER • Access (public targets)
• Reputation (DJSI rating)5%
TOTAL 100%
*Adjusted EBITDA per share represents Corporate Performance Bonus EBITDA per share to be defined in Annex A of Proxy Statement
Newmont Mining Corporation I Investor Presentation I Slide 19November 2017
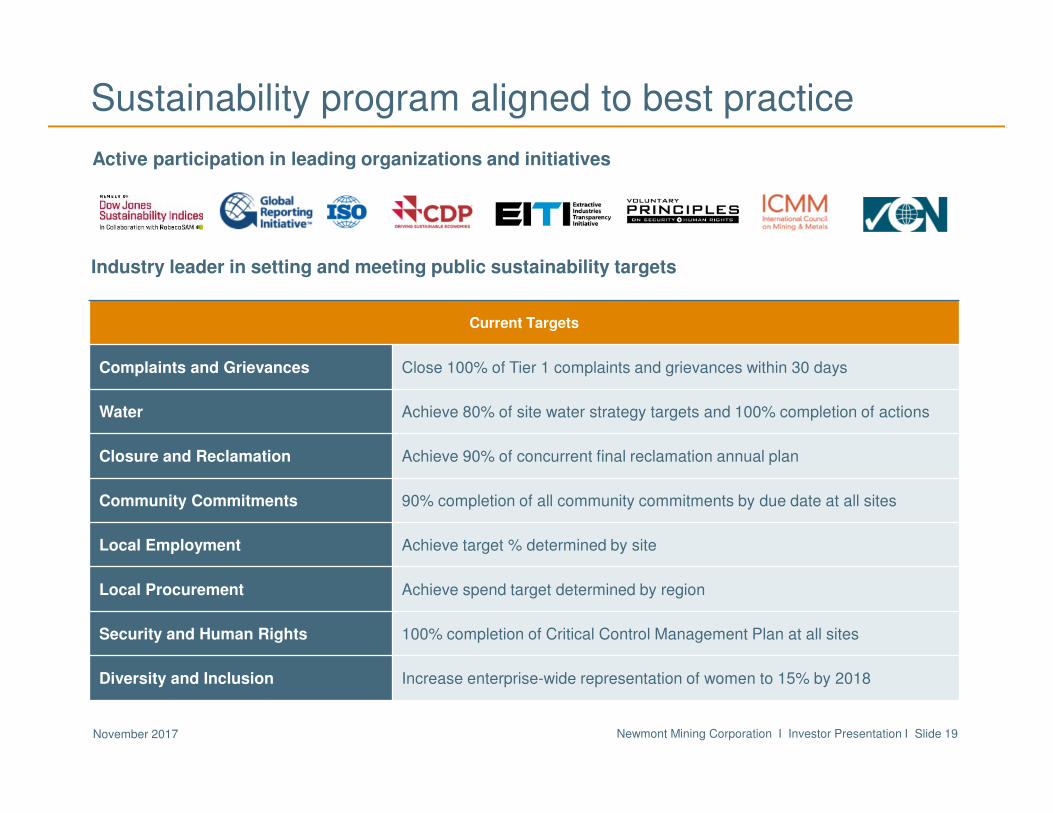
Sustainability program aligned to best practice
Active participation in leading organizations and initiatives
Industry leader in setting and meeting public sustainability targets
Current Targets
Complaints and Grievances Close 100% of Tier 1 complaints and grievances within 30 days
Water Achieve 80% of site water strategy targets and 100% completion of actions
Closure and Reclamation Achieve 90% of concurrent final reclamation annual plan
Community Commitments 90% completion of all community commitments by due date at all sites
Local Employment Achieve target % determined by site
Local Procurement Achieve spend target determined by region
Security and Human Rights 100% completion of Critical Control Management Plan at all sites
Diversity and Inclusion Increase enterprise-wide representation of women to 15% by 2018
Newmont Mining Corporation I Investor Presentation I Slide 20November 2017
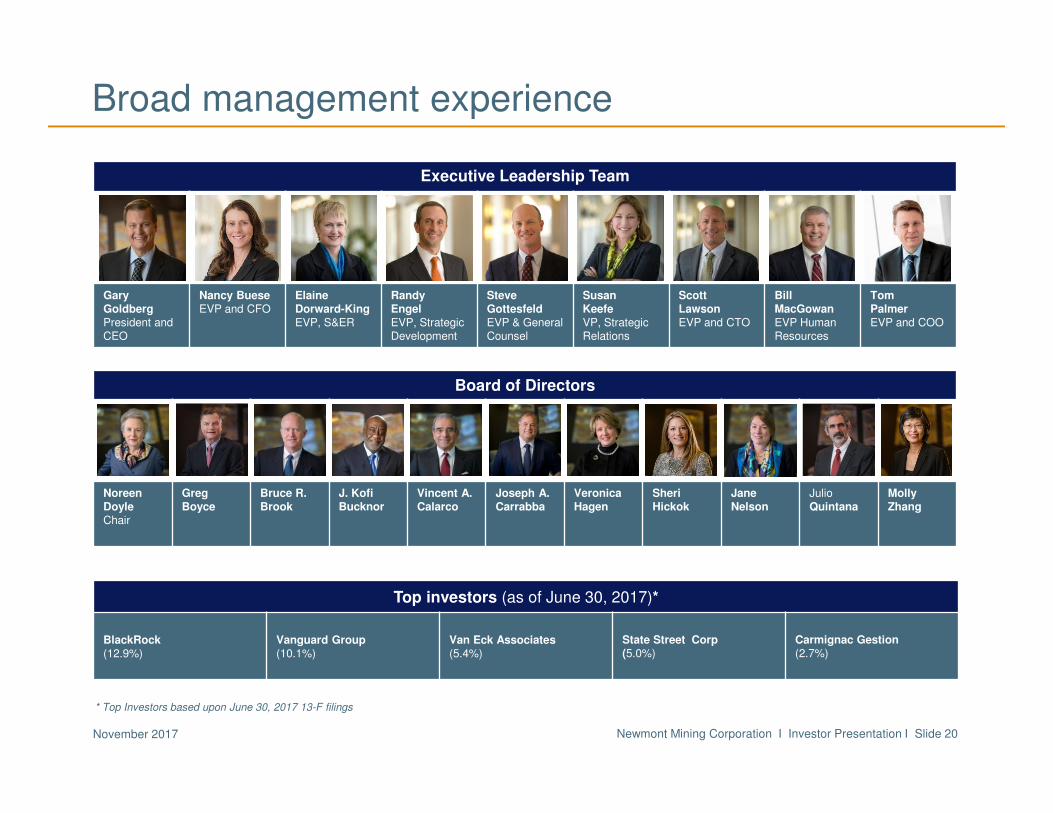
Executive Leadership Team
Gary GoldbergPresident and CEO
Nancy BueseEVP and CFO
Elaine Dorward-KingEVP, S&ER
Randy EngelEVP, Strategic Development
Steve GottesfeldEVP & General Counsel
Susan KeefeVP, Strategic Relations
Scott LawsonEVP and CTO
Bill MacGowanEVP Human Resources
TomPalmerEVP and COO
Broad management experience
Board of Directors
Noreen DoyleChair
Greg Boyce
Bruce R. Brook
J. Kofi Bucknor
Vincent A.Calarco
Joseph A.Carrabba
Veronica Hagen
SheriHickok
Jane Nelson
JulioQuintana
MollyZhang
Top investors (as of June 30, 2017)*
BlackRock(12.9%)
Vanguard Group(10.1%)
Van Eck Associates(5.4%)
State Street Corp(5.0%)
Carmignac Gestion(2.7%)
* Top Investors based upon June 30, 2017 13-F filings
Newmont Mining Corporation I Investor Presentation I Slide 21November 2017
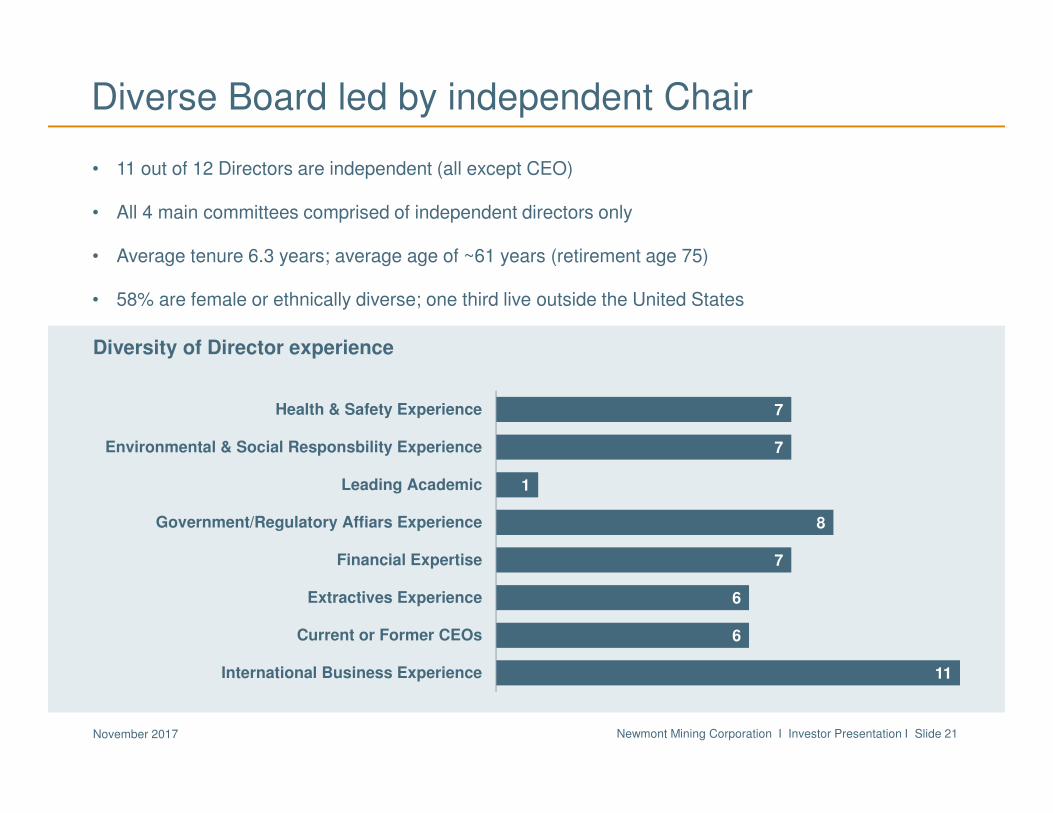
• 11 out of 12 Directors are independent (all except CEO)
• All 4 main committees comprised of independent directors only
• Average tenure 6.3 years; average age of ~61 years (retirement age 75)
• 58% are female or ethnically diverse; one third live outside the United States
Diverse Board led by independent Chair
Diversity of Director experience
11
6
6
7
8
1
7
7
International Business Experience
Current or Former CEOs
Extractives Experience
Financial Expertise
Government/Regulatory Affiars Experience
Leading Academic
Environmental & Social Responsbility Experience
Health & Safety Experience
Newmont Mining Corporation I Investor Presentation I Slide 22November 2017
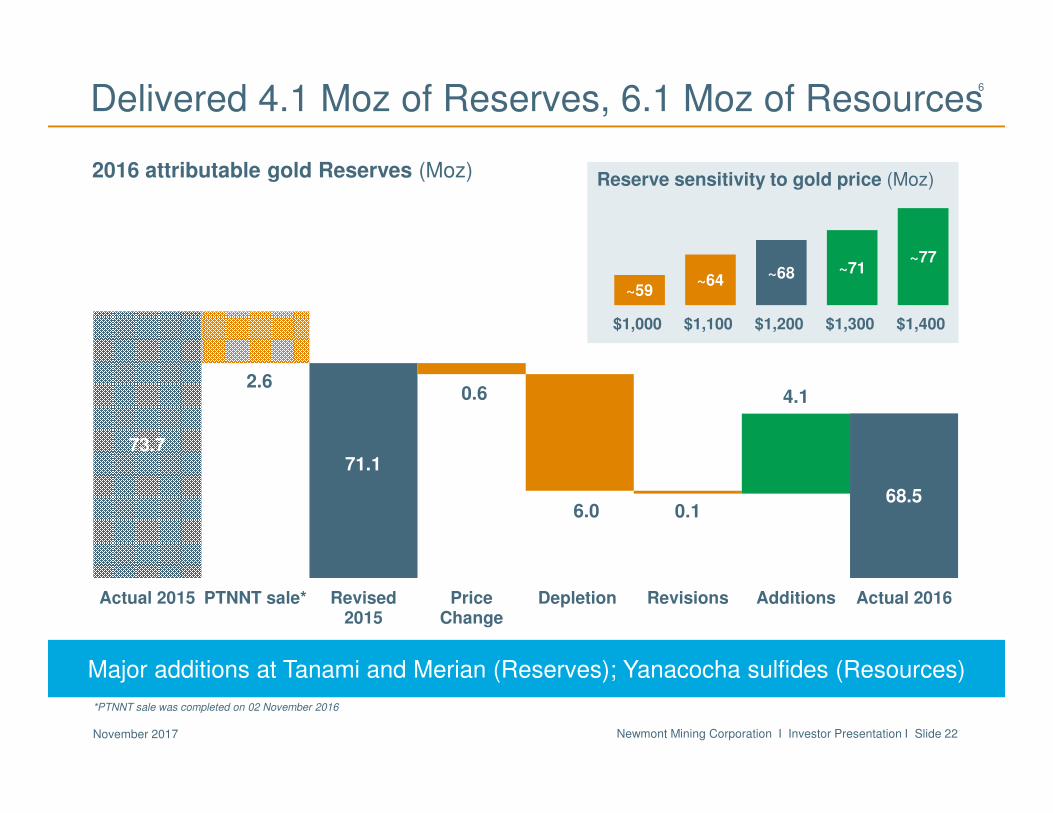
73.7
2.6
71.1
0.6
6.0 0.1
4.1
68.5
Actual 2015 PTNNT sale* Revised2015
PriceChange
Depletion Revisions Additions Actual 2016
Delivered 4.1 Moz of Reserves, 6.1 Moz of Resources
2016 attributable gold Reserves (Moz)
Major additions at Tanami and Merian (Reserves); Yanacocha sulfides (Resources)
*PTNNT sale was completed on 02 November 2016
~59~64 ~68 ~71
~77
$1,000 $1,100 $1,200 $1,300 $1,400
Reserve sensitivity to gold price (Moz)
6
Newmont Mining Corporation I Investor Presentation I Slide 23November 2017
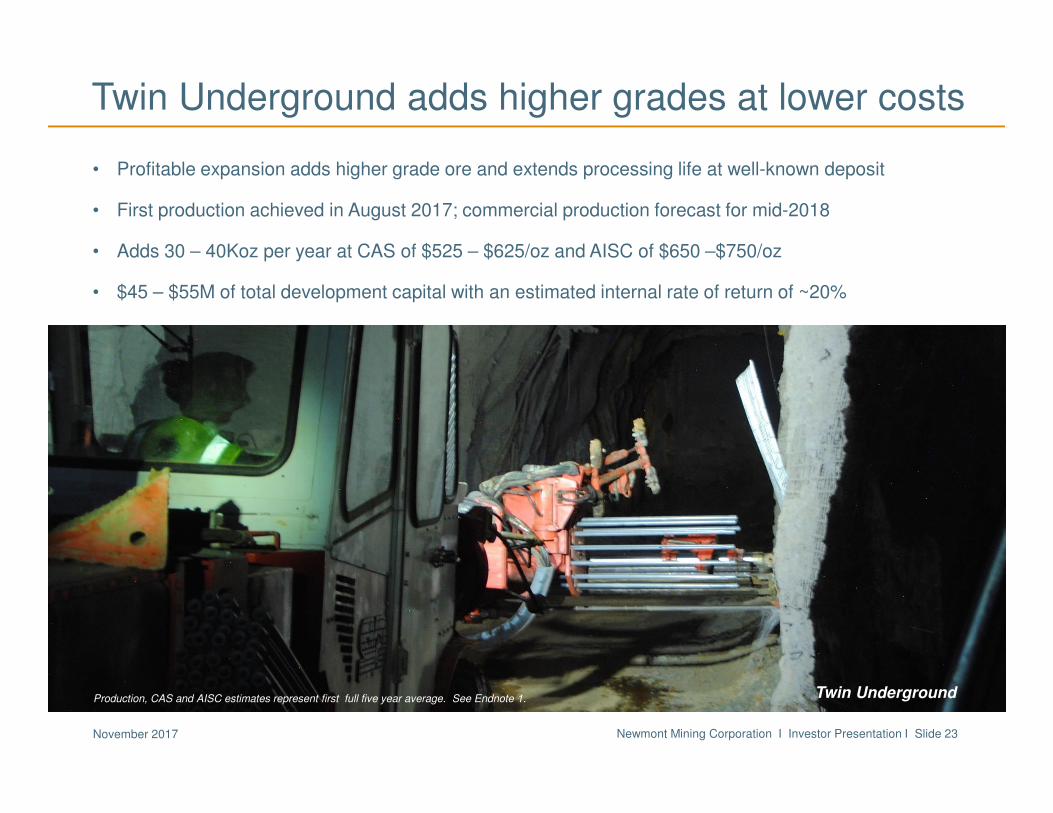
Twin Underground adds higher grades at lower costs
• Profitable expansion adds higher grade ore and extends processing life at well-known deposit
• First production achieved in August 2017; commercial production forecast for mid-2018
• Adds 30 – 40Koz per year at CAS of $525 – $625/oz and AISC of $650 –$750/oz
• $45 – $55M of total development capital with an estimated internal rate of return of ~20%
Twin UndergroundProduction, CAS and AISC estimates represent first full five year average. See Endnote 1.
Newmont Mining Corporation I Investor Presentation I Slide 24November 2017
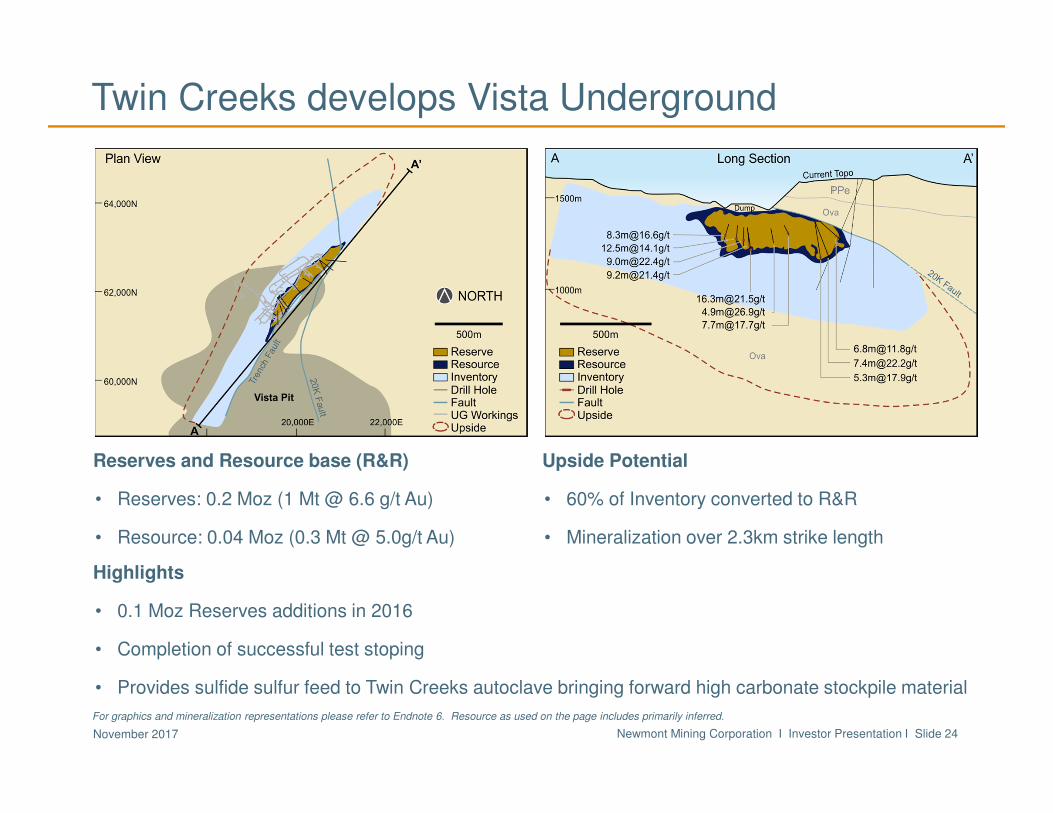
Reserves and Resource base (R&R)
• Reserves: 0.2 Moz (1 Mt @ 6.6 g/t Au)
• Resource: 0.04 Moz (0.3 Mt @ 5.0g/t Au)
Upside Potential
• 60% of Inventory converted to R&R
• Mineralization over 2.3km strike length
Highlights
• 0.1 Moz Reserves additions in 2016
• Completion of successful test stoping
• Provides sulfide sulfur feed to Twin Creeks autoclave bringing forward high carbonate stockpile material
For graphics and mineralization representations please refer to Endnote 6. Resource as used on the page includes primarily inferred.
Twin Creeks develops Vista Underground
Newmont Mining Corporation I Investor Presentation I Slide 25November 2017
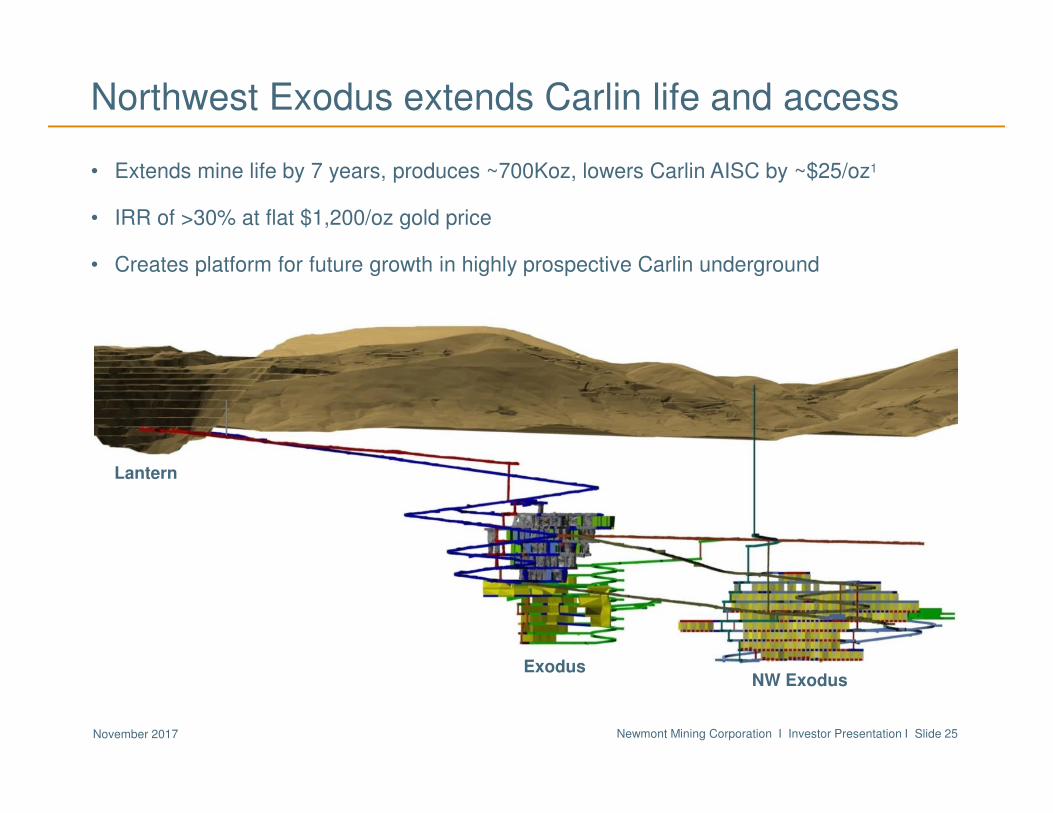
Northwest Exodus extends Carlin life and access
• Extends mine life by 7 years, produces ~700Koz, lowers Carlin AISC by ~$25/oz1
• IRR of >30% at flat $1,200/oz gold price
• Creates platform for future growth in highly prospective Carlin underground
Lantern
ExodusNW Exodus
Newmont Mining Corporation I Investor Presentation I Slide 26November 2017
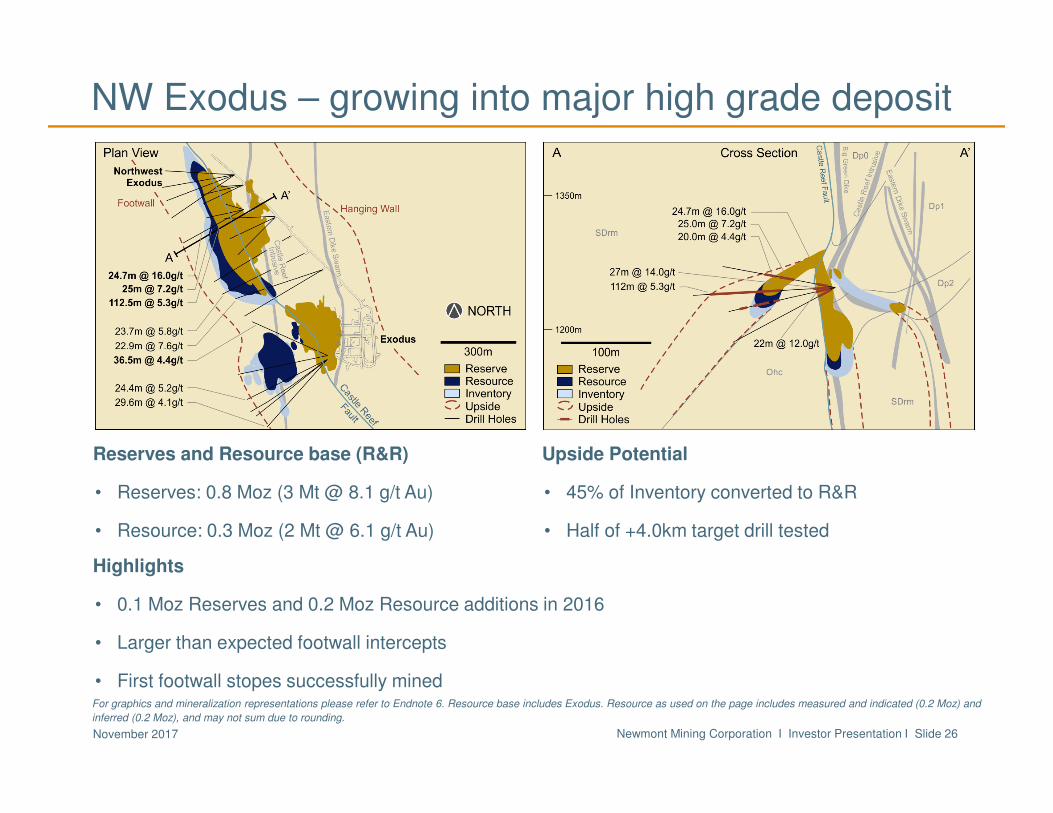
Reserves and Resource base (R&R)
• Reserves: 0.8 Moz (3 Mt @ 8.1 g/t Au)
• Resource: 0.3 Moz (2 Mt @ 6.1 g/t Au)
Upside Potential
• 45% of Inventory converted to R&R
• Half of +4.0km target drill tested
Highlights
• 0.1 Moz Reserves and 0.2 Moz Resource additions in 2016
• Larger than expected footwall intercepts
• First footwall stopes successfully minedFor graphics and mineralization representations please refer to Endnote 6. Resource base includes Exodus. Resource as used on the page includes measured and indicated (0.2 Moz) and
inferred (0.2 Moz), and may not sum due to rounding.
NW Exodus – growing into major high grade deposit
Newmont Mining Corporation I Investor Presentation I Slide 27November 2017
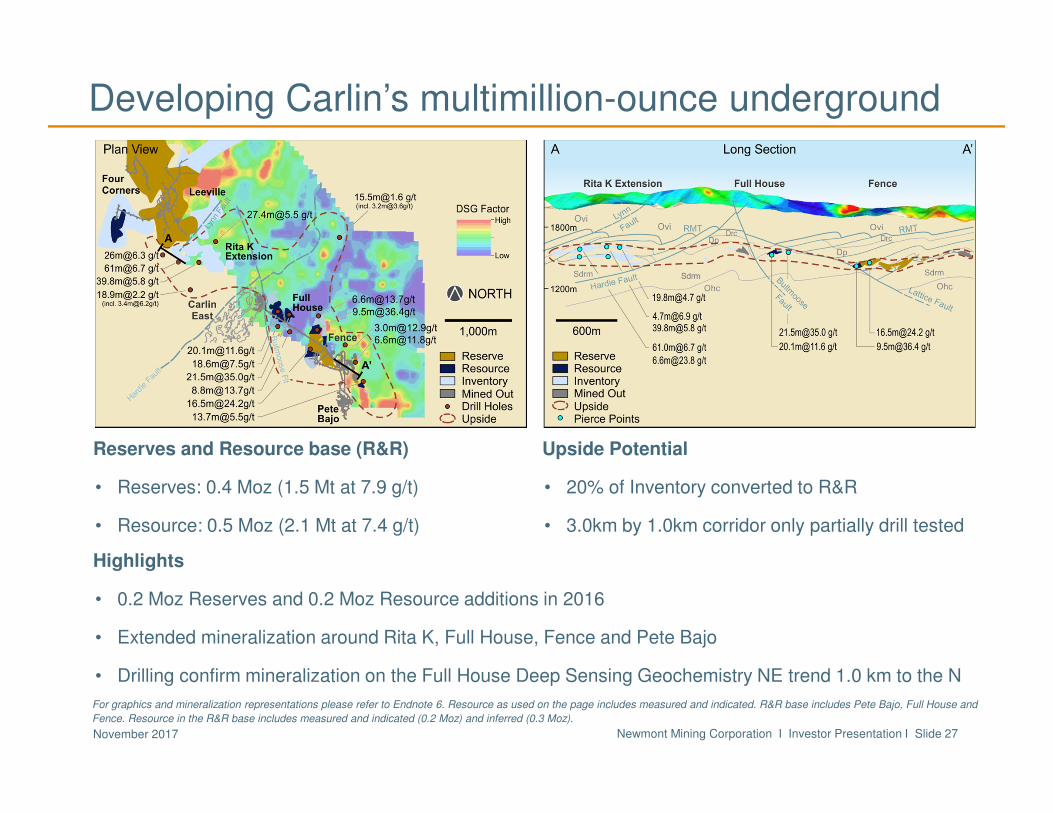
Reserves and Resource base (R&R)
• Reserves: 0.4 Moz (1.5 Mt at 7.9 g/t)
• Resource: 0.5 Moz (2.1 Mt at 7.4 g/t)
Upside Potential
• 20% of Inventory converted to R&R
• 3.0km by 1.0km corridor only partially drill tested
Highlights
• 0.2 Moz Reserves and 0.2 Moz Resource additions in 2016
• Extended mineralization around Rita K, Full House, Fence and Pete Bajo
• Drilling confirm mineralization on the Full House Deep Sensing Geochemistry NE trend 1.0 km to the N
For graphics and mineralization representations please refer to Endnote 6. Resource as used on the page includes measured and indicated. R&R base includes Pete Bajo, Full House and
Fence. Resource in the R&R base includes measured and indicated (0.2 Moz) and inferred (0.3 Moz).
Developing Carlin’s multimillion-ounce underground
Newmont Mining Corporation I Investor Presentation I Slide 28November 2017
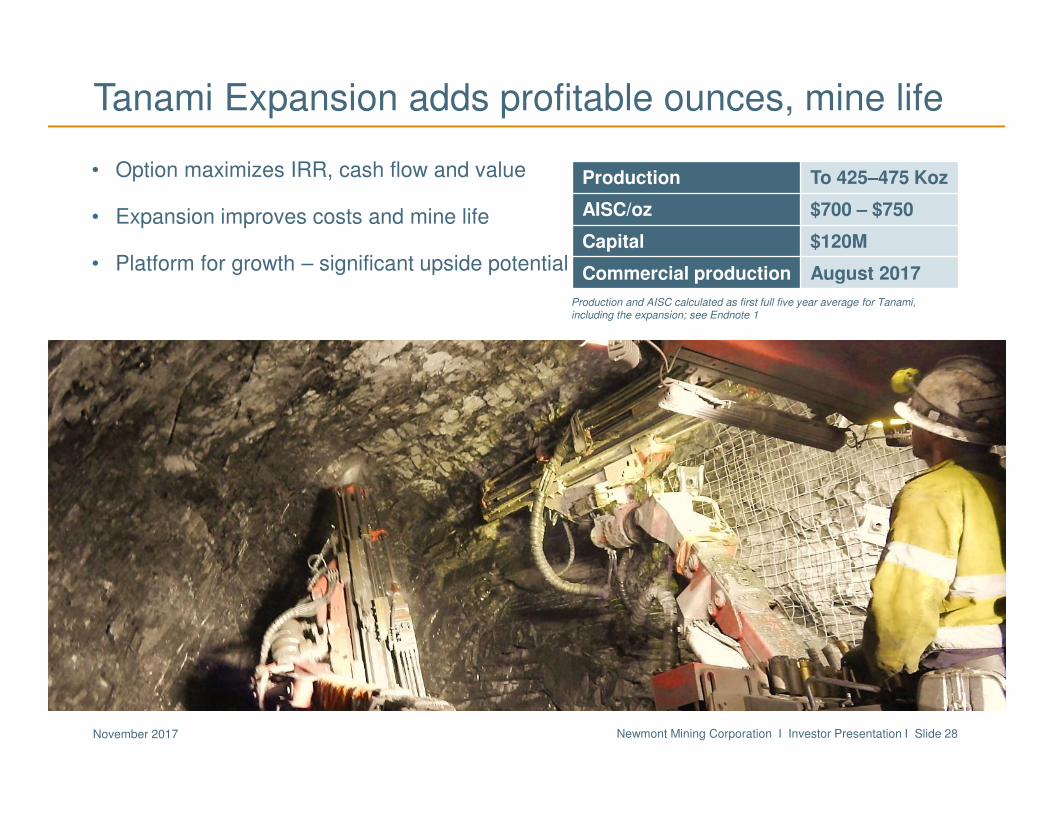
• Option maximizes IRR, cash flow and value
• Expansion improves costs and mine life
• Platform for growth – significant upside potential
Tanami Expansion adds profitable ounces, mine life
Cripple Creek & Victor
Production To 425–475 Koz
AISC/oz $700 – $750
Capital $120M
Commercial production August 2017
Production and AISC calculated as first full five year average for Tanami, including the expansion; see Endnote 1
Newmont Mining Corporation I Investor Presentation I Slide 29November 2017
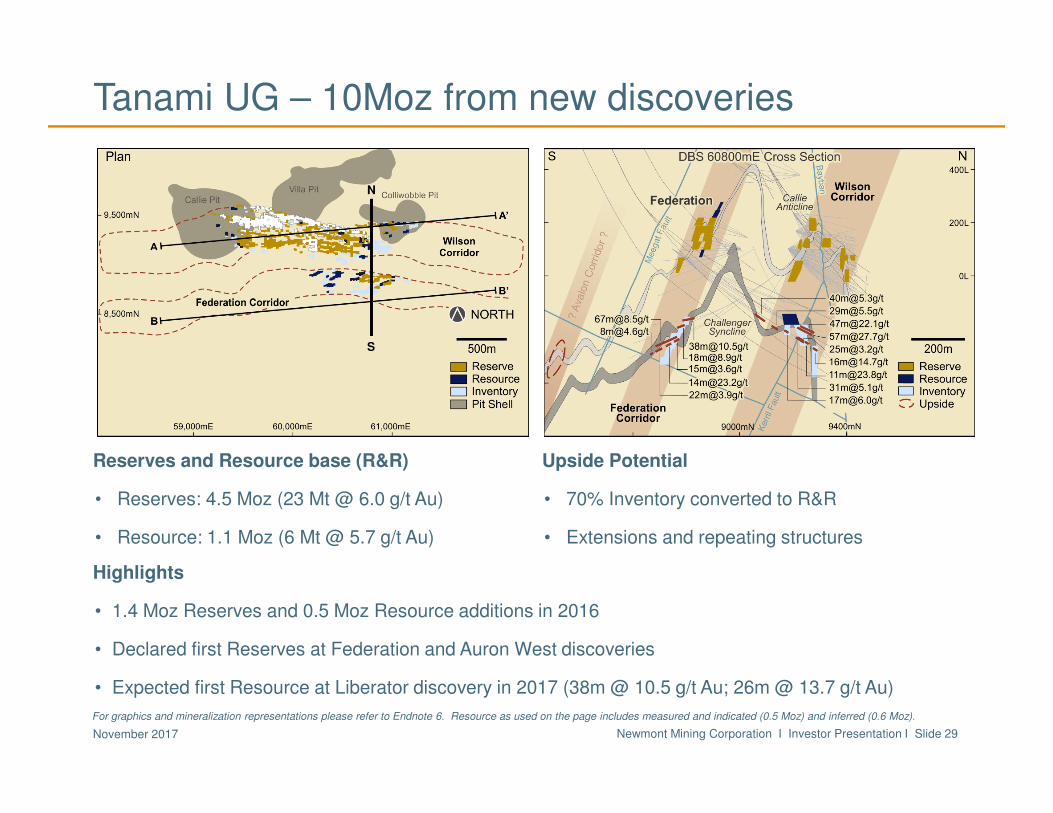
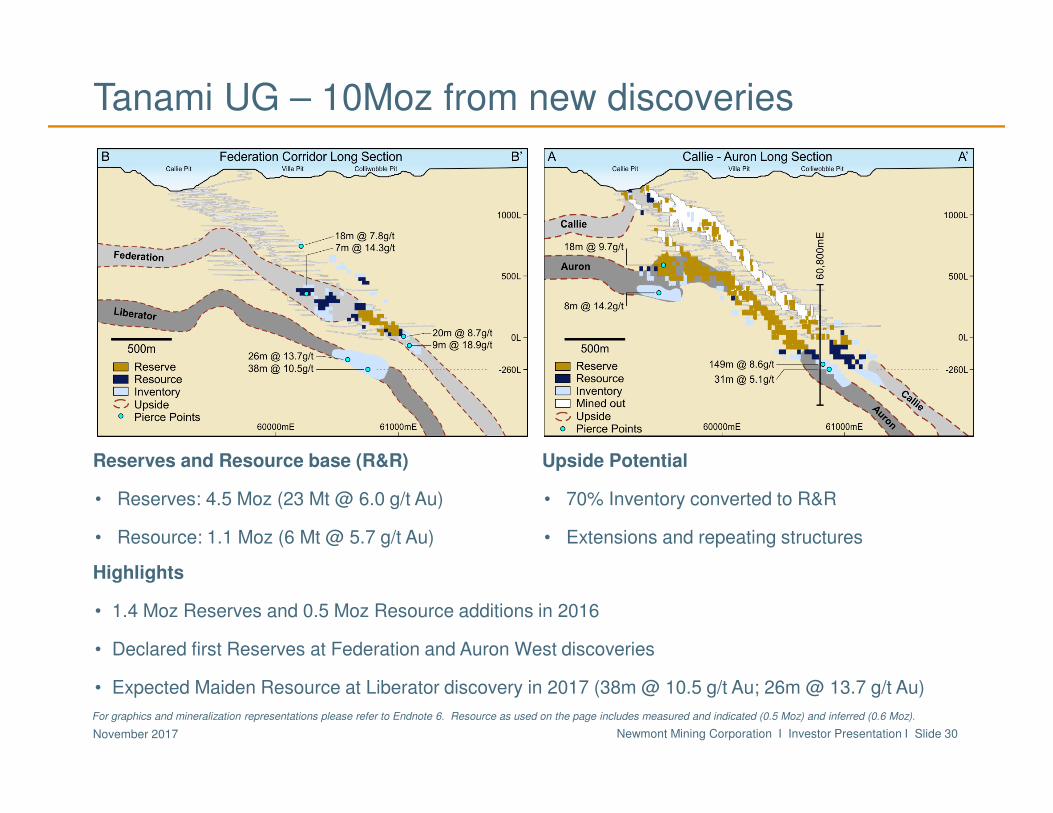
Reserves and Resource base (R&R)
• Reserves: 4.5 Moz (23 Mt @ 6.0 g/t Au)
• Resource: 1.1 Moz (6 Mt @ 5.7 g/t Au)
Upside Potential
• 70% Inventory converted to R&R
• Extensions and repeating structures
Highlights
• 1.4 Moz Reserves and 0.5 Moz Resource additions in 2016
• Declared first Reserves at Federation and Auron West discoveries
• Expected first Resource at Liberator discovery in 2017 (38m @ 10.5 g/t Au; 26m @ 13.7 g/t Au)
For graphics and mineralization representations please refer to Endnote 6. Resource as used on the page includes measured and indicated (0.5 Moz) and inferred (0.6 Moz).
Tanami UG – 10Moz from new discoveries
S
N
Newmont Mining Corporation I Investor Presentation I Slide 30November 2017
For graphics and mineralization representations please refer to Endnote 6. Resource as used on the page includes measured and indicated (0.5 Moz) and inferred (0.6 Moz).
Reserves and Resource base (R&R)
• Reserves: 4.5 Moz (23 Mt @ 6.0 g/t Au)
• Resource: 1.1 Moz (6 Mt @ 5.7 g/t Au)
Upside Potential
• 70% Inventory converted to R&R
• Extensions and repeating structures
Highlights
• 1.4 Moz Reserves and 0.5 Moz Resource additions in 2016
• Declared first Reserves at Federation and Auron West discoveries
• Expected Maiden Resource at Liberator discovery in 2017 (38m @ 10.5 g/t Au; 26m @ 13.7 g/t Au)
Tanami UG – 10Moz from new discoveries
Newmont Mining Corporation I Investor Presentation I Slide 31November 2017
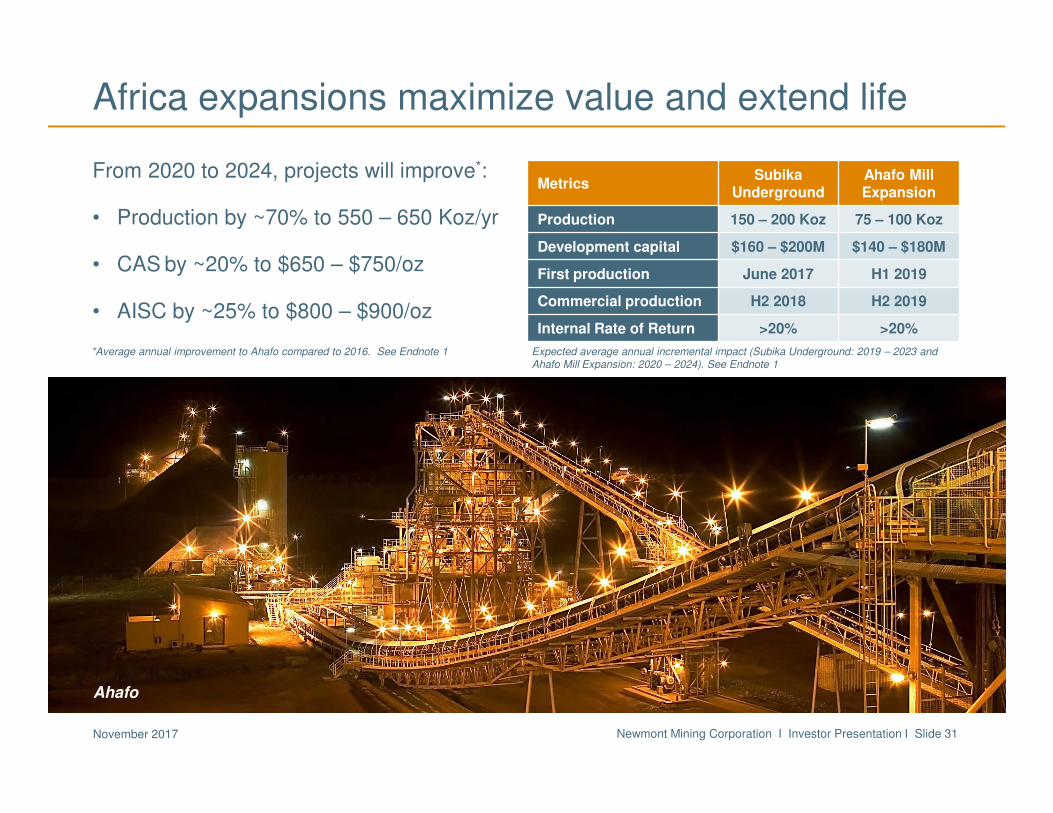
Africa expansions maximize value and extend life
MetricsSubika
UndergroundAhafo Mill Expansion
Production 150 – 200 Koz 75 – 100 Koz
Development capital $160 – $200M $140 – $180M
First production June 2017 H1 2019
Commercial production H2 2018 H2 2019
Internal Rate of Return >20% >20%
Expected average for first five years of production.
From 2020 to 2024, projects will improve*:
• Production by ~70% to 550 – 650 Koz/yr
• CAS by ~20% to $650 – $750/oz
• AISC by ~25% to $800 – $900/oz
*Average annual improvement to Ahafo compared to 2016. See Endnote 1 Expected average annual incremental impact (Subika Underground: 2019 – 2023 and Ahafo Mill Expansion: 2020 – 2024). See Endnote 1
Ahafo
Newmont Mining Corporation I Investor Presentation I Slide 32November 2017
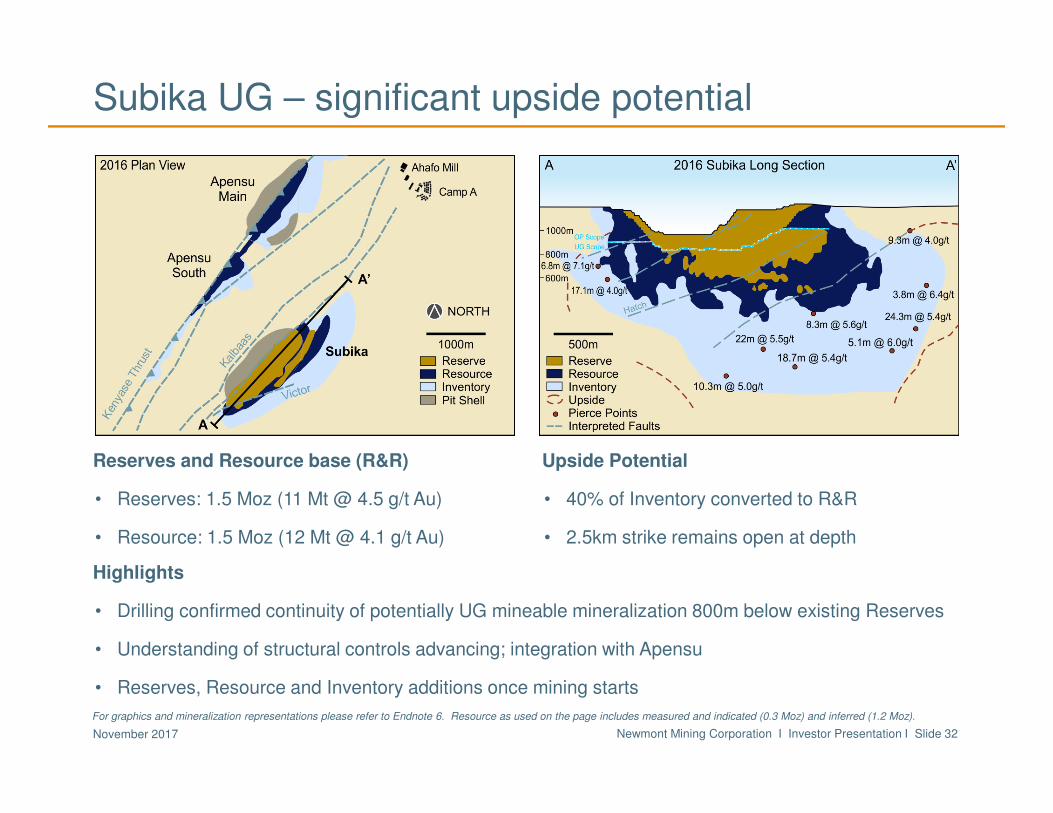
Subika UG – significant upside potential
Reserves and Resource base (R&R)
• Reserves: 1.5 Moz (11 Mt @ 4.5 g/t Au)
• Resource: 1.5 Moz (12 Mt @ 4.1 g/t Au)
Upside Potential
• 40% of Inventory converted to R&R
• 2.5km strike remains open at depth
Highlights
• Drilling confirmed continuity of potentially UG mineable mineralization 800m below existing Reserves
• Understanding of structural controls advancing; integration with Apensu
• Reserves, Resource and Inventory additions once mining starts
For graphics and mineralization representations please refer to Endnote 6. Resource as used on the page includes measured and indicated (0.3 Moz) and inferred (1.2 Moz).
Newmont Mining Corporation I Investor Presentation I Slide 33November 2017
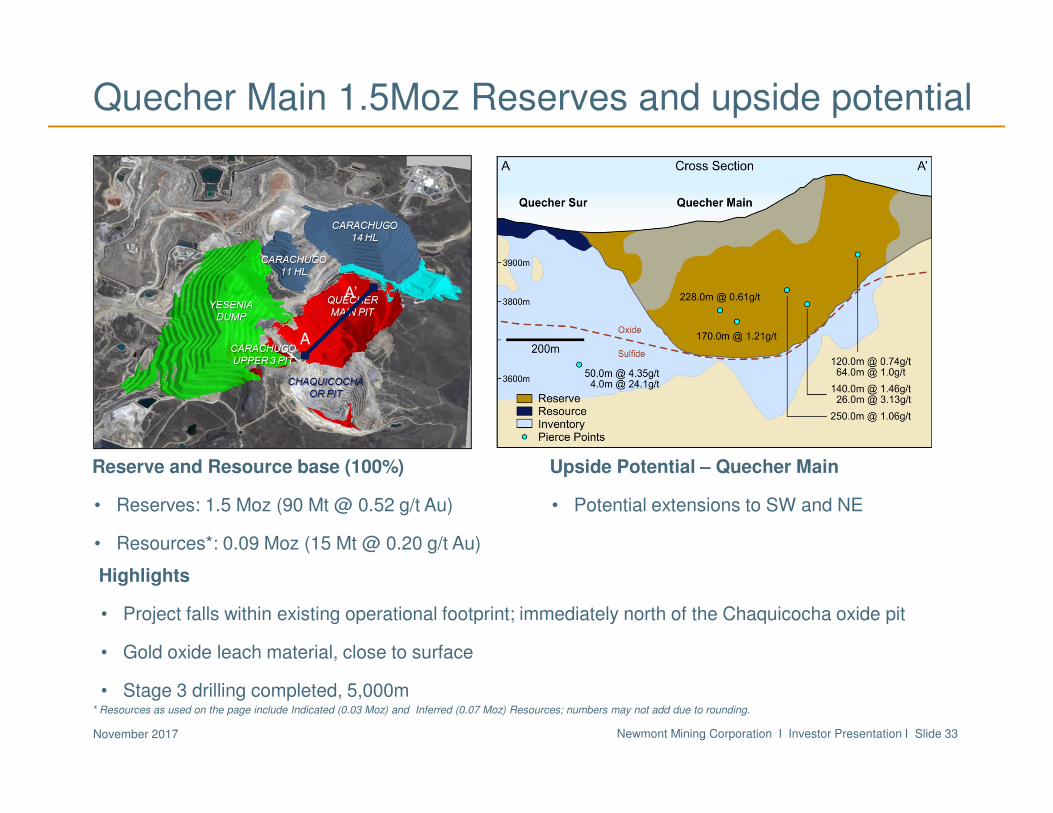
Quecher Main 1.5Moz Reserves and upside potential
Reserve and Resource base (100%)
• Reserves: 1.5 Moz (90 Mt @ 0.52 g/t Au)
• Resources*: 0.09 Moz (15 Mt @ 0.20 g/t Au)
Upside Potential – Quecher Main
• Potential extensions to SW and NE
Highlights
• Project falls within existing operational footprint; immediately north of the Chaquicocha oxide pit
• Gold oxide leach material, close to surface
• Stage 3 drilling completed, 5,000m* Resources as used on the page include Indicated (0.03 Moz) and Inferred (0.07 Moz) Resources; numbers may not add due to rounding.
A
A’
Newmont Mining Corporation I Investor Presentation I Slide 34November 2017
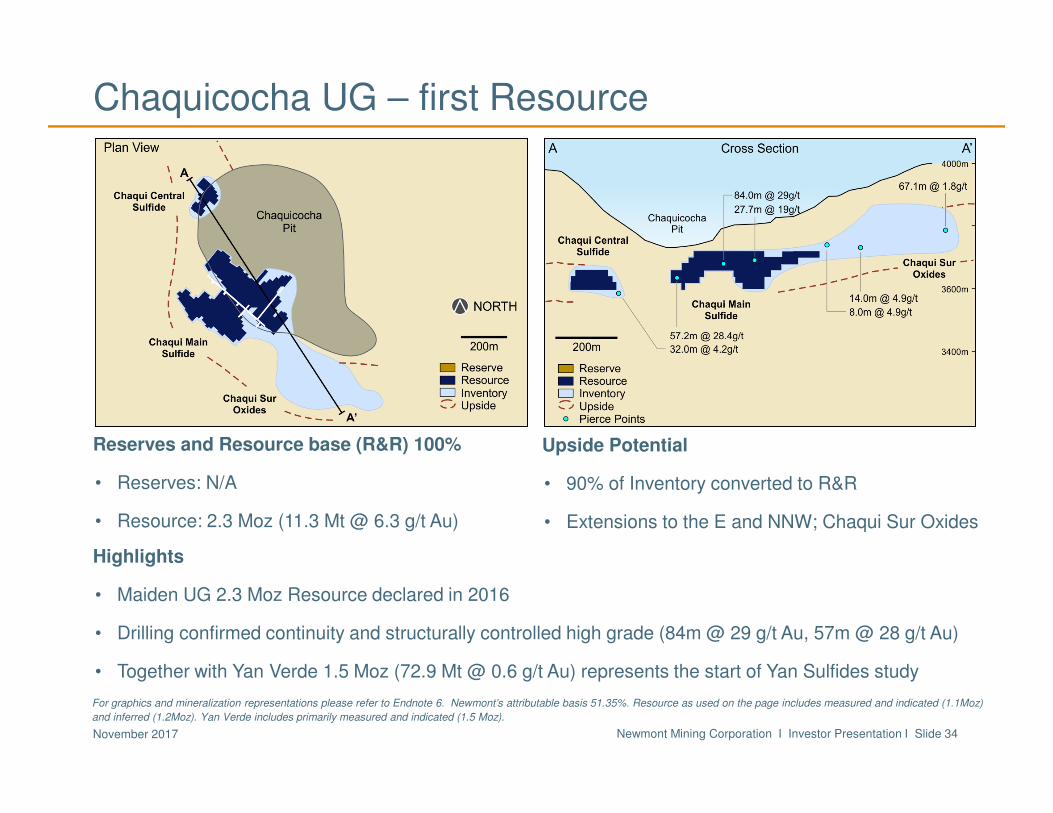
Chaquicocha UG – first Resource
Reserves and Resource base (R&R) 100%
• Reserves: N/A
• Resource: 2.3 Moz (11.3 Mt @ 6.3 g/t Au)
Upside Potential
• 90% of Inventory converted to R&R
• Extensions to the E and NNW; Chaqui Sur Oxides
Highlights
• Maiden UG 2.3 Moz Resource declared in 2016
• Drilling confirmed continuity and structurally controlled high grade (84m @ 29 g/t Au, 57m @ 28 g/t Au)
• Together with Yan Verde 1.5 Moz (72.9 Mt @ 0.6 g/t Au) represents the start of Yan Sulfides study
For graphics and mineralization representations please refer to Endnote 6. Newmont’s attributable basis 51.35%. Resource as used on the page includes measured and indicated (1.1Moz)
and inferred (1.2Moz). Yan Verde includes primarily measured and indicated (1.5 Moz).
Newmont Mining Corporation I Investor Presentation I Slide 35November 2017
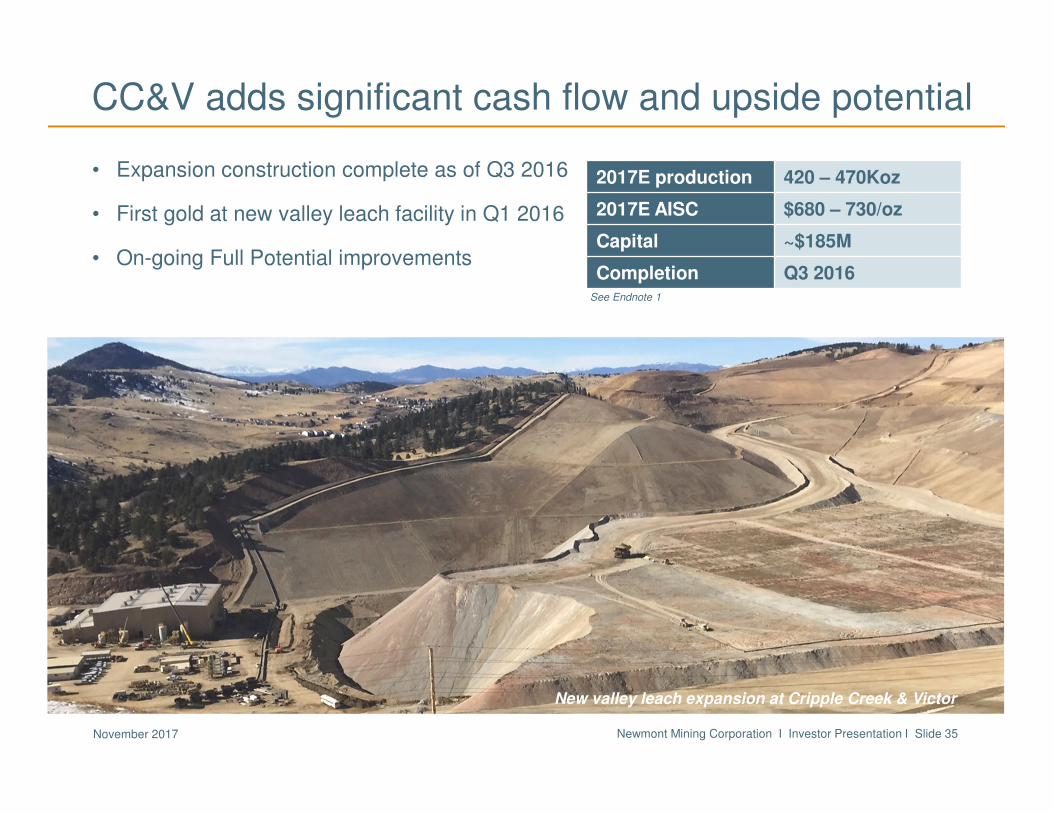
CC&V adds significant cash flow and upside potential
• Expansion construction complete as of Q3 2016
• First gold at new valley leach facility in Q1 2016
• On-going Full Potential improvements
New valley leach expansion at Cripple Creek & Victor
2017E production 420 – 470Koz
2017E AISC $680 – 730/oz
Capital ~$185M
Completion Q3 2016See Endnote 1
Newmont Mining Corporation I Investor Presentation I Slide 36November 2017
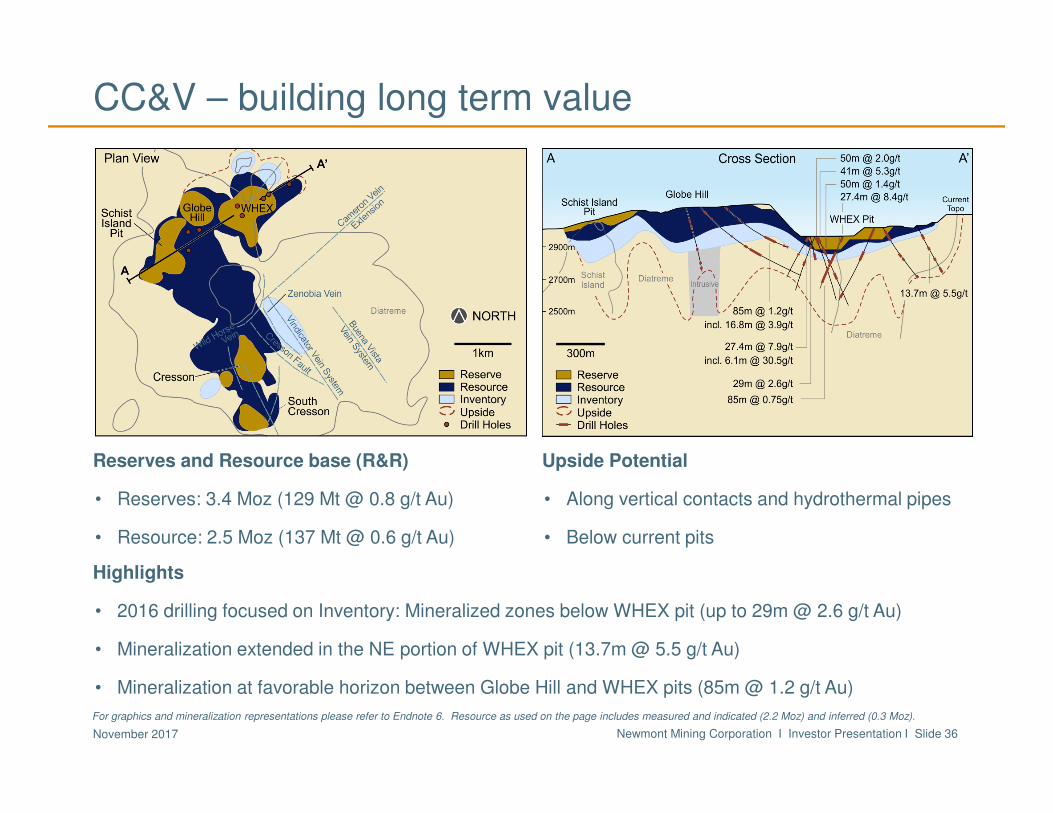
CC&V – building long term value
Reserves and Resource base (R&R)
• Reserves: 3.4 Moz (129 Mt @ 0.8 g/t Au)
• Resource: 2.5 Moz (137 Mt @ 0.6 g/t Au)
Upside Potential
• Along vertical contacts and hydrothermal pipes
• Below current pits
Highlights
• 2016 drilling focused on Inventory: Mineralized zones below WHEX pit (up to 29m @ 2.6 g/t Au)
• Mineralization extended in the NE portion of WHEX pit (13.7m @ 5.5 g/t Au)
• Mineralization at favorable horizon between Globe Hill and WHEX pits (85m @ 1.2 g/t Au)
For graphics and mineralization representations please refer to Endnote 6. Resource as used on the page includes measured and indicated (2.2 Moz) and inferred (0.3 Moz).
Newmont Mining Corporation I Investor Presentation I Slide 37November 2017
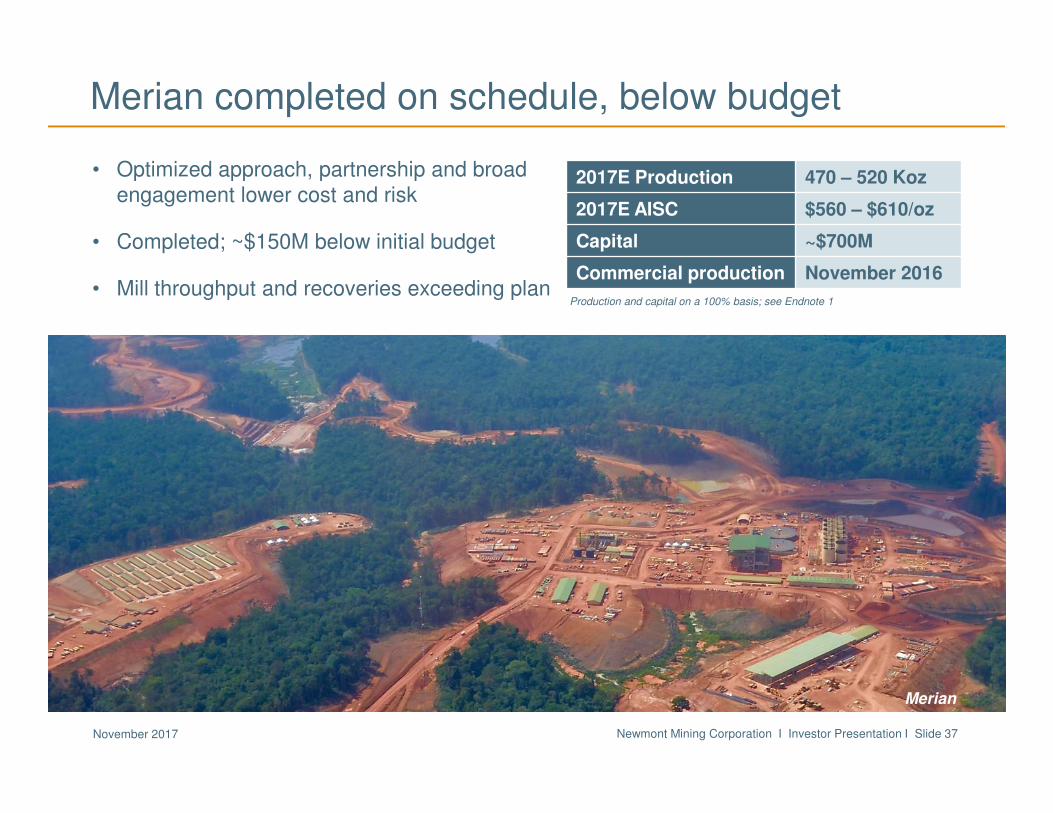
Merian completed on schedule, below budget
• Optimized approach, partnership and broad engagement lower cost and risk
• Completed; ~$150M below initial budget
• Mill throughput and recoveries exceeding planProduction and capital on a 100% basis; see Endnote 1
2017E Production 470 – 520 Koz
2017E AISC $560 – $610/oz
Capital ~$700M
Commercial production November 2016
Merian
Newmont Mining Corporation I Investor Presentation I Slide 38November 2017
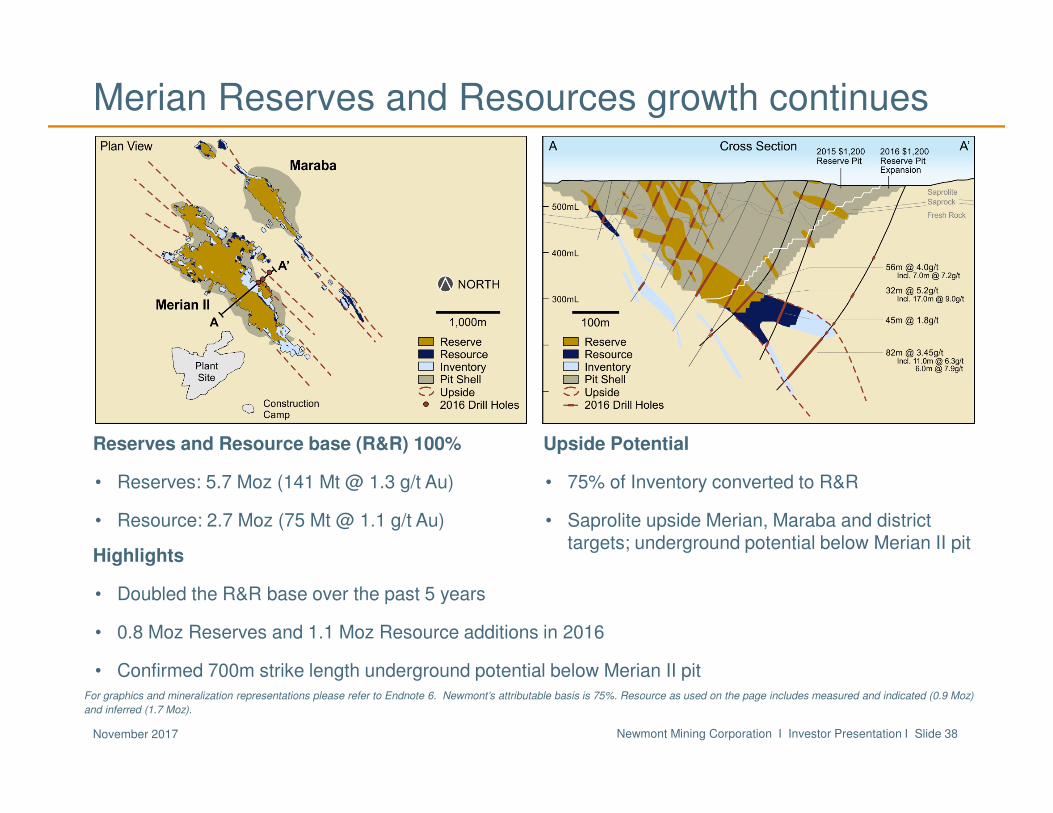
Merian Reserves and Resources growth continues
Reserves and Resource base (R&R) 100%
• Reserves: 5.7 Moz (141 Mt @ 1.3 g/t Au)
• Resource: 2.7 Moz (75 Mt @ 1.1 g/t Au)
Upside Potential
• 75% of Inventory converted to R&R
• Saprolite upside Merian, Maraba and district targets; underground potential below Merian II pit
Highlights
• Doubled the R&R base over the past 5 years
• 0.8 Moz Reserves and 1.1 Moz Resource additions in 2016
• Confirmed 700m strike length underground potential below Merian II pitFor graphics and mineralization representations please refer to Endnote 6. Newmont’s attributable basis is 75%. Resource as used on the page includes measured and indicated (0.9 Moz)
and inferred (1.7 Moz).
Newmont Mining Corporation I Investor Presentation I Slide 39November 2017
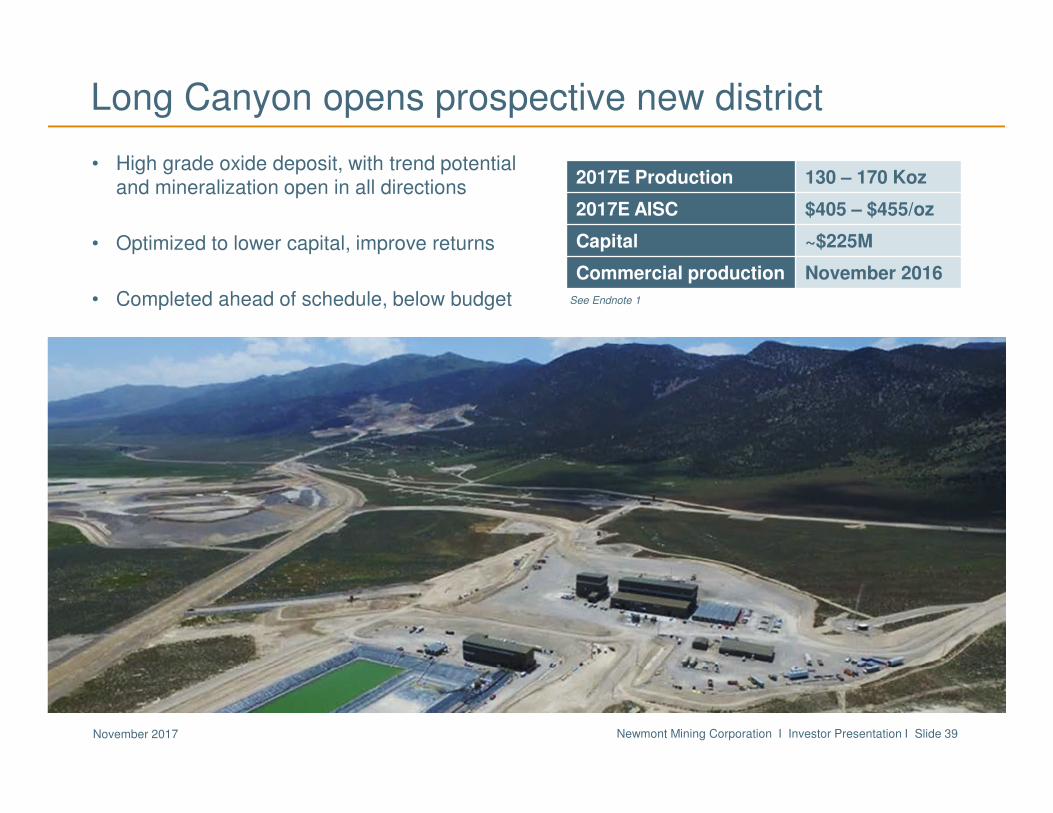
Long Canyon opens prospective new district
• High grade oxide deposit, with trend potential and mineralization open in all directions
• Optimized to lower capital, improve returns
• Completed ahead of schedule, below budget
Mining at Long Canyon
See Endnote 1
2017E Production 130 – 170 Koz
2017E AISC $405 – $455/oz
Capital ~$225M
Commercial production November 2016
Newmont Mining Corporation I Investor Presentation I Slide 40November 2017
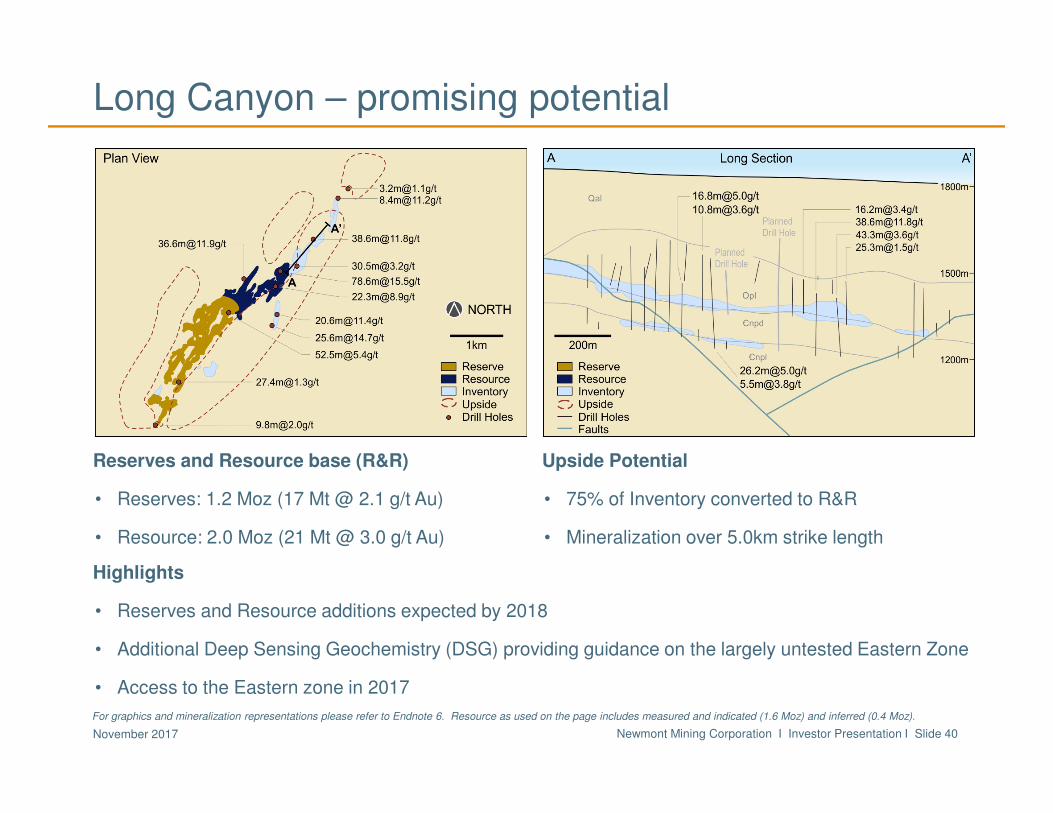
Long Canyon – promising potential
Reserves and Resource base (R&R)
• Reserves: 1.2 Moz (17 Mt @ 2.1 g/t Au)
• Resource: 2.0 Moz (21 Mt @ 3.0 g/t Au)
Upside Potential
• 75% of Inventory converted to R&R
• Mineralization over 5.0km strike length
Highlights
• Reserves and Resource additions expected by 2018
• Additional Deep Sensing Geochemistry (DSG) providing guidance on the largely untested Eastern Zone
• Access to the Eastern zone in 2017
For graphics and mineralization representations please refer to Endnote 6. Resource as used on the page includes measured and indicated (1.6 Moz) and inferred (0.4 Moz).
Newmont Mining Corporation I Investor Presentation I Slide 41November 2017
Merian
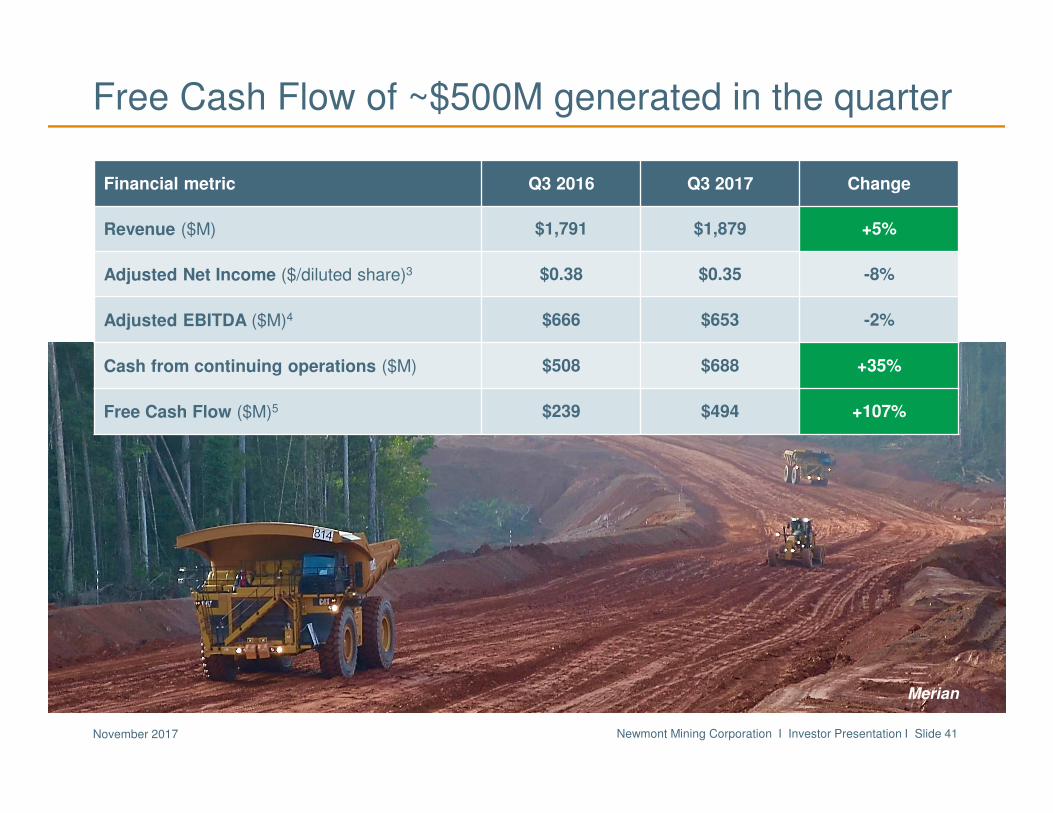
Free Cash Flow of ~$500M generated in the quarter
Financial metric Q3 2016 Q3 2017 Change
Revenue ($M) $1,791 $1,879 +5%
Adjusted Net Income ($/diluted share)3 $0.38 $0.35 -8%
Adjusted EBITDA ($M)4 $666 $653 -2%
Cash from continuing operations ($M) $508 $688 +35%
Free Cash Flow ($M)5 $239 $494 +107%
Newmont Mining Corporation I Investor Presentation I Slide 42November 2017
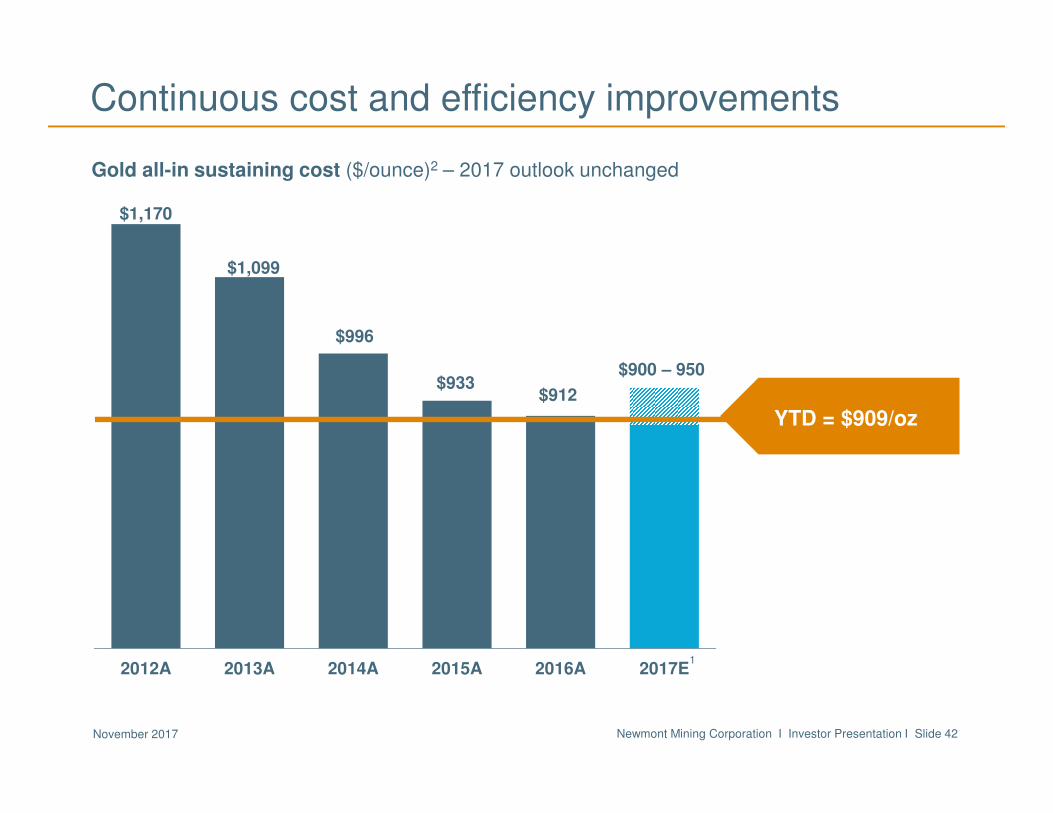
Continuous cost and efficiency improvements
$1,170
$1,099
$996
$933 $912
$900 – 950
2012A 2013A 2014A 2015A 2016A 2017E
Gold all-in sustaining cost ($/ounce)2 – 2017 outlook unchanged
YTD = $909/oz
1
Newmont Mining Corporation I Investor Presentation I Slide 43November 2017
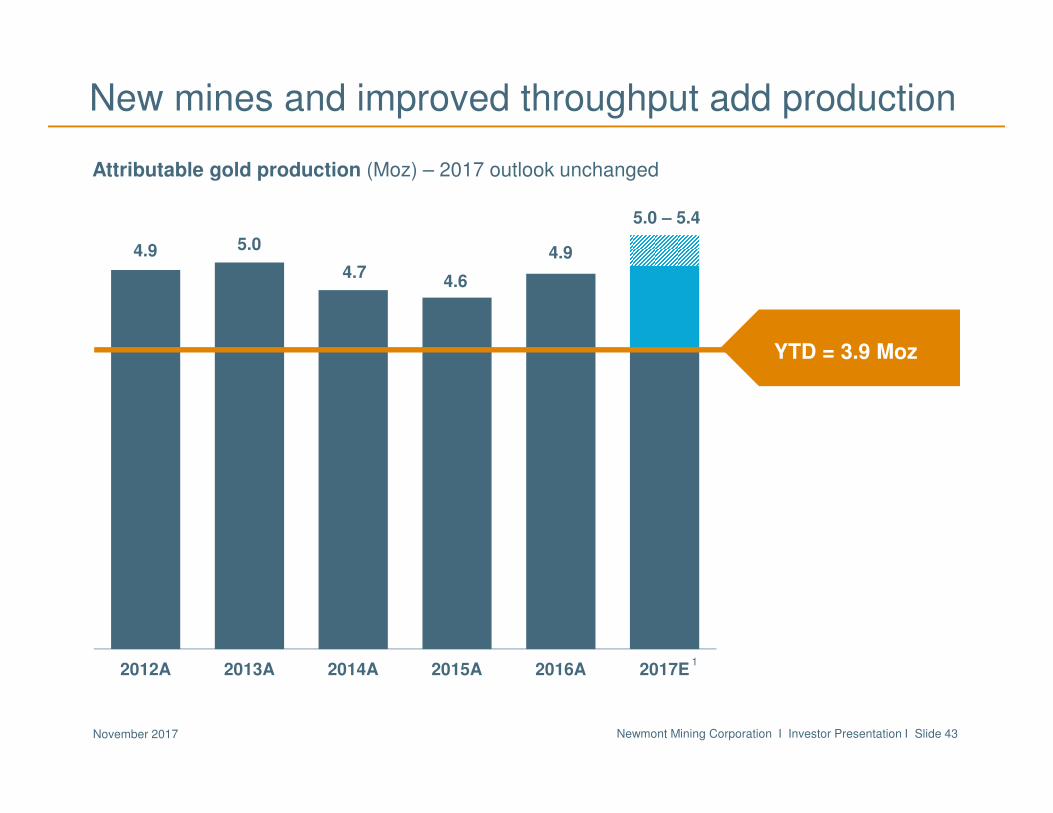
New mines and improved throughput add production
4.9 5.0
4.74.6
4.9
5.0 – 5.4
2012A 2013A 2014A 2015A 2016A 2017E
Attributable gold production (Moz) – 2017 outlook unchanged
1
YTD = 3.9 Moz
Newmont Mining Corporation I Investor Presentation I Slide 44November 2017
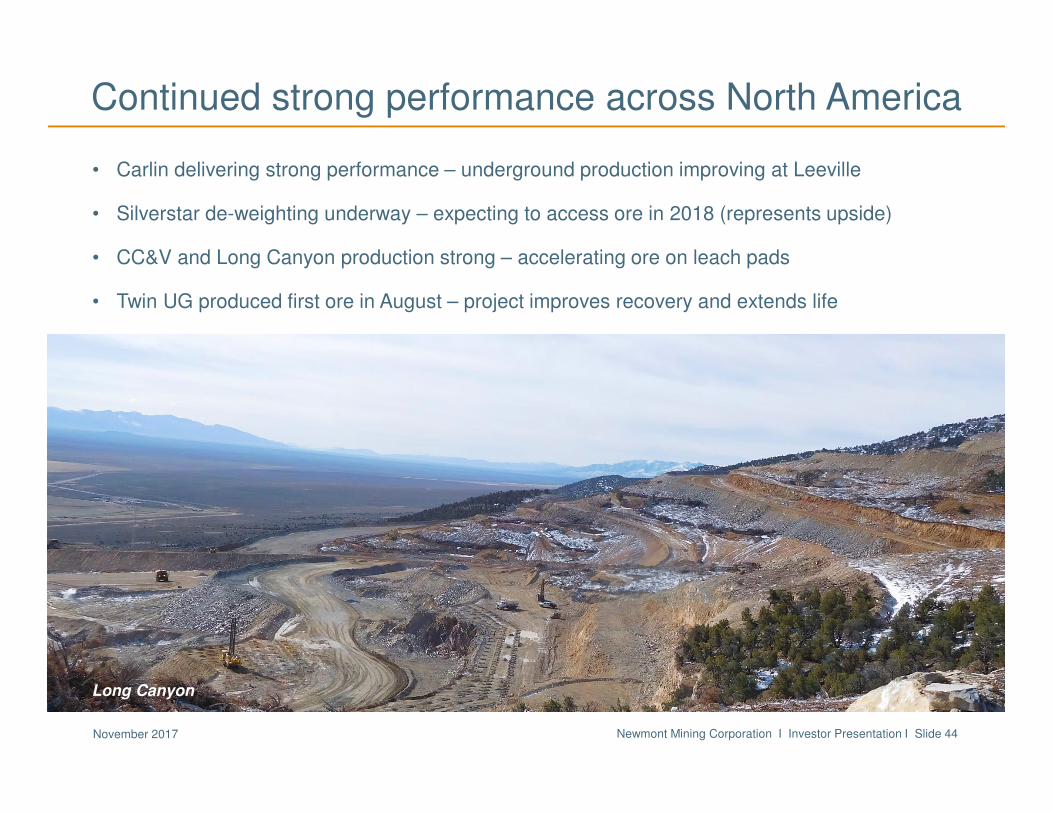
Continued strong performance across North America
• Carlin delivering strong performance – underground production improving at Leeville
• Silverstar de-weighting underway – expecting to access ore in 2018 (represents upside)
• CC&V and Long Canyon production strong – accelerating ore on leach pads
• Twin UG produced first ore in August – project improves recovery and extends life
CC&V valley leachLong Canyon
Newmont Mining Corporation I Investor Presentation I Slide 45November 2017
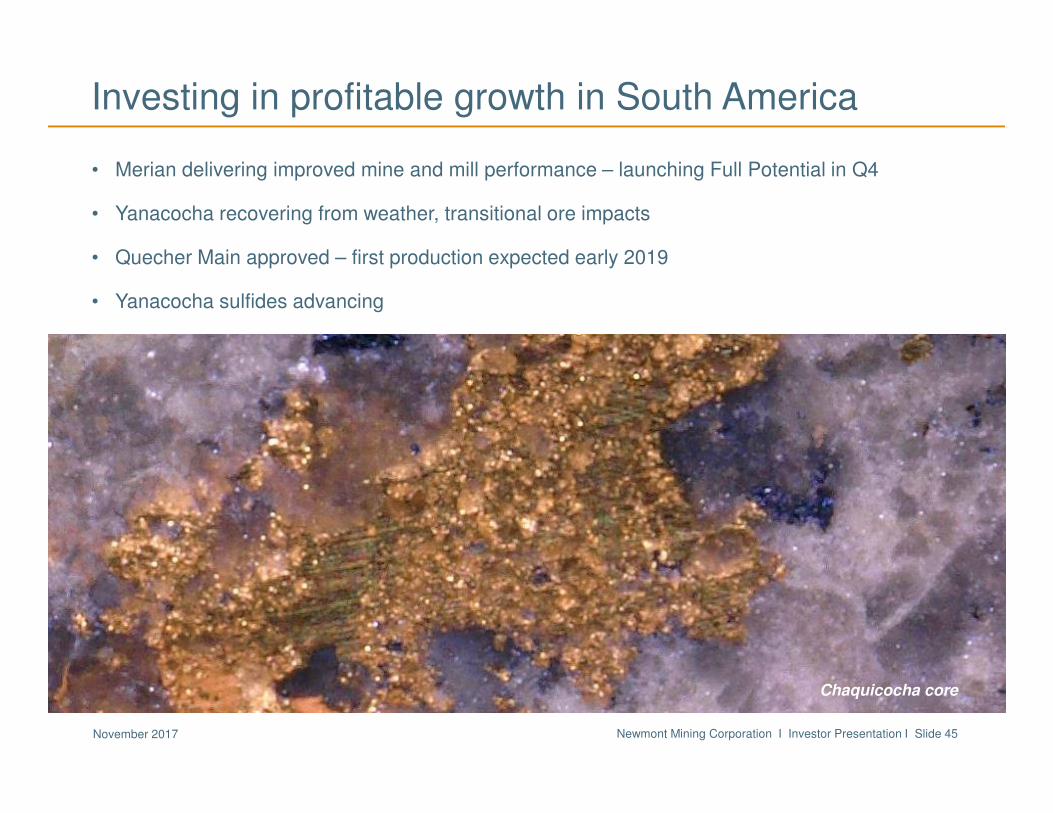
Investing in profitable growth in South America
Merian
• Merian delivering improved mine and mill performance – launching Full Potential in Q4
• Yanacocha recovering from weather, transitional ore impacts
• Quecher Main approved – first production expected early 2019
• Yanacocha sulfides advancing
Merian Chaquicocha core
Newmont Mining Corporation I Investor Presentation I Slide 46November 2017
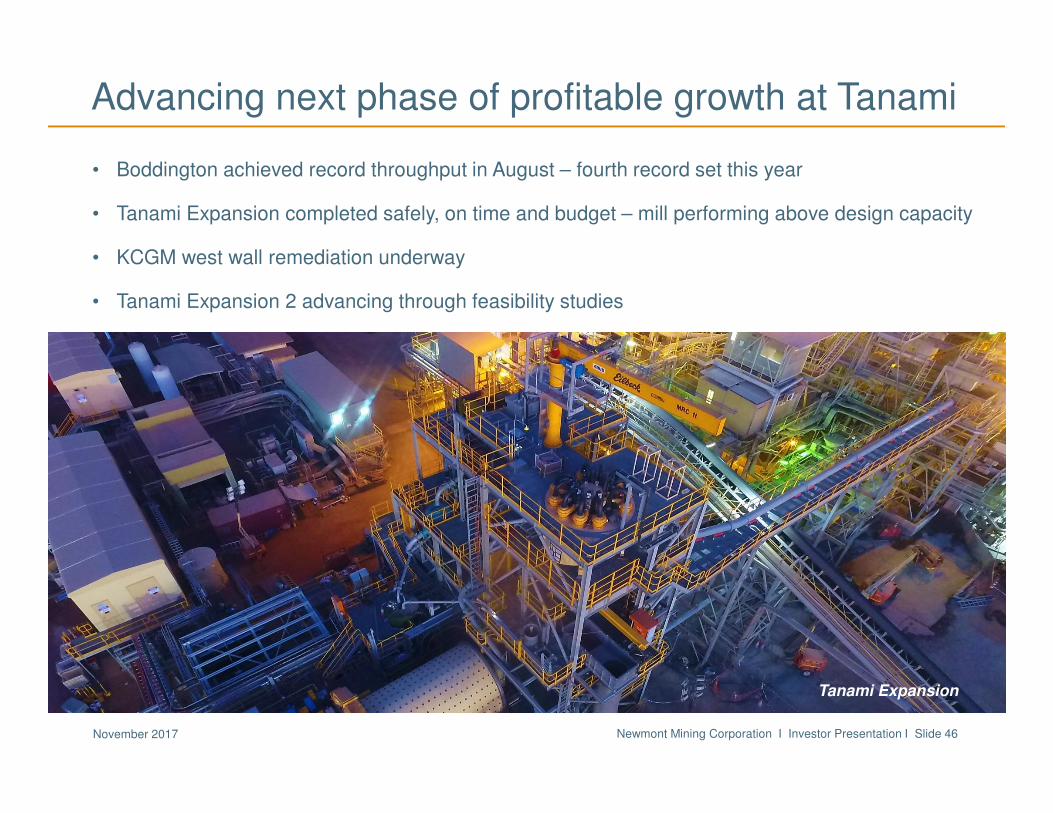
Advancing next phase of profitable growth at Tanami
• Boddington achieved record throughput in August – fourth record set this year
• Tanami Expansion completed safely, on time and budget – mill performing above design capacity
• KCGM west wall remediation underway
• Tanami Expansion 2 advancing through feasibility studies
Tanami Expansion
Newmont Mining Corporation I Investor Presentation I Slide 47November 2017
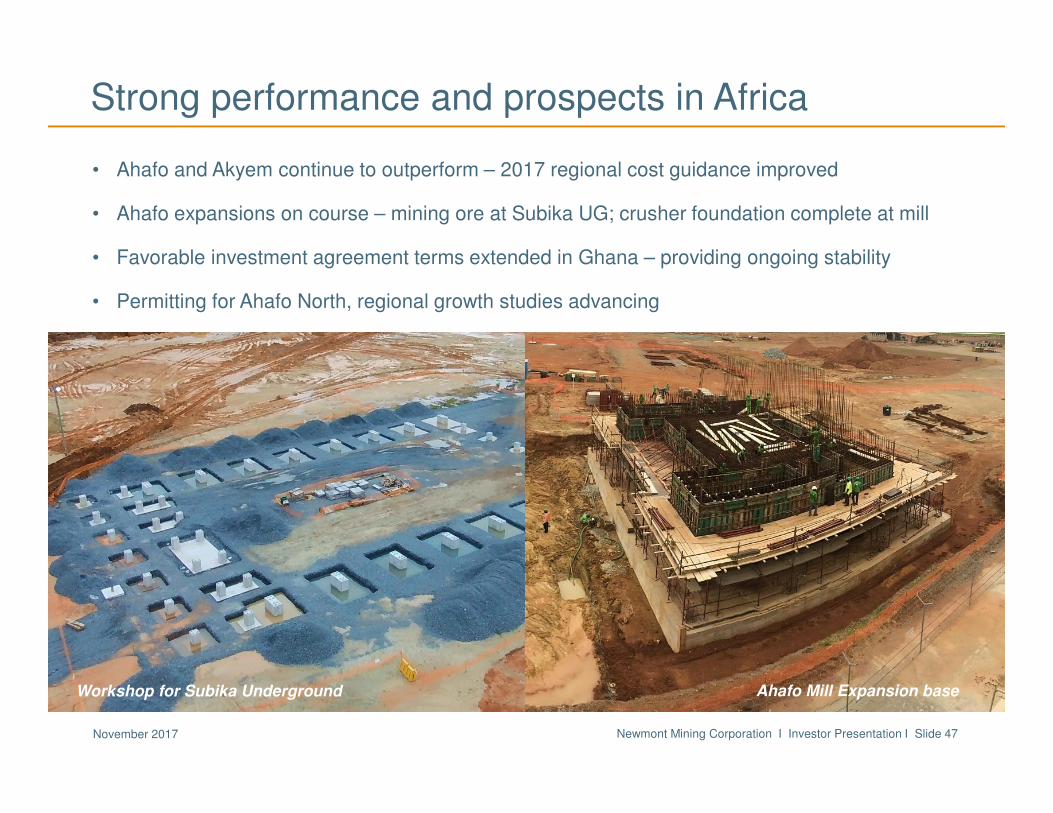
Strong performance and prospects in Africa
Ahafo Mill ExpansionSubika Underground
• Ahafo and Akyem continue to outperform – 2017 regional cost guidance improved
• Ahafo expansions on course – mining ore at Subika UG; crusher foundation complete at mill
• Favorable investment agreement terms extended in Ghana – providing ongoing stability
• Permitting for Ahafo North, regional growth studies advancing
Ahafo Mill Expansion baseWorkshop for Subika Underground
Newmont Mining Corporation I Investor Presentation I Slide 48November 2017
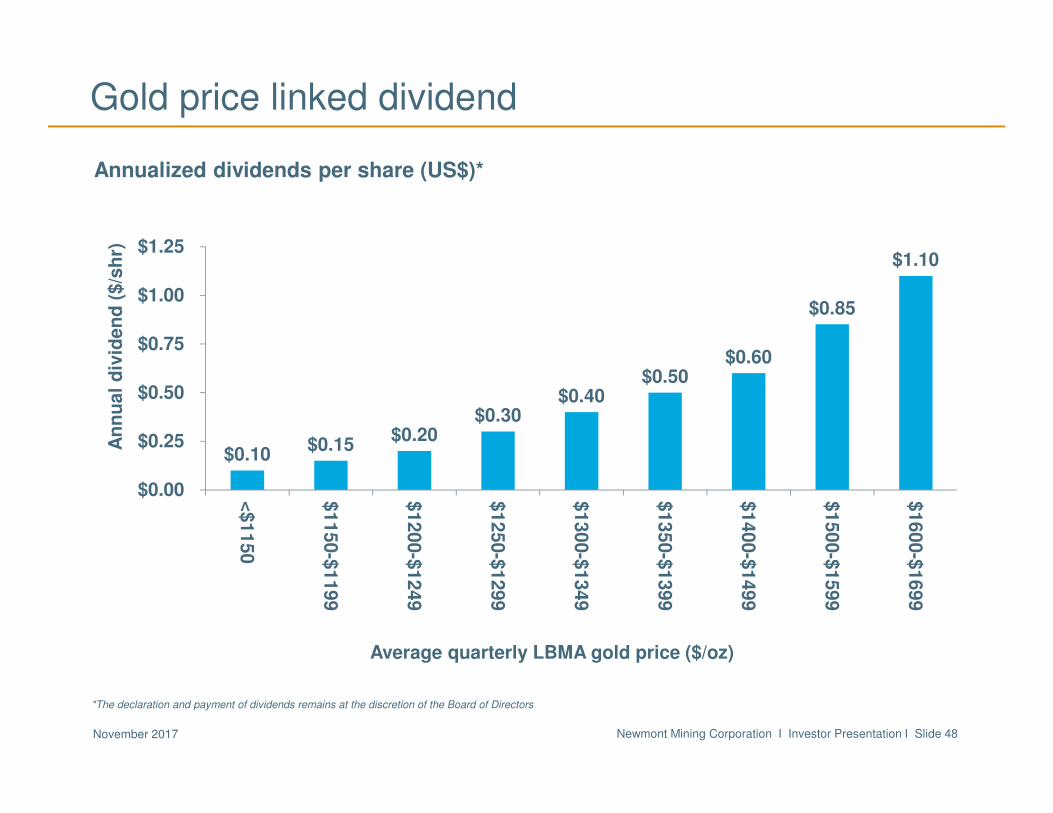
Gold price linked dividend
Dividend increased by ~75% on average over prior policy
Annualized dividends per share (US$)*
*The declaration and payment of dividends remains at the discretion of the Board of Directors
$0.10 $0.15
$0.20 $0.30
$0.40 $0.50
$0.60
$0.85
$1.10
$0.00
$0.25
$0.50
$0.75
$1.00
$1.25
<$1150
$1150-$
1199
$1200-$
1249
$1250-$
1299
$1300-$
1349
$1350-$
1399
$1400-$
1499
$1500-$
1599
$1600-$
1699
An
nu
al
div
iden
d (
$/s
hr)
Average quarterly LBMA gold price ($/oz)
Newmont Mining Corporation I Investor Presentation I Slide 49November 2017
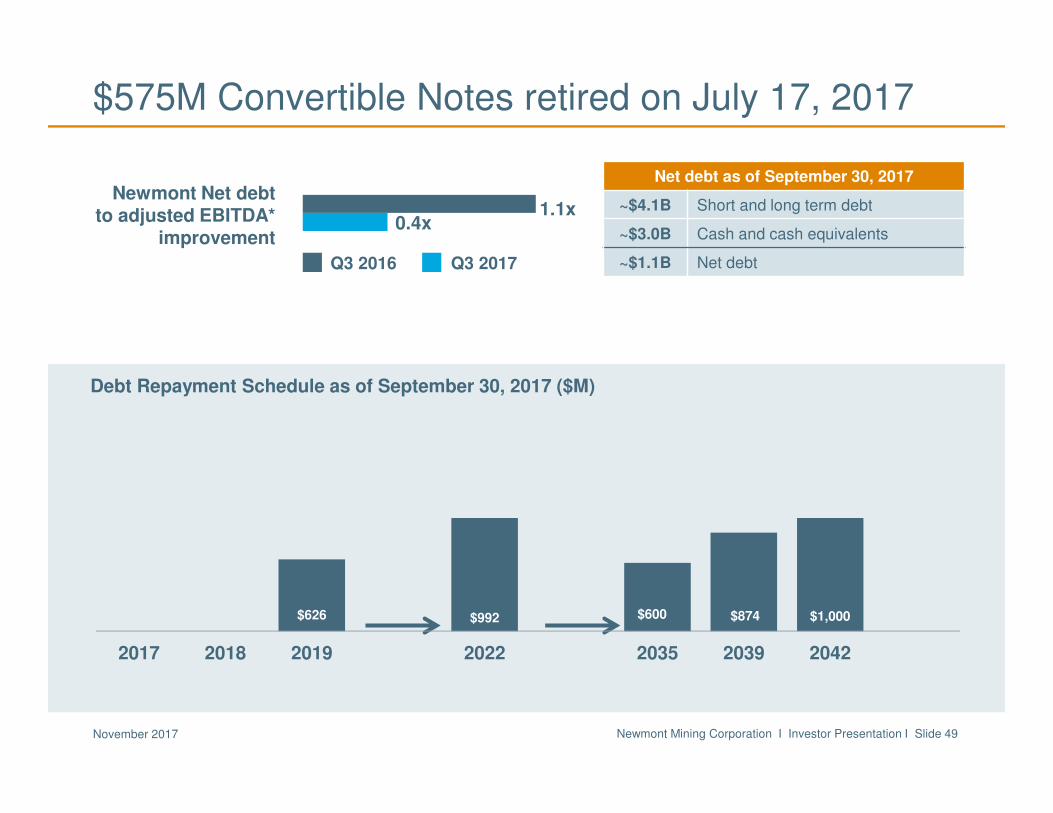
$575M Convertible Notes retired on July 17, 2017
Debt Repayment Schedule as of September 30, 2017 ($M)
Newmont Net debtto adjusted EBITDA*
improvement
Q3 2016 Q3 2017
Net debt as of September 30, 2017
~$4.1B Short and long term debt
~$3.0B Cash and cash equivalents
~$1.1B Net debt
0.4x1.1x
$626 $992 $600 $874 $1,000
2017 2018 2019 2022 2035 2039 2042
Newmont Mining Corporation I Investor Presentation I Slide 50November 2017
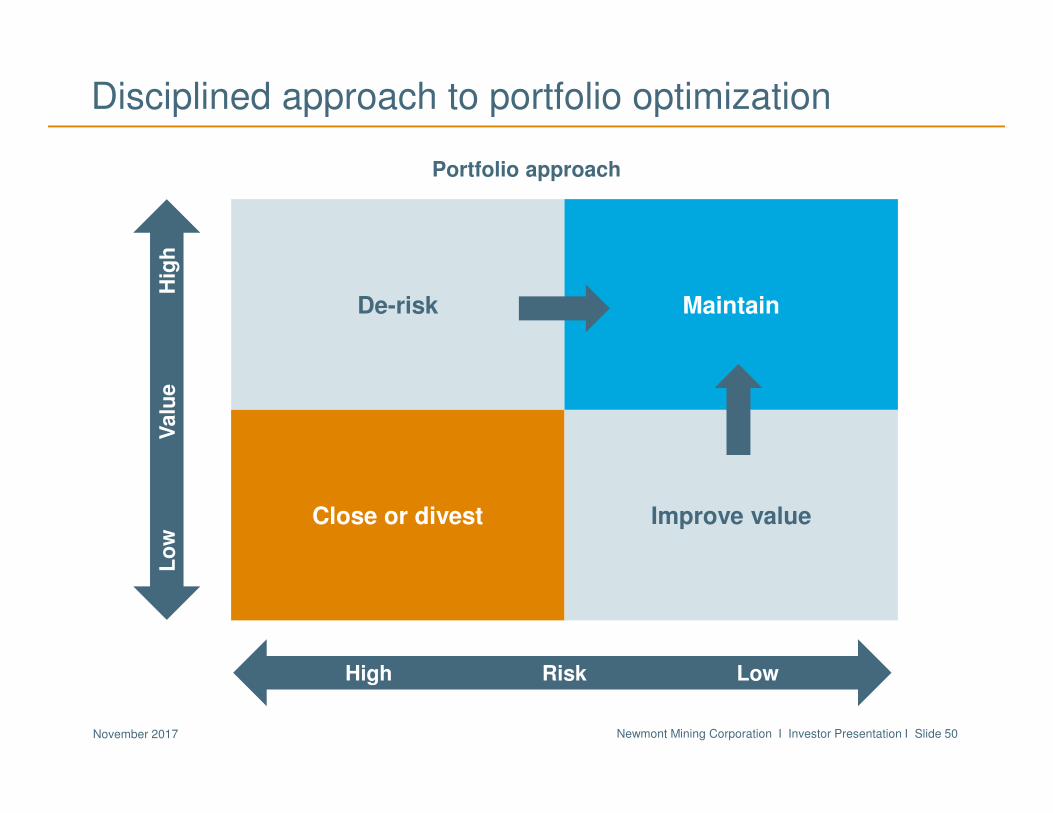
Disciplined approach to portfolio optimization
De-risk Maintain
Close or divest Improve value
Lo
w
V
alu
e
Hig
h
High Risk Low
Portfolio approach
Newmont Mining Corporation I Investor Presentation I Slide 51November 2017
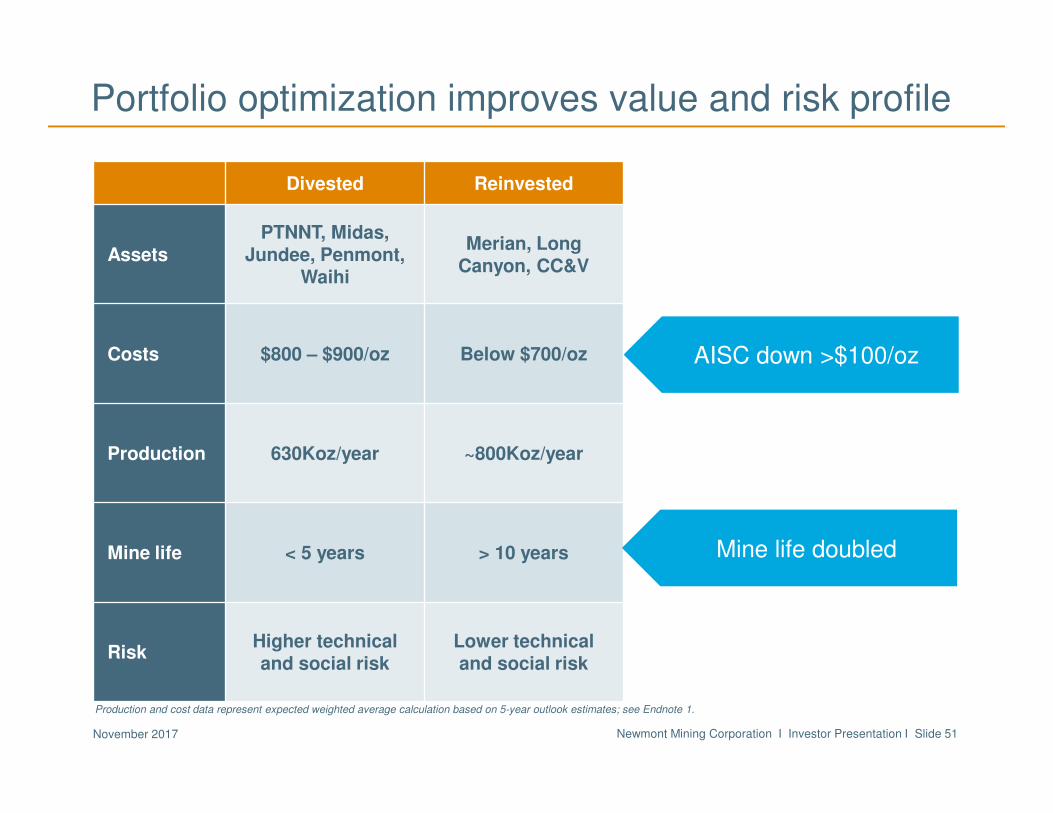
Portfolio optimization improves value and risk profile
AISC down >$100/oz
Divested Reinvested
AssetsPTNNT, Midas,
Jundee, Penmont, Waihi
Merian, Long Canyon, CC&V
Costs $800 – $900/oz Below $700/oz
Production 630Koz/year ~800Koz/year
Mine life < 5 years > 10 years
Risk Higher technical and social risk
Lower technical and social risk
Mine life doubled
Production and cost data represent expected weighted average calculation based on 5-year outlook estimates; see Endnote 1.
Newmont Mining Corporation I Investor Presentation I Slide 52November 2017
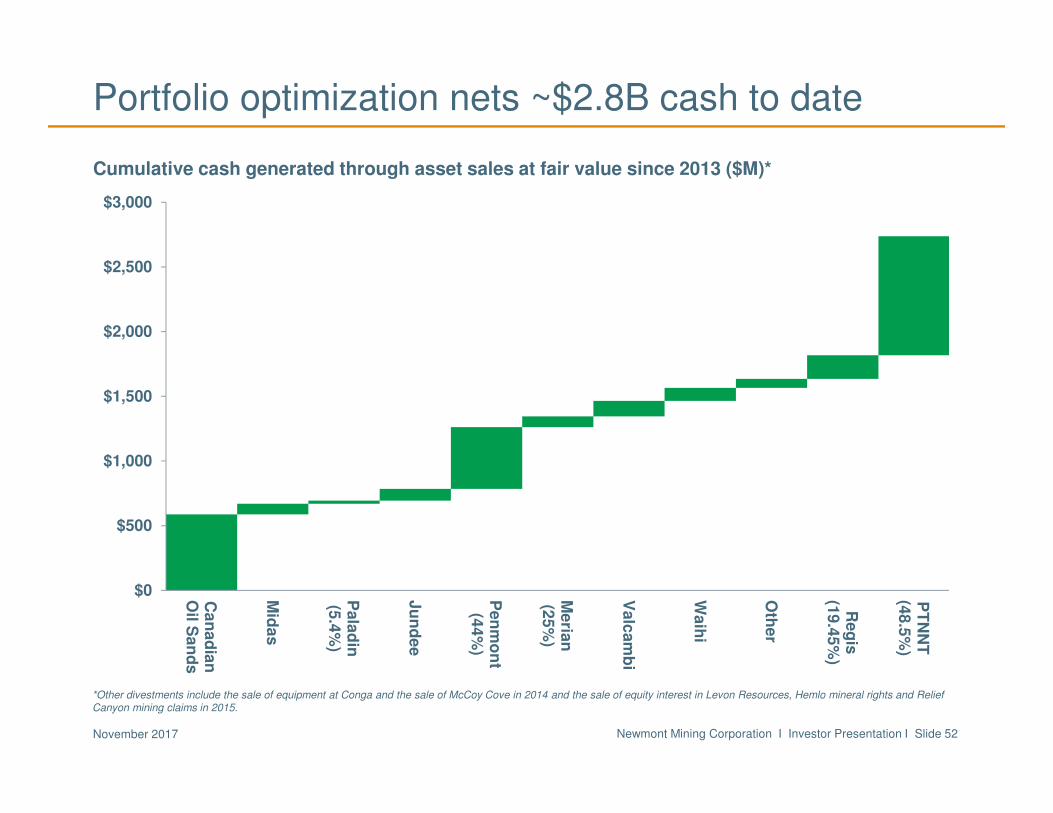
*Other divestments include the sale of equipment at Conga and the sale of McCoy Cove in 2014 and the sale of equity interest in Levon Resources, Hemlo mineral rights and Relief Canyon mining claims in 2015.
Portfolio optimization nets ~$2.8B cash to date
Cumulative cash generated through asset sales at fair value since 2013 ($M)*
$0
$500
$1,000
$1,500
$2,000
$2,500
$3,000
Ca
na
dia
nO
il Sa
nd
s
Mid
as
Pala
din
(5.4
%)
Ju
nd
ee
Pen
mo
nt
(44
%)
Me
rian
(25
%)
Valc
am
bi
Wa
ihi
Oth
er
Re
gis
(19
.45
%)
PT
NN
T(4
8.5
%)
Newmont Mining Corporation I Investor Presentation I Slide 53November 2017
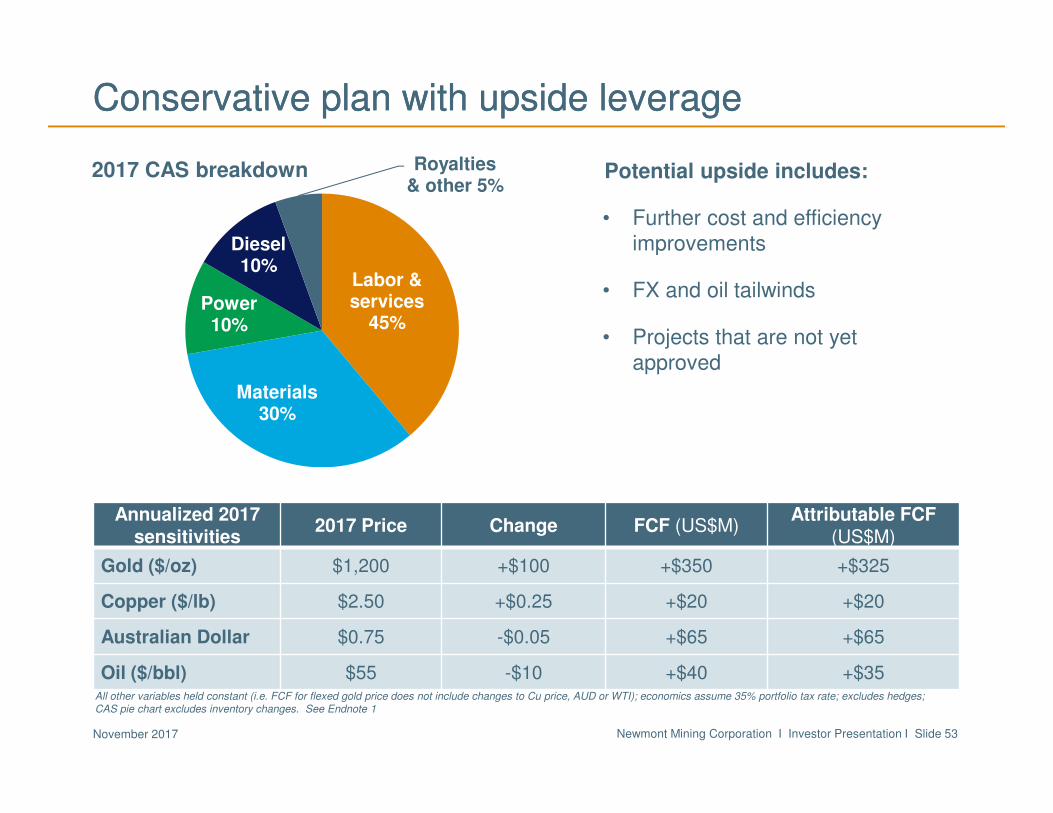
Labor & services
45%
Materials 30%
Power 10%
Diesel 10%
Royalties & other 5%
Conservative plan with upside leverageConservative plan with upside leverage
All other variables held constant (i.e. FCF for flexed gold price does not include changes to Cu price, AUD or WTI); economics assume 35% portfolio tax rate; excludes hedges;CAS pie chart excludes inventory changes. See Endnote 1
2017 CAS breakdown Potential upside includes:
• Further cost and efficiency improvements
• FX and oil tailwinds
• Projects that are not yet approved
Annualized 2017 sensitivities
2017 Price Change FCF (US$M)Attributable FCF
(US$M)
Gold ($/oz) $1,200 +$100 +$350 +$325
Copper ($/lb) $2.50 +$0.25 +$20 +$20
Australian Dollar $0.75 -$0.05 +$65 +$65
Oil ($/bbl) $55 -$10 +$40 +$35
Newmont Mining Corporation I Investor Presentation I Slide 54November 2017
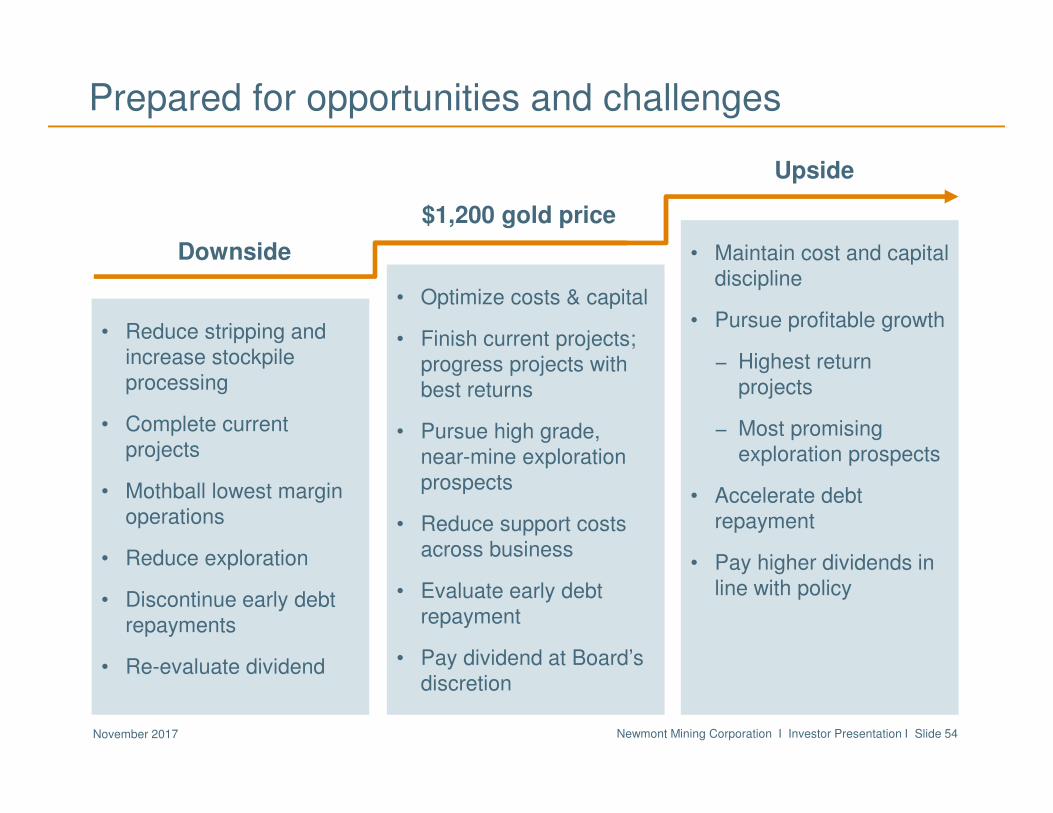
Prepared for opportunities and challenges
$1,200 gold price
• Optimize costs & capital
• Finish current projects; progress projects with best returns
• Pursue high grade, near-mine exploration prospects
• Reduce support costs across business
• Evaluate early debt repayment
• Pay dividend at Board’s discretion
Downside
• Reduce stripping and increase stockpile processing
• Complete current projects
• Mothball lowest margin operations
• Reduce exploration
• Discontinue early debt repayments
• Re-evaluate dividend
Upside
• Maintain cost and capital discipline
• Pursue profitable growth
− Highest return projects
− Most promising exploration prospects
• Accelerate debt repayment
• Pay higher dividends in line with policy
Newmont Mining Corporation I Investor Presentation I Slide 55November 2017
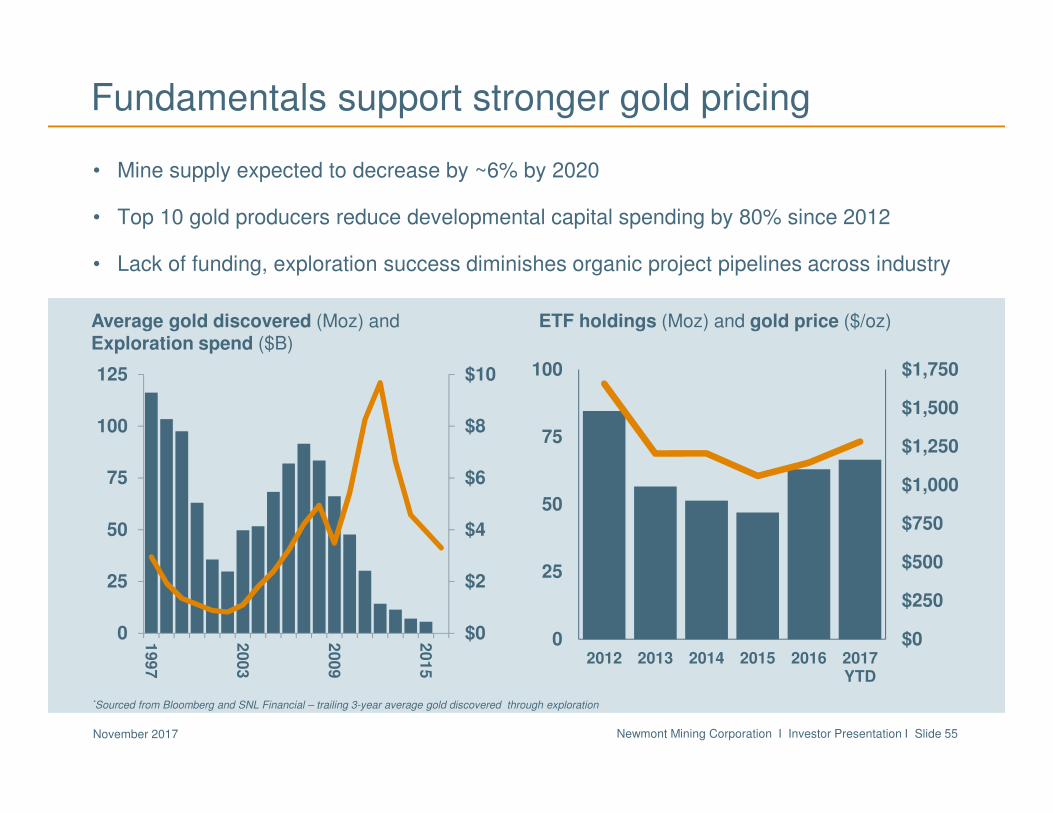
Fundamentals support stronger gold pricing
• Mine supply expected to decrease by ~6% by 2020
• Top 10 gold producers reduce developmental capital spending by 80% since 2012
• Lack of funding, exploration success diminishes organic project pipelines across industry
*Sourced from Bloomberg and SNL Financial – trailing 3-year average gold discovered through exploration
Average gold discovered (Moz) andExploration spend ($B)
ETF holdings (Moz) and gold price ($/oz)
$0
$2
$4
$6
$8
$10
0
25
50
75
100
125
199
7
200
3
200
9
201
5$0
$250
$500
$750
$1,000
$1,250
$1,500
$1,750
0
25
50
75
100
2012 2013 2014 2015 2016 2017YTD
Newmont Mining Corporation I Investor Presentation I Slide 56November 2017
-
2
4
6
8
10
12
UA
E
Ho
ng
Ko
ng
Sw
itze
rlan
d
Sau
di A
rab
ia
Th
aila
nd
Germ
an
y
Tu
rkey
Vie
tna
m
Ch
ina
Ind
ia
Ta
iwa
n
Un
ited
Sta
tes
UK
Eg
yp
t
Ru
ssia
So
uth
Ko
rea
Italy
Ind
on
esia
Fra
nce
Ja
pa
n
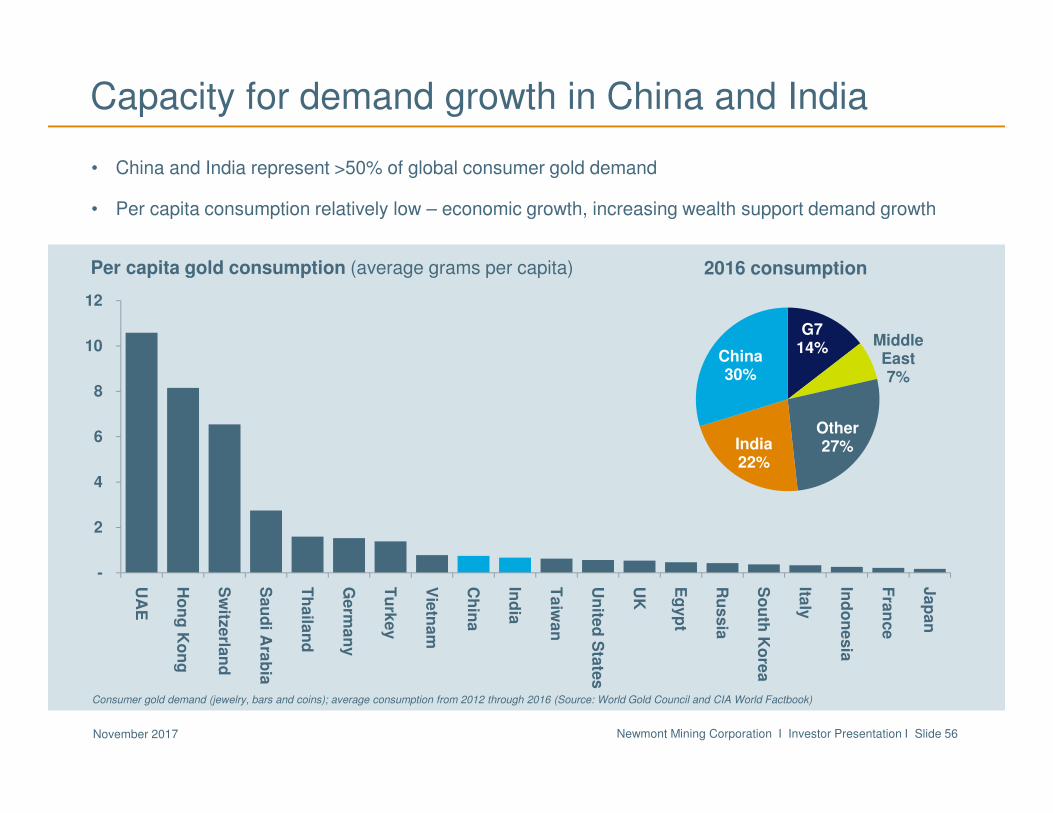
Capacity for demand growth in China and India
Consumer gold demand (jewelry, bars and coins); average consumption from 2012 through 2016 (Source: World Gold Council and CIA World Factbook)
Per capita gold consumption (average grams per capita)
• China and India represent >50% of global consumer gold demand
• Per capita consumption relatively low – economic growth, increasing wealth support demand growth
2016 consumption
G714% Middle
East7%
Other27%India
22%
China30%
Newmont Mining Corporation I Investor Presentation I Slide 57November 2017
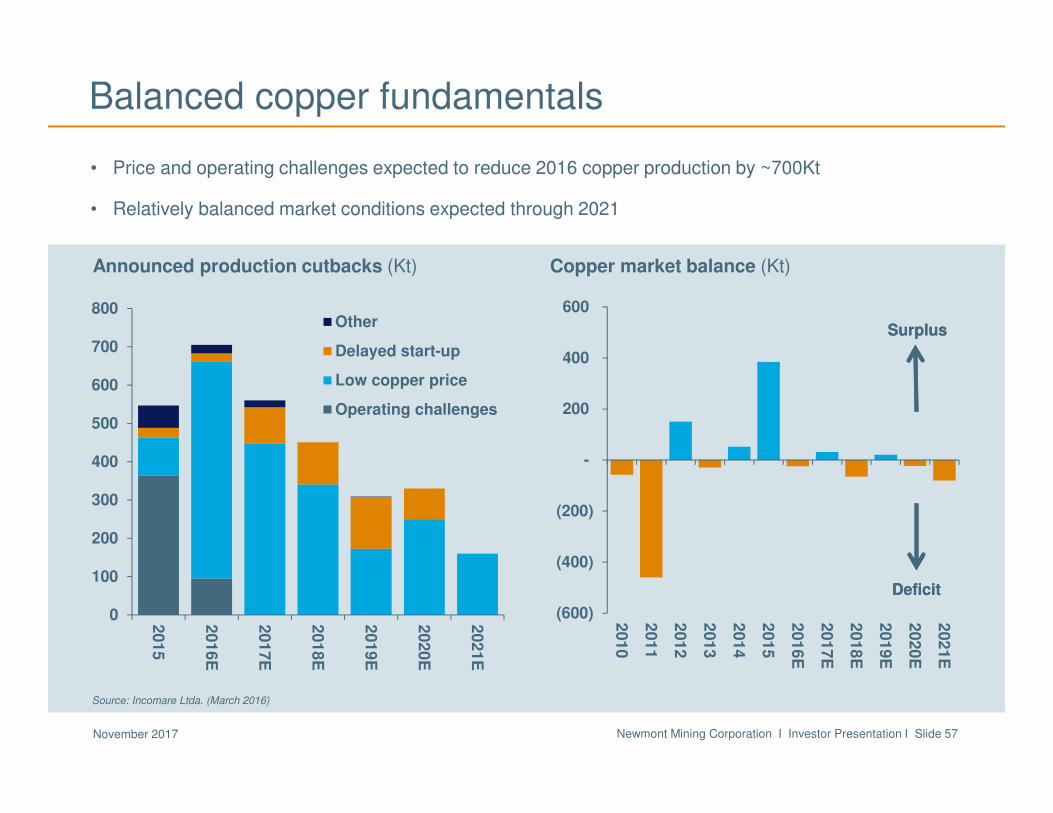
Announced production cutbacks (Kt) Copper market balance (Kt)
• Price and operating challenges expected to reduce 2016 copper production by ~700Kt
• Relatively balanced market conditions expected through 2021
Balanced copper fundamentals
Surplus
Deficit
Source: Incomare Ltda. (March 2016)
Surplus
Deficit
(600)
(400)
(200)
-
200
400
600
201
0
201
1
201
2
201
3
201
4
201
5
201
6E
201
7E
201
8E
201
9E
202
0E
202
1E
0
100
200
300
400
500
600
700
800
201
5
201
6E
201
7E
201
8E
201
9E
202
0E
202
1E
Other
Delayed start-up
Low copper price
Operating challenges
Newmont Mining Corporation I Investor Presentation I Slide 58November 2017
2017 Outlooka
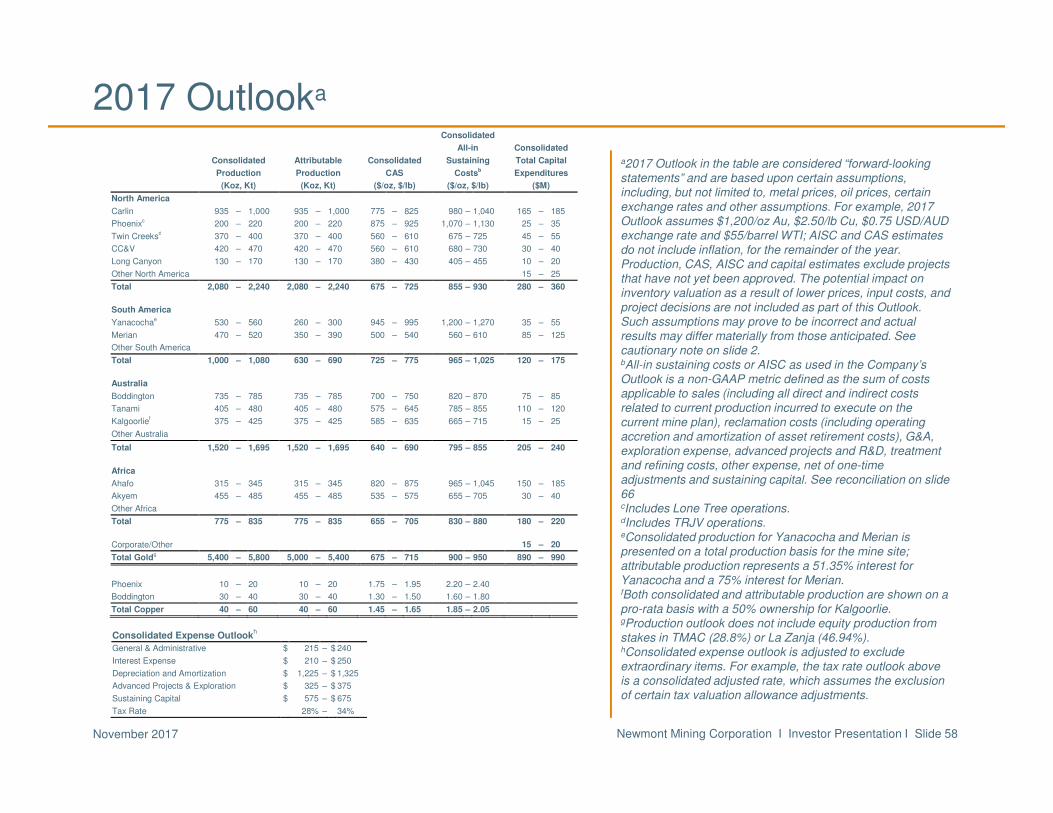
a2017 Outlook in the table are considered “forward-looking statements” and are based upon certain assumptions, including, but not limited to, metal prices, oil prices, certain exchange rates and other assumptions. For example, 2017 Outlook assumes $1,200/oz Au, $2.50/lb Cu, $0.75 USD/AUD exchange rate and $55/barrel WTI; AISC and CAS estimates do not include inflation, for the remainder of the year. Production, CAS, AISC and capital estimates exclude projects that have not yet been approved. The potential impact on inventory valuation as a result of lower prices, input costs, and project decisions are not included as part of this Outlook. Such assumptions may prove to be incorrect and actual results may differ materially from those anticipated. See cautionary note on slide 2.bAll-in sustaining costs or AISC as used in the Company’s Outlook is a non-GAAP metric defined as the sum of costs applicable to sales (including all direct and indirect costs related to current production incurred to execute on the current mine plan), reclamation costs (including operating accretion and amortization of asset retirement costs), G&A, exploration expense, advanced projects and R&D, treatment and refining costs, other expense, net of one-time adjustments and sustaining capital. See reconciliation on slide 66cIncludes Lone Tree operations.dIncludes TRJV operations.eConsolidated production for Yanacocha and Merian is presented on a total production basis for the mine site; attributable production represents a 51.35% interest for Yanacocha and a 75% interest for Merian.fBoth consolidated and attributable production are shown on a pro-rata basis with a 50% ownership for Kalgoorlie.gProduction outlook does not include equity production from stakes in TMAC (28.8%) or La Zanja (46.94%).hConsolidated expense outlook is adjusted to exclude extraordinary items. For example, the tax rate outlook above is a consolidated adjusted rate, which assumes the exclusion of certain tax valuation allowance adjustments.
Consolidated Expense Outlookh
General & Administrative $ 215 – $ 240
Interest Expense $ 210 – $ 250
Depreciation and Amortization $ 1,225 – $ 1,325
Advanced Projects & Exploration $ 325 – $ 375
Sustaining Capital $ 575 – $ 675
Tax Rate 28% – 34%
Consolidated
All-in Consolidated
Consolidated Attributable Consolidated Sustaining Total Capital
Production Production CAS Costsb Expenditures
(Koz, Kt) (Koz, Kt) ($/oz, $/lb) ($/oz, $/lb) ($M)
North America
Carlin 935 – 1,000 935 – 1,000 775 – 825 980 – 1,040 165 – 185
Phoenixc 200 – 220 200 – 220 875 – 925 1,070 – 1,130 25 – 35
Twin Creeksd 370 – 400 370 – 400 560 – 610 675 – 725 45 – 55
CC&V 420 – 470 420 – 470 560 – 610 680 – 730 30 – 40
Long Canyon 130 – 170 130 – 170 380 – 430 405 – 455 10 – 20
Other North America 15 – 25
Total 2,080 – 2,240 2,080 – 2,240 675 – 725 855 – 930 280 – 360
South America
Yanacochae 530 – 560 260 – 300 945 – 995 1,200 – 1,270 35 – 55
Merian 470 – 520 350 – 390 500 – 540 560 – 610 85 – 125
Other South America
Total 1,000 – 1,080 630 – 690 725 – 775 965 – 1,025 120 – 175
Australia
Boddington 735 – 785 735 – 785 700 – 750 820 – 870 75 – 85
Tanami 405 – 480 405 – 480 575 – 645 785 – 855 110 – 120
Kalgoorlief 375 – 425 375 – 425 585 – 635 665 – 715 15 – 25
Other Australia
Total 1,520 – 1,695 1,520 – 1,695 640 – 690 795 – 855 205 – 240
Africa
Ahafo 315 – 345 315 – 345 820 – 875 965 – 1,045 150 – 185
Akyem 455 – 485 455 – 485 535 – 575 655 – 705 30 – 40
Other Africa
Total 775 – 835 775 – 835 655 – 705 830 – 880 180 – 220
Corporate/Other 15 – 20
Total Goldg 5,400 – 5,800 5,000 – 5,400 675 – 715 900 – 950 890 – 990
Phoenix 10 – 20 10 – 20 1.75 – 1.95 2.20 – 2.40
Boddington 30 – 40 30 – 40 1.30 – 1.50 1.60 – 1.80
Total Copper 40 – 60 40 – 60 1.45 – 1.65 1.85 – 2.05
Newmont Mining Corporation I Investor Presentation I Slide 59November 2017
Adjusted net income
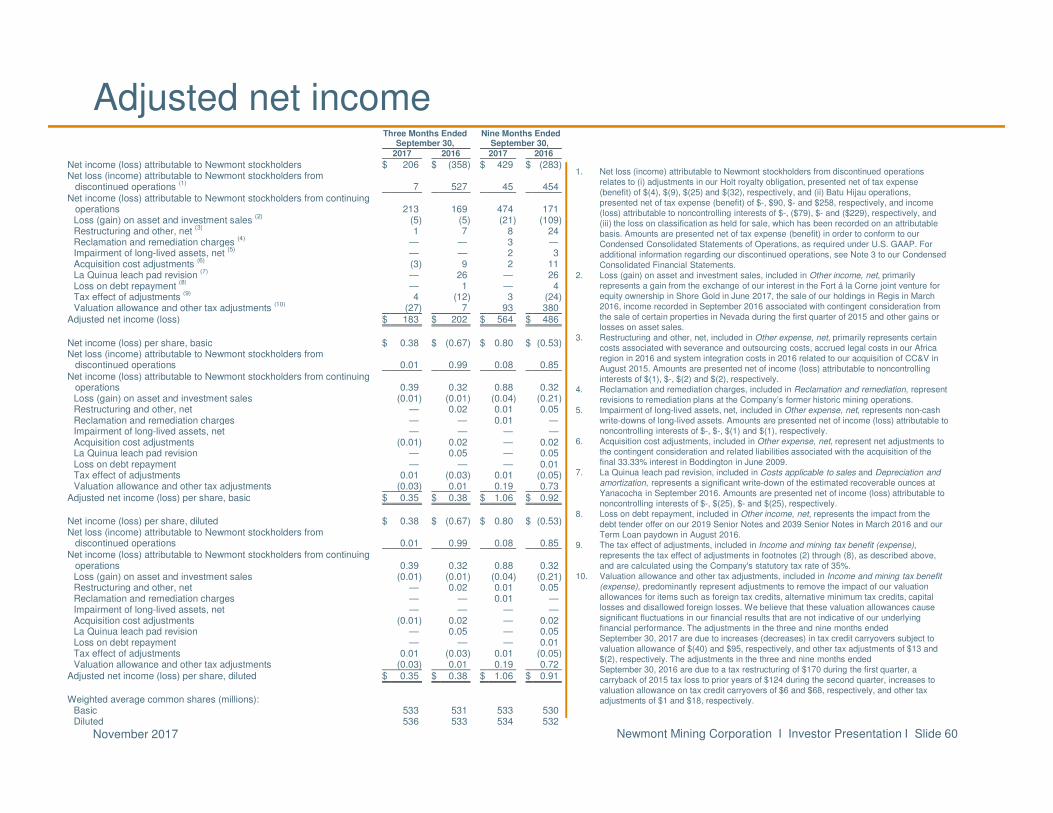
Management uses Adjusted net income (loss) to evaluate the Company’s operating performance and for planning and forecasting future business operations. The Company believes the use of Adjusted net income (loss) allows investors and analysts to understand the results of the continuing operations of the Company and its direct and indirect subsidiaries relating to the sale of products, by excluding certain items that have a disproportionate impact on our results for a particular period. Adjustments to continuing operations are presented before tax and net of our partners’ noncontrolling interests, when applicable. The tax effect of adjustments is presented in the Tax effect of adjustments line and is generally calculated using the Company’s statutory effective tax rate of 35%. Management’s determination of the components of Adjusted net income (loss) are evaluated periodically and based, in part, on a review of non-GAAP financial measures used by mining industry analysts. Net income (loss) attributable to Newmont stockholders is reconciled to Adjusted net income (loss) as follows:
Newmont Mining Corporation I Investor Presentation I Slide 60November 2017
Adjusted net income
1. Net loss (income) attributable to Newmont stockholders from discontinued operations relates to (i) adjustments in our Holt royalty obligation, presented net of tax expense (benefit) of $(4), $(9), $(25) and $(32), respectively, and (ii) Batu Hijau operations, presented net of tax expense (benefit) of $-, $90, $- and $258, respectively, and income (loss) attributable to noncontrolling interests of $-, ($79), $- and ($229), respectively, and (iii) the loss on classification as held for sale, which has been recorded on an attributable basis. Amounts are presented net of tax expense (benefit) in order to conform to our Condensed Consolidated Statements of Operations, as required under U.S. GAAP. For additional information regarding our discontinued operations, see Note 3 to our Condensed Consolidated Financial Statements.
2. Loss (gain) on asset and investment sales, included in Other income, net, primarily represents a gain from the exchange of our interest in the Fort á la Corne joint venture for equity ownership in Shore Gold in June 2017, the sale of our holdings in Regis in March 2016, income recorded in September 2016 associated with contingent consideration from the sale of certain properties in Nevada during the first quarter of 2015 and other gains or losses on asset sales.
3. Restructuring and other, net, included in Other expense, net, primarily represents certain costs associated with severance and outsourcing costs, accrued legal costs in our Africa region in 2016 and system integration costs in 2016 related to our acquisition of CC&V in August 2015. Amounts are presented net of income (loss) attributable to noncontrollinginterests of $(1), $-, $(2) and $(2), respectively.
4. Reclamation and remediation charges, included in Reclamation and remediation, represent revisions to remediation plans at the Company’s former historic mining operations.
5. Impairment of long-lived assets, net, included in Other expense, net, represents non-cash write-downs of long-lived assets. Amounts are presented net of income (loss) attributable to noncontrolling interests of $-, $-, $(1) and $(1), respectively.
6. Acquisition cost adjustments, included in Other expense, net, represent net adjustments to the contingent consideration and related liabilities associated with the acquisition of the final 33.33% interest in Boddington in June 2009.
7. La Quinua leach pad revision, included in Costs applicable to sales and Depreciation and amortization, represents a significant write-down of the estimated recoverable ounces at Yanacocha in September 2016. Amounts are presented net of income (loss) attributable to noncontrolling interests of $-, $(25), $- and $(25), respectively.
8. Loss on debt repayment, included in Other income, net, represents the impact from the debt tender offer on our 2019 Senior Notes and 2039 Senior Notes in March 2016 and our Term Loan paydown in August 2016.
9. The tax effect of adjustments, included in Income and mining tax benefit (expense), represents the tax effect of adjustments in footnotes (2) through (8), as described above, and are calculated using the Company's statutory tax rate of 35%.
10. Valuation allowance and other tax adjustments, included in Income and mining tax benefit (expense), predominantly represent adjustments to remove the impact of our valuation allowances for items such as foreign tax credits, alternative minimum tax credits, capital losses and disallowed foreign losses. We believe that these valuation allowances cause significant fluctuations in our financial results that are not indicative of our underlying financial performance. The adjustments in the three and nine months ended September 30, 2017 are due to increases (decreases) in tax credit carryovers subject to valuation allowance of $(40) and $95, respectively, and other tax adjustments of $13 and $(2), respectively. The adjustments in the three and nine months ended September 30, 2016 are due to a tax restructuring of $170 during the first quarter, a carryback of 2015 tax loss to prior years of $124 during the second quarter, increases to valuation allowance on tax credit carryovers of $6 and $68, respectively, and other tax adjustments of $1 and $18, respectively.
Three Months Ended Nine Months Ended September 30, September 30, 2017 2016 2017 2016
Net income (loss) attributable to Newmont stockholders $ 206 $ (358) $ 429 $ (283) Net loss (income) attributable to Newmont stockholders from
discontinued operations (1)
7 527 45 454 Net income (loss) attributable to Newmont stockholders from continuing
operations 213 169 474 171 Loss (gain) on asset and investment sales
(2) (5) (5) (21) (109)
Restructuring and other, net (3)
1 7 8 24 Reclamation and remediation charges
(4) — — 3 —
Impairment of long-lived assets, net (5)
— — 2 3 Acquisition cost adjustments
(6) (3) 9 2 11
La Quinua leach pad revision (7)
— 26 — 26 Loss on debt repayment
(8) — 1 — 4
Tax effect of adjustments (9)
4 (12) 3 (24) Valuation allowance and other tax adjustments
(10) (27) 7 93 380
Adjusted net income (loss) $ 183 $ 202 $ 564 $ 486
Net income (loss) per share, basic $ 0.38 $ (0.67) $ 0.80 $ (0.53) Net loss (income) attributable to Newmont stockholders from
discontinued operations 0.01 0.99 0.08 0.85 Net income (loss) attributable to Newmont stockholders from continuing
operations 0.39 0.32 0.88 0.32 Loss (gain) on asset and investment sales (0.01) (0.01) (0.04) (0.21) Restructuring and other, net — 0.02 0.01 0.05 Reclamation and remediation charges — — 0.01 — Impairment of long-lived assets, net — — — — Acquisition cost adjustments (0.01) 0.02 — 0.02 La Quinua leach pad revision — 0.05 — 0.05 Loss on debt repayment — — — 0.01 Tax effect of adjustments 0.01 (0.03) 0.01 (0.05) Valuation allowance and other tax adjustments (0.03) 0.01 0.19 0.73
Adjusted net income (loss) per share, basic $ 0.35 $ 0.38 $ 1.06 $ 0.92
Net income (loss) per share, diluted $ 0.38 $ (0.67) $ 0.80 $ (0.53) Net loss (income) attributable to Newmont stockholders from
discontinued operations 0.01 0.99 0.08 0.85 Net income (loss) attributable to Newmont stockholders from continuing
operations 0.39 0.32 0.88 0.32 Loss (gain) on asset and investment sales (0.01) (0.01) (0.04) (0.21) Restructuring and other, net — 0.02 0.01 0.05 Reclamation and remediation charges — — 0.01 — Impairment of long-lived assets, net — — — — Acquisition cost adjustments (0.01) 0.02 — 0.02 La Quinua leach pad revision — 0.05 — 0.05 Loss on debt repayment — — — 0.01 Tax effect of adjustments 0.01 (0.03) 0.01 (0.05) Valuation allowance and other tax adjustments (0.03) 0.01 0.19 0.72
Adjusted net income (loss) per share, diluted $ 0.35 $ 0.38 $ 1.06 $ 0.91
Weighted average common shares (millions):
Basic 533 531 533 530 Diluted 536 533 534 532
Newmont Mining Corporation I Investor Presentation I Slide 61November 2017
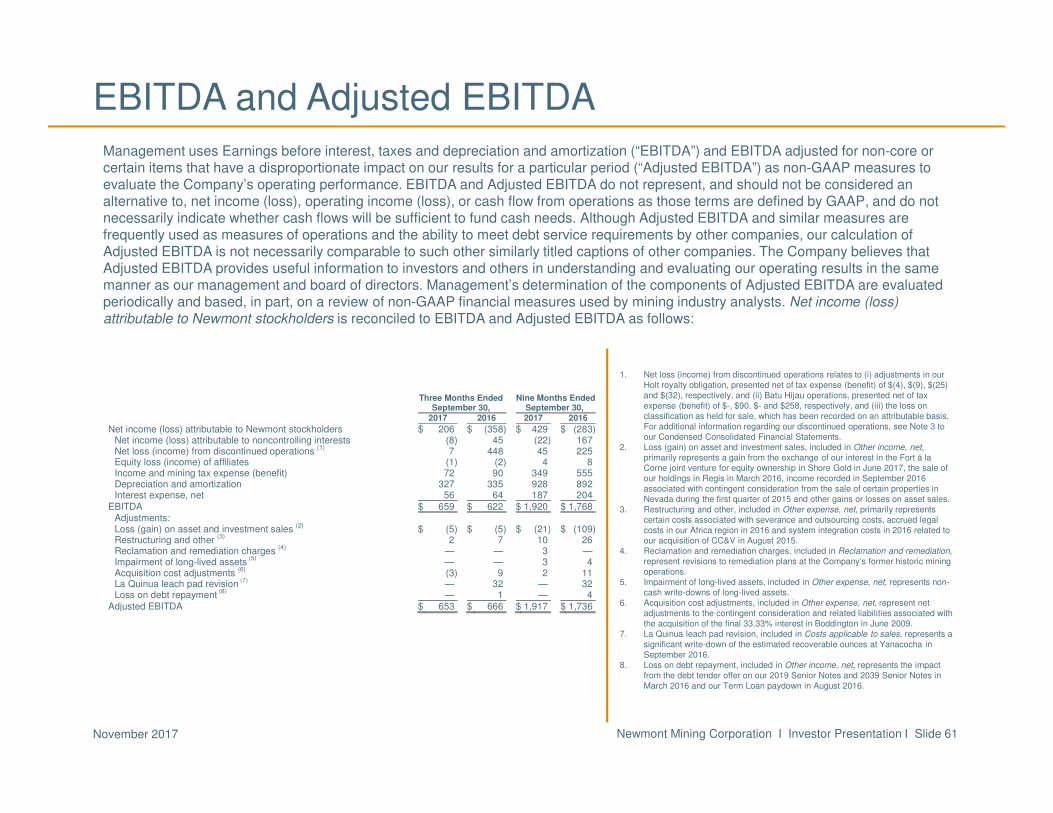
EBITDA and Adjusted EBITDAManagement uses Earnings before interest, taxes and depreciation and amortization (“EBITDA”) and EBITDA adjusted for non-core orcertain items that have a disproportionate impact on our results for a particular period (“Adjusted EBITDA”) as non-GAAP measures to evaluate the Company’s operating performance. EBITDA and Adjusted EBITDA do not represent, and should not be considered an alternative to, net income (loss), operating income (loss), or cash flow from operations as those terms are defined by GAAP, and do not necessarily indicate whether cash flows will be sufficient to fund cash needs. Although Adjusted EBITDA and similar measures arefrequently used as measures of operations and the ability to meet debt service requirements by other companies, our calculation of Adjusted EBITDA is not necessarily comparable to such other similarly titled captions of other companies. The Company believes that Adjusted EBITDA provides useful information to investors and others in understanding and evaluating our operating results in the same manner as our management and board of directors. Management’s determination of the components of Adjusted EBITDA are evaluated periodically and based, in part, on a review of non-GAAP financial measures used by mining industry analysts. Net income (loss) attributable to Newmont stockholders is reconciled to EBITDA and Adjusted EBITDA as follows:
1. Net loss (income) from discontinued operations relates to (i) adjustments in our Holt royalty obligation, presented net of tax expense (benefit) of $(4), $(9), $(25) and $(32), respectively, and (ii) Batu Hijau operations, presented net of tax expense (benefit) of $-, $90, $- and $258, respectively, and (iii) the loss on classification as held for sale, which has been recorded on an attributable basis. For additional information regarding our discontinued operations, see Note 3 to our Condensed Consolidated Financial Statements.
2. Loss (gain) on asset and investment sales, included in Other income, net, primarily represents a gain from the exchange of our interest in the Fort á la Corne joint venture for equity ownership in Shore Gold in June 2017, the sale of our holdings in Regis in March 2016, income recorded in September 2016 associated with contingent consideration from the sale of certain properties in Nevada during the first quarter of 2015 and other gains or losses on asset sales.
3. Restructuring and other, included in Other expense, net, primarily represents certain costs associated with severance and outsourcing costs, accrued legal costs in our Africa region in 2016 and system integration costs in 2016 related to our acquisition of CC&V in August 2015.
4. Reclamation and remediation charges, included in Reclamation and remediation, represent revisions to remediation plans at the Company’s former historic mining operations.
5. Impairment of long-lived assets, included in Other expense, net, represents non-cash write-downs of long-lived assets.
6. Acquisition cost adjustments, included in Other expense, net, represent net adjustments to the contingent consideration and related liabilities associated with the acquisition of the final 33.33% interest in Boddington in June 2009.
7. La Quinua leach pad revision, included in Costs applicable to sales, represents a significant write-down of the estimated recoverable ounces at Yanacocha in September 2016.
8. Loss on debt repayment, included in Other income, net, represents the impact from the debt tender offer on our 2019 Senior Notes and 2039 Senior Notes in March 2016 and our Term Loan paydown in August 2016.
Three Months Ended Nine Months Ended September 30, September 30, 2017 2016 2017 2016
Net income (loss) attributable to Newmont stockholders $ 206 $ (358) $ 429 $ (283) Net income (loss) attributable to noncontrolling interests (8) 45 (22) 167 Net loss (income) from discontinued operations
(1) 7 448 45 225
Equity loss (income) of affiliates (1) (2) 4 8 Income and mining tax expense (benefit) 72 90 349 555 Depreciation and amortization 327 335 928 892 Interest expense, net 56 64 187 204
EBITDA $ 659 $ 622 $ 1,920 $ 1,768 Adjustments: Loss (gain) on asset and investment sales
(2) $ (5) $ (5) $ (21) $ (109)
Restructuring and other (3)
2 7 10 26 Reclamation and remediation charges
(4) — — 3 —
Impairment of long-lived assets (5)
— — 3 4 Acquisition cost adjustments
(6) (3) 9 2 11
La Quinua leach pad revision (7)
— 32 — 32 Loss on debt repayment
(8) — 1 — 4
Adjusted EBITDA $ 653 $ 666 $ 1,917 $ 1,736
Newmont Mining Corporation I Investor Presentation I Slide 62November 2017
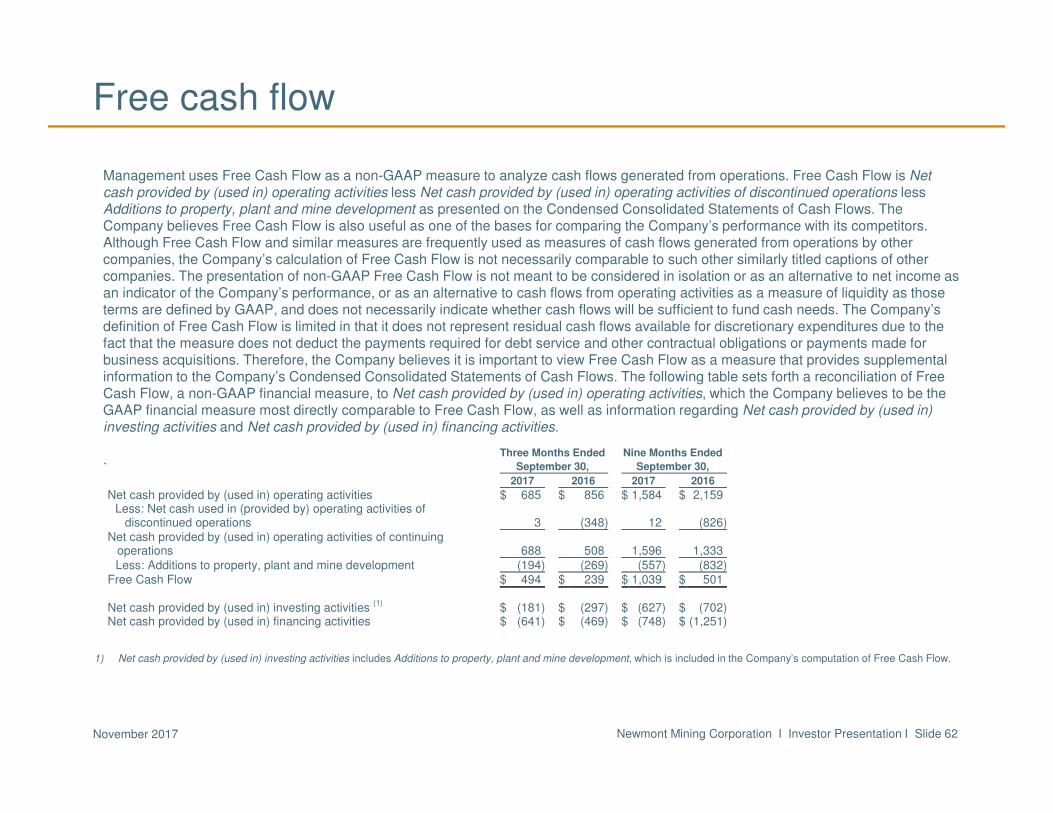
Free cash flow
Management uses Free Cash Flow as a non-GAAP measure to analyze cash flows generated from operations. Free Cash Flow is Net cash provided by (used in) operating activities less Net cash provided by (used in) operating activities of discontinued operations less Additions to property, plant and mine development as presented on the Condensed Consolidated Statements of Cash Flows. The Company believes Free Cash Flow is also useful as one of the bases for comparing the Company’s performance with its competitors.Although Free Cash Flow and similar measures are frequently used as measures of cash flows generated from operations by othercompanies, the Company’s calculation of Free Cash Flow is not necessarily comparable to such other similarly titled captions of other companies. The presentation of non-GAAP Free Cash Flow is not meant to be considered in isolation or as an alternative to net income as an indicator of the Company’s performance, or as an alternative to cash flows from operating activities as a measure of liquidity as those terms are defined by GAAP, and does not necessarily indicate whether cash flows will be sufficient to fund cash needs. The Company’s definition of Free Cash Flow is limited in that it does not represent residual cash flows available for discretionary expenditures due to the fact that the measure does not deduct the payments required for debt service and other contractual obligations or payments made for business acquisitions. Therefore, the Company believes it is important to view Free Cash Flow as a measure that provides supplemental information to the Company’s Condensed Consolidated Statements of Cash Flows. The following table sets forth a reconciliation of Free Cash Flow, a non-GAAP financial measure, to Net cash provided by (used in) operating activities, which the Company believes to be the GAAP financial measure most directly comparable to Free Cash Flow, as well as information regarding Net cash provided by (used in) investing activities and Net cash provided by (used in) financing activities.
.
1) Net cash provided by (used in) investing activities includes Additions to property, plant and mine development, which is included in the Company’s computation of Free Cash Flow.
Three Months Ended Nine Months Ended
September 30, September 30,
2017 2016 2017 2016
Net cash provided by (used in) operating activities $ 685 $ 856 $ 1,584 $ 2,159 Less: Net cash used in (provided by) operating activities of
discontinued operations 3 (348) 12 (826) Net cash provided by (used in) operating activities of continuing
operations 688 508 1,596 1,333 Less: Additions to property, plant and mine development (194) (269) (557) (832)
Free Cash Flow $ 494 $ 239 $ 1,039 $ 501
Net cash provided by (used in) investing activities (1)
$ (181) $ (297) $ (627) $ (702) Net cash provided by (used in) financing activities $ (641) $ (469) $ (748) $ (1,251)
Newmont Mining Corporation I Investor Presentation I Slide 63November 2017
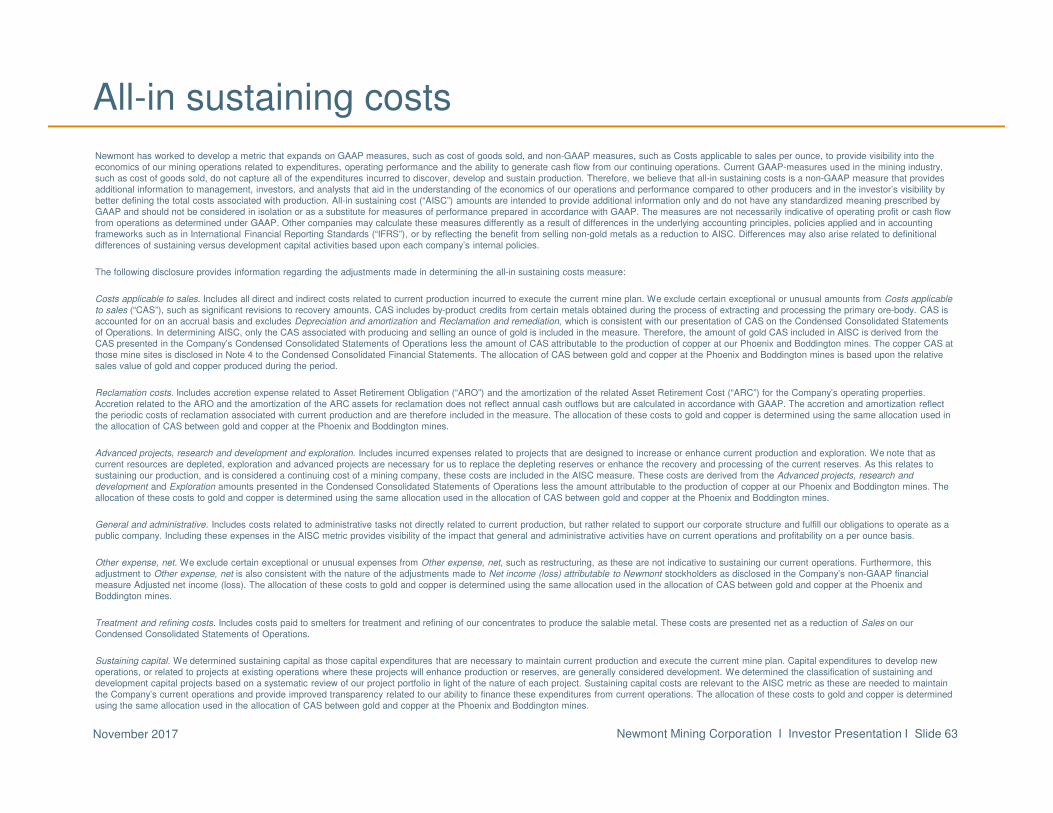
All-in sustaining costs
Newmont has worked to develop a metric that expands on GAAP measures, such as cost of goods sold, and non-GAAP measures, such as Costs applicable to sales per ounce, to provide visibility into the economics of our mining operations related to expenditures, operating performance and the ability to generate cash flow from our continuing operations. Current GAAP-measures used in the mining industry, such as cost of goods sold, do not capture all of the expenditures incurred to discover, develop and sustain production. Therefore, we believe that all-in sustaining costs is a non-GAAP measure that provides additional information to management, investors, and analysts that aid in the understanding of the economics of our operations and performance compared to other producers and in the investor’s visibility by better defining the total costs associated with production. All-in sustaining cost (“AISC”) amounts are intended to provide additional information only and do not have any standardized meaning prescribed by GAAP and should not be considered in isolation or as a substitute for measures of performance prepared in accordance with GAAP. The measures are not necessarily indicative of operating profit or cash flow from operations as determined under GAAP. Other companies may calculate these measures differently as a result of differences in the underlying accounting principles, policies applied and in accounting frameworks such as in International Financial Reporting Standards (“IFRS”), or by reflecting the benefit from selling non-gold metals as a reduction to AISC. Differences may also arise related to definitional differences of sustaining versus development capital activities based upon each company’s internal policies.
The following disclosure provides information regarding the adjustments made in determining the all-in sustaining costs measure:
Costs applicable to sales. Includes all direct and indirect costs related to current production incurred to execute the current mine plan. We exclude certain exceptional or unusual amounts from Costs applicable to sales (“CAS”), such as significant revisions to recovery amounts. CAS includes by-product credits from certain metals obtained during the process of extracting and processing the primary ore-body. CAS is accounted for on an accrual basis and excludes Depreciation and amortization and Reclamation and remediation, which is consistent with our presentation of CAS on the Condensed Consolidated Statements of Operations. In determining AISC, only the CAS associated with producing and selling an ounce of gold is included in the measure. Therefore, the amount of gold CAS included in AISC is derived from the CAS presented in the Company’s Condensed Consolidated Statements of Operations less the amount of CAS attributable to the production of copper at our Phoenix and Boddington mines. The copper CAS at those mine sites is disclosed in Note 4 to the Condensed Consolidated Financial Statements. The allocation of CAS between gold and copper at the Phoenix and Boddington mines is based upon the relative sales value of gold and copper produced during the period.
Reclamation costs. Includes accretion expense related to Asset Retirement Obligation (“ARO”) and the amortization of the related Asset Retirement Cost (“ARC”) for the Company’s operating properties. Accretion related to the ARO and the amortization of the ARC assets for reclamation does not reflect annual cash outflows but are calculated in accordance with GAAP. The accretion and amortization reflect the periodic costs of reclamation associated with current production and are therefore included in the measure. The allocation of these costs to gold and copper is determined using the same allocation used in the allocation of CAS between gold and copper at the Phoenix and Boddington mines.
Advanced projects, research and development and exploration. Includes incurred expenses related to projects that are designed to increase or enhance current production and exploration. We note that as current resources are depleted, exploration and advanced projects are necessary for us to replace the depleting reserves or enhance the recovery and processing of the current reserves. As this relates to sustaining our production, and is considered a continuing cost of a mining company, these costs are included in the AISC measure. These costs are derived from the Advanced projects, research and development and Exploration amounts presented in the Condensed Consolidated Statements of Operations less the amount attributable to the production of copper at our Phoenix and Boddington mines. The allocation of these costs to gold and copper is determined using the same allocation used in the allocation of CAS between gold and copper at the Phoenix and Boddington mines.
General and administrative. Includes costs related to administrative tasks not directly related to current production, but rather related to support our corporate structure and fulfill our obligations to operate as a public company. Including these expenses in the AISC metric provides visibility of the impact that general and administrative activities have on current operations and profitability on a per ounce basis.
Other expense, net. We exclude certain exceptional or unusual expenses from Other expense, net, such as restructuring, as these are not indicative to sustaining our current operations. Furthermore, this adjustment to Other expense, net is also consistent with the nature of the adjustments made to Net income (loss) attributable to Newmont stockholders as disclosed in the Company’s non-GAAP financial measure Adjusted net income (loss). The allocation of these costs to gold and copper is determined using the same allocation used in the allocation of CAS between gold and copper at the Phoenix and Boddington mines.
Treatment and refining costs. Includes costs paid to smelters for treatment and refining of our concentrates to produce the salable metal. These costs are presented net as a reduction of Sales on our Condensed Consolidated Statements of Operations.
Sustaining capital. We determined sustaining capital as those capital expenditures that are necessary to maintain current production and execute the current mine plan. Capital expenditures to develop new operations, or related to projects at existing operations where these projects will enhance production or reserves, are generally considered development. We determined the classification of sustaining and development capital projects based on a systematic review of our project portfolio in light of the nature of each project. Sustaining capital costs are relevant to the AISC metric as these are needed to maintain the Company’s current operations and provide improved transparency related to our ability to finance these expenditures from current operations. The allocation of these costs to gold and copper is determined using the same allocation used in the allocation of CAS between gold and copper at the Phoenix and Boddington mines.
Newmont Mining Corporation I Investor Presentation I Slide 64November 2017
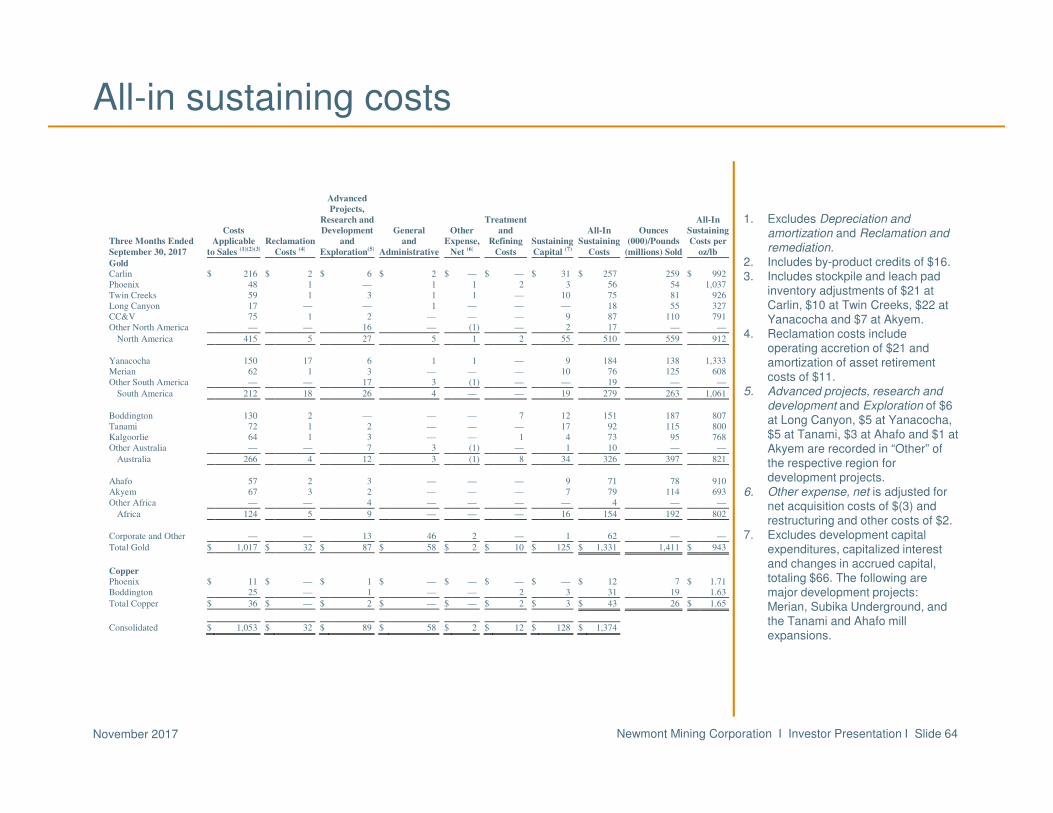
All-in sustaining costs
1. Excludes Depreciation and amortization and Reclamation and remediation.
2. Includes by-product credits of $16. 3. Includes stockpile and leach pad
inventory adjustments of $21 at Carlin, $10 at Twin Creeks, $22 at Yanacocha and $7 at Akyem.
4. Reclamation costs include operating accretion of $21 and amortization of asset retirement costs of $11.
5. Advanced projects, research and development and Exploration of $6 at Long Canyon, $5 at Yanacocha, $5 at Tanami, $3 at Ahafo and $1 at Akyem are recorded in “Other” of the respective region for development projects.
6. Other expense, net is adjusted for net acquisition costs of $(3) and restructuring and other costs of $2.
7. Excludes development capital expenditures, capitalized interest and changes in accrued capital, totaling $66. The following are major development projects: Merian, Subika Underground, and the Tanami and Ahafo mill expansions.
Advanced
Projects,
Research and Treatment All-In
Costs Development General Other and All-In Ounces Sustaining
Three Months Ended Applicable Reclamation and and Expense, Refining Sustaining Sustaining (000)/Pounds Costs per
September 30, 2017 to Sales (1)(2)(3) Costs (4) Exploration(5) Administrative Net (6) Costs Capital (7) Costs (millions) Sold oz/lb
Gold Carlin $ 216 $ 2 $ 6 $ 2 $ — $ — $ 31 $ 257 259 $ 992 Phoenix 48 1 — 1 1 2 3 56 54 1,037 Twin Creeks 59 1 3 1 1 — 10 75 81 926 Long Canyon 17 — — 1 — — — 18 55 327 CC&V 75 1 2 — — — 9 87 110 791 Other North America — — 16 — (1) — 2 17 — —
North America 415 5 27 5 1 2 55 510 559 912
Yanacocha 150 17 6 1 1 — 9 184 138 1,333 Merian 62 1 3 — — — 10 76 125 608 Other South America — — 17 3 (1) — — 19 — —
South America 212 18 26 4 — — 19 279 263 1,061
Boddington 130 2 — — — 7 12 151 187 807 Tanami 72 1 2 — — — 17 92 115 800 Kalgoorlie 64 1 3 — — 1 4 73 95 768 Other Australia — — 7 3 (1) — 1 10 — —
Australia 266 4 12 3 (1) 8 34 326 397 821
Ahafo 57 2 3 — — — 9 71 78 910 Akyem 67 3 2 — — — 7 79 114 693 Other Africa — — 4 — — — — 4 — —
Africa 124 5 9 — — — 16 154 192 802
Corporate and Other — — 13 46 2 — 1 62 — —
Total Gold $ 1,017 $ 32 $ 87 $ 58 $ 2 $ 10 $ 125 $ 1,331 1,411 $ 943
Copper Phoenix $ 11 $ — $ 1 $ — $ — $ — $ — $ 12 7 $ 1.71 Boddington 25 — 1 — — 2 3 31 19 1.63
Total Copper $ 36 $ — $ 2 $ — $ — $ 2 $ 3 $ 43 26 $ 1.65
Consolidated $ 1,053 $ 32 $ 89 $ 58 $ 2 $ 12 $ 128 $ 1,374
Newmont Mining Corporation I Investor Presentation I Slide 65November 2017
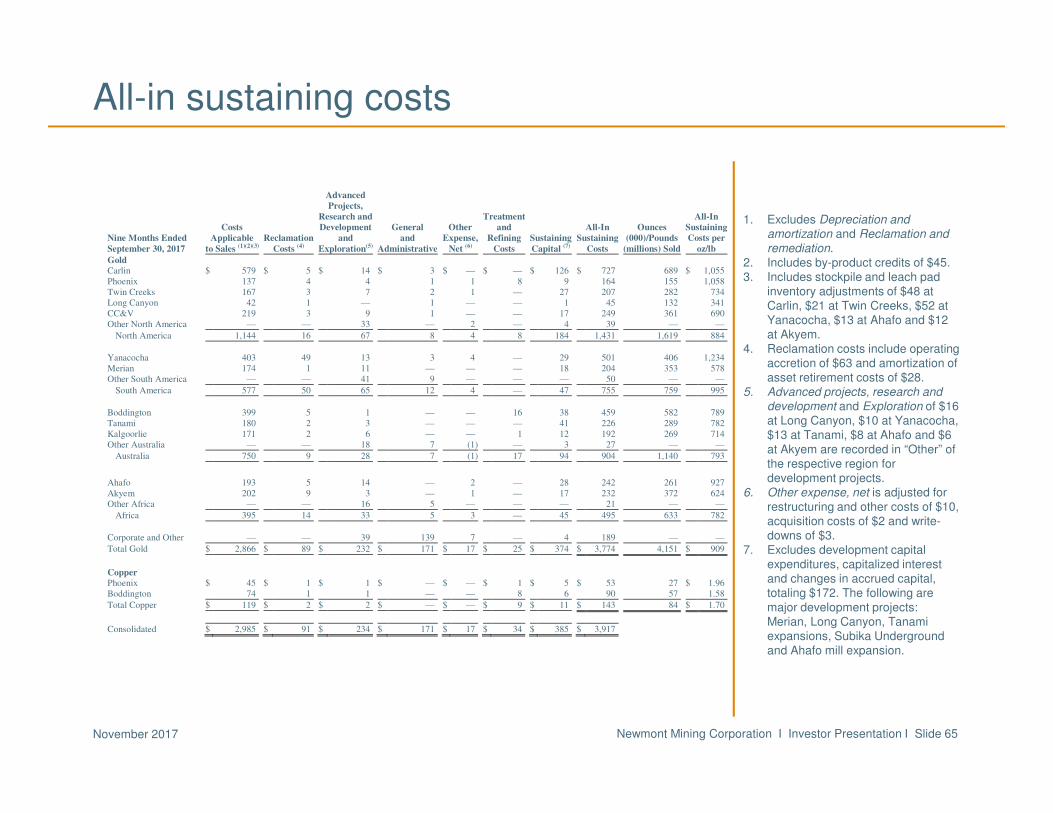
All-in sustaining costs
1. Excludes Depreciation and amortization and Reclamation and remediation.
2. Includes by-product credits of $45. 3. Includes stockpile and leach pad
inventory adjustments of $48 at Carlin, $21 at Twin Creeks, $52 at Yanacocha, $13 at Ahafo and $12 at Akyem.
4. Reclamation costs include operating accretion of $63 and amortization of asset retirement costs of $28.
5. Advanced projects, research and development and Exploration of $16 at Long Canyon, $10 at Yanacocha, $13 at Tanami, $8 at Ahafo and $6 at Akyem are recorded in “Other” of the respective region for development projects.
6. Other expense, net is adjusted for restructuring and other costs of $10, acquisition costs of $2 and write-downs of $3.
7. Excludes development capital expenditures, capitalized interest and changes in accrued capital, totaling $172. The following are major development projects: Merian, Long Canyon, Tanami expansions, Subika Underground and Ahafo mill expansion.
Advanced Projects, Research and Treatment All-In Costs Development General Other and All-In Ounces Sustaining Nine Months Ended Applicable Reclamation and and Expense, Refining Sustaining Sustaining (000)/Pounds Costs per
September 30, 2017 to Sales (1)(2)(3) Costs (4) Exploration(5) Administrative Net (6) Costs Capital (7) Costs (millions) Sold oz/lb
Gold Carlin $ 579 $ 5 $ 14 $ 3 $ — $ — $ 126 $ 727 689 $ 1,055 Phoenix 137 4 4 1 1 8 9 164 155 1,058 Twin Creeks 167 3 7 2 1 — 27 207 282 734 Long Canyon 42 1 — 1 — — 1 45 132 341 CC&V 219 3 9 1 — — 17 249 361 690 Other North America — — 33 — 2 — 4 39 — —
North America 1,144 16 67 8 4 8 184 1,431 1,619 884
Yanacocha 403 49 13 3 4 — 29 501 406 1,234 Merian 174 1 11 — — — 18 204 353 578 Other South America — — 41 9 — — — 50 — —
South America 577 50 65 12 4 — 47 755 759 995
Boddington 399 5 1 — — 16 38 459 582 789 Tanami 180 2 3 — — — 41 226 289 782 Kalgoorlie 171 2 6 — — 1 12 192 269 714 Other Australia — — 18 7 (1) — 3 27 — —
Australia 750 9 28 7 (1) 17 94 904 1,140 793
Ahafo 193 5 14 — 2 — 28 242 261 927 Akyem 202 9 3 — 1 — 17 232 372 624 Other Africa — — 16 5 — — — 21 — —
Africa 395 14 33 5 3 — 45 495 633 782
Corporate and Other — — 39 139 7 — 4 189 — —
Total Gold $ 2,866 $ 89 $ 232 $ 171 $ 17 $ 25 $ 374 $ 3,774 4,151 $ 909
Copper Phoenix $ 45 $ 1 $ 1 $ — $ — $ 1 $ 5 $ 53 27 $ 1.96 Boddington 74 1 1 — — 8 6 90 57 1.58
Total Copper $ 119 $ 2 $ 2 $ — $ — $ 9 $ 11 $ 143 84 $ 1.70
Consolidated $ 2,985 $ 91 $ 234 $ 171 $ 17 $ 34 $ 385 $ 3,917
Newmont Mining Corporation I Investor Presentation I Slide 66November 2017
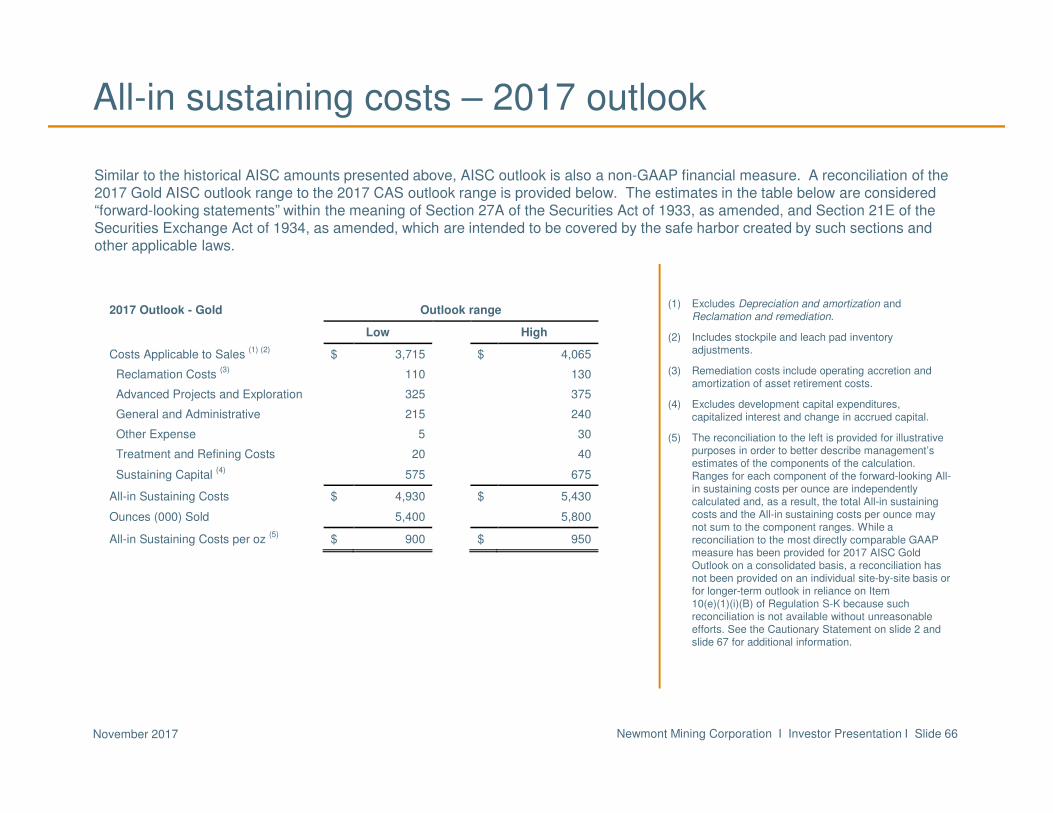
All-in sustaining costs – 2017 outlook
(1) Excludes Depreciation and amortization andReclamation and remediation.
(2) Includes stockpile and leach pad inventory adjustments.
(3) Remediation costs include operating accretion and amortization of asset retirement costs.
(4) Excludes development capital expenditures, capitalized interest and change in accrued capital.
(5) The reconciliation to the left is provided for illustrative purposes in order to better describe management’s estimates of the components of the calculation. Ranges for each component of the forward-looking All-in sustaining costs per ounce are independently calculated and, as a result, the total All-in sustaining costs and the All-in sustaining costs per ounce may not sum to the component ranges. While a reconciliation to the most directly comparable GAAP measure has been provided for 2017 AISC Gold Outlook on a consolidated basis, a reconciliation has not been provided on an individual site-by-site basis or for longer-term outlook in reliance on Item 10(e)(1)(i)(B) of Regulation S-K because such reconciliation is not available without unreasonable efforts. See the Cautionary Statement on slide 2 and slide 67 for additional information.
Similar to the historical AISC amounts presented above, AISC outlook is also a non-GAAP financial measure. A reconciliation of the 2017 Gold AISC outlook range to the 2017 CAS outlook range is provided below. The estimates in the table below are considered “forward-looking statements” within the meaning of Section 27A of the Securities Act of 1933, as amended, and Section 21E of theSecurities Exchange Act of 1934, as amended, which are intended to be covered by the safe harbor created by such sections andother applicable laws.
2017 Outlook - Gold Outlook range
Low High
Costs Applicable to Sales (1) (2)
$ 3,715 $ 4,065
Reclamation Costs (3)
110 130
Advanced Projects and Exploration 325 375
General and Administrative 215 240
Other Expense 5 30
Treatment and Refining Costs 20 40
Sustaining Capital (4)
575 675
All-in Sustaining Costs $ 4,930 $ 5,430
Ounces (000) Sold 5,400 5,800
All-in Sustaining Costs per oz (5)
$ 900 $ 950
Newmont Mining Corporation I Investor Presentation I Slide 67November 2017
Endnotes
Investors are encouraged to read the information contained in this presentation in conjunction with the following notes, the Cautionary Statement on slide 2 and the factors described under the “Risk Factors” section of the Company’s Form 10-K, filed with the SEC on or about February 21, 2017, and Form 10-Q filed with the SEC on October 26, 2017, and disclosure in the Company’s other recent SEC filings.
1. Outlook projections used in this presentation are considered forward-looking statements and represent management’s good faith estimates or expectations of future production results as of October 26, 2017. Outlook is based upon certain assumptions, including, but not limited to, metal prices, oil prices, certain exchange rates and other assumptions. For example, 2017 Outlook assumes $1,200/oz Au, $2.50/lb Cu, $0.75 USD/AUD exchange rate and $55/barrel WTI; AISC and CAS estimates do not include inflation, for the remainder of the year. Production, AISC and capital estimates exclude projects that have not yet been approved. The potential impact on inventory valuation as a result of lower prices, input costs, and project decisions are not included as part of this Outlook. Assumptions used for purposes of Outlook may prove to be incorrect and actual results may differ materially from those anticipated. Consequently, Outlook cannot be guaranteed. As such, investors are cautioned not to place undue reliance upon Outlook and forward-looking statements as there can be no assurance that the plans, assumptions or expectations upon which they are placed will occur.
2. Historical AISC or All-in sustaining cost is a non-GAAP metric. See slides 63 to 66 for more information and a reconciliation to the nearest GAAP metric. All-in sustaining cost (“AISC”) as used in the Company’s Outlook is a non-GAAP metric defined as the sum of cost applicable to sales (including all direct and indirect costs related to current gold production incurred to execute on the current mine plan), reclamation costs (including operating accretion and amortization of asset retirement costs), G&A, exploration expense, advanced projects and R&D, treatment and refining costs, other expense, net of one-time adjustments and sustaining capital. See also note 1 above.
3. Adjusted Net Income is a non-GAAP metric. Adjusted Net Income per share refers to Adjusted Net Income per diluted share. See slides 59 and 60 for more information and reconciliation to the nearest GAAP metric.
4. EBITDA is a non-GAAP financial measure calculated as Earnings before interest, taxes and depreciation and amortization. The EBITDA figures for competitors used in this presentation were calculated by Thomson Reuters. For management’s EBITDA calculations and reconciliation to the nearest GAAP metric, please see slide 61 for more information. Adjusted EBITDA is also a non-GAAP metric. Please refer also to slide 61 for a reconciliation of Adjusted EBITDA to the nearest GAAP metric.
5. Free cash flow is a non-GAAP metric and is generated from Net cash provided by (used in) operating activities of continuing operations less Additions to property, plant and mine development. See slide 62 for more information and for a reconciliation to the nearest GAAP metric.
6. U.S. investors are reminded that reserves were prepared in compliance with Industry Guide 7 published by the SEC. Whereas, the term resource, measured resource, indicated resources and inferred resources are not SEC recognized terms. Newmont has determined that such resources would be substantively the same as those prepared using the Guidelines established by the Society of Mining, Metallurgy and Exploration and defined as Mineral Resource. Estimates of resources are subject to further exploration and development, are subject to additional risks, and no assurance can be given that they will eventually convert to future reserves. Inferred resources, in particular, have a great amount of uncertainty as to their existence and their economic and legal feasibility. Investors are cautioned not to assume that any part or all of the inferred resource exists, or is economically or legally mineable. Inventory and upside potential have a greater amount of uncertainty. Investors are cautioned that drill results illustrated in certain graphics in this presentation are not necessarily indicative of future results or future production. Even if significant mineralization is discovered and converted to reserves, during the time necessary to ultimately move such mineralization to production the economic and legal feasibility of production may change. As such, investors are cautioned against relying upon those estimates. For more information regarding the Company’s reserves, see the Company’s Annual Report filed with the SEC on February 21, 2017 for the Proven and Probable reserve tables prepared in compliance with the SEC’s Industry Guide 7, which is available at www.sec.gov or on the Company’s website. Investors are further reminded that the reserve and resource estimates used in this presentation are estimates as of December 31, 2016.