Embed Size (px)
Citation preview

Date
1
BGC PARTNERS, INC.NASDAQ: BGCPGeneral Investor Presentation March 2017

Date
2
DISCLAIMER
Discussion of Forward-Looking Statements by BGC Partners
Statements in this document regarding BGC that are not historical facts are "forward-looking statements" that involve risks and uncertainties. Except as
required by law, BGC undertakes no obligation to update any forward-looking statements. For a discussion of additional risks and uncertainties, which
could cause actual results to differ from those contained in the forward-looking statements, see BGC's Securities and Exchange Commission filings,
including, but not limited to, the risk factors set forth in the most recent Form 10-K and any updates to such risk factors contained in subsequent Forms
10-Q or Forms 8-K.
Note Regarding Financial Tables and Metrics
Excel files with the Company’s quarterly financial results and metrics from the current period dating back to the full year 2008 are accessible in the
various financial results press releases at the “Investor Relations” section of http://www.bgcpartners.com. They are also available directly at
ir.bgcpartners.com/news-releases/news-releases.
Other Items
“Newmark Grubb Knight Frank” is synonymous in this document with “NGKF” or “Real Estate Services.”
Our discussion of financial results for “Newmark Grubb Knight Frank,” “NGKF,” or “Real Estate Services” reflects only those businesses owned by us
and does not include the results for Knight Frank or for the independently-owned offices that use some variation of the NGKF name in their branding or
marketing.
For the purposes of this document, all of the Company’s fully electronic businesses in the Financial Services segment may be referred to
interchangeably as “FENICS.” This includes fees from fully electronic brokerage, as well as data, software, and post-trade services (formerly known as
“market data and software solutions”) across both BGC and GFI. FENICS results do not include those of Trayport, which are reported separately due to
its sale to Intercontinental Exchange, Inc. (“ICE”) for approximately 2.5 million ICE common shares in December of 2015. Trayport generated gross
revenues of approximately $80 million for the trailing twelve months ended September 30, 2015 and had a pre-tax earnings margin of nearly 45 percent.
On June 28, 2013, BGC sold its fully electronic trading platform for benchmark U.S. Treasury Notes and Bonds to Nasdaq Inc. For the purposes of this
document, the assets sold may be referred to as “eSpeed,” and the businesses remaining with BGC that were not part of the eSpeed sale may be
referred to as "retained" or "FENICS".
Beginning on February 27, 2015, BGC began consolidating the results of GFI, which continues to operate as a controlled company and as a separately
branded division of BGC. BGC owned approximately 67% of GFI’s outstanding common shares as of December 31, 2015. On January 12, 2016, BGC
completed the merger of GFI by acquiring 100% of GFI's outstanding shares.
BGC, BGC Trader, GFI, FENICS, FENICS.COM, Capitalab, Lucera, Swaptioniser, Newmark, Grubb & Ellis, ARA, Computerized Facility Integration,
Landauer, Excess Space, Excess Space Retail Services, Inc., and Grubb are trademarks/service marks and/or registered trademarks/service marks of
BGC Partners, Inc. and/or its affiliates. Knight Frank is a service mark of Knight Frank (Nominees) Limited.© 2016 BGC Partners, Inc. All rights reserved.
2
Date
DISCLAIMER (CONTINUED)
3
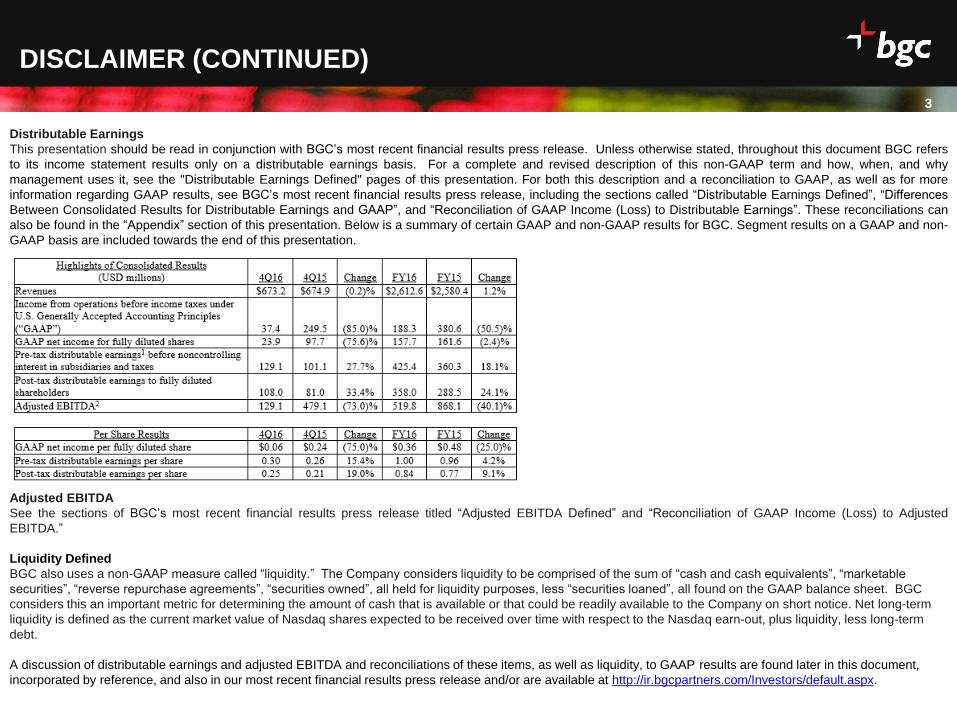
Distributable Earnings
This presentation should be read in conjunction with BGC’s most recent financial results press release. Unless otherwise stated, throughout this document BGC refers
to its income statement results only on a distributable earnings basis. For a complete and revised description of this non-GAAP term and how, when, and why
management uses it, see the "Distributable Earnings Defined" pages of this presentation. For both this description and a reconciliation to GAAP, as well as for more
information regarding GAAP results, see BGC’s most recent financial results press release, including the sections called “Distributable Earnings Defined”, “Differences
Between Consolidated Results for Distributable Earnings and GAAP”, and “Reconciliation of GAAP Income (Loss) to Distributable Earnings”. These reconciliations can
also be found in the “Appendix” section of this presentation. Below is a summary of certain GAAP and non-GAAP results for BGC. Segment results on a GAAP and non-
GAAP basis are included towards the end of this presentation.
Adjusted EBITDA
See the sections of BGC’s most recent financial results press release titled “Adjusted EBITDA Defined” and “Reconciliation of GAAP Income (Loss) to Adjusted
EBITDA.”
Liquidity Defined
BGC also uses a non-GAAP measure called “liquidity.” The Company considers liquidity to be comprised of the sum of “cash and cash equivalents”, “marketable
securities”, “reverse repurchase agreements”, “securities owned”, all held for liquidity purposes, less “securities loaned”, all found on the GAAP balance sheet. BGC
considers this an important metric for determining the amount of cash that is available or that could be readily available to the Company on short notice. Net long-term
liquidity is defined as the current market value of Nasdaq shares expected to be received over time with respect to the Nasdaq earn-out, plus liquidity, less long-term
debt.
A discussion of distributable earnings and adjusted EBITDA and reconciliations of these items, as well as liquidity, to GAAP results are found later in this document,
incorporated by reference, and also in our most recent financial results press release and/or are available at http://ir.bgcpartners.com/Investors/default.aspx.

Date
4
GENERAL OVERVIEW
BGC PARTNERS
Date
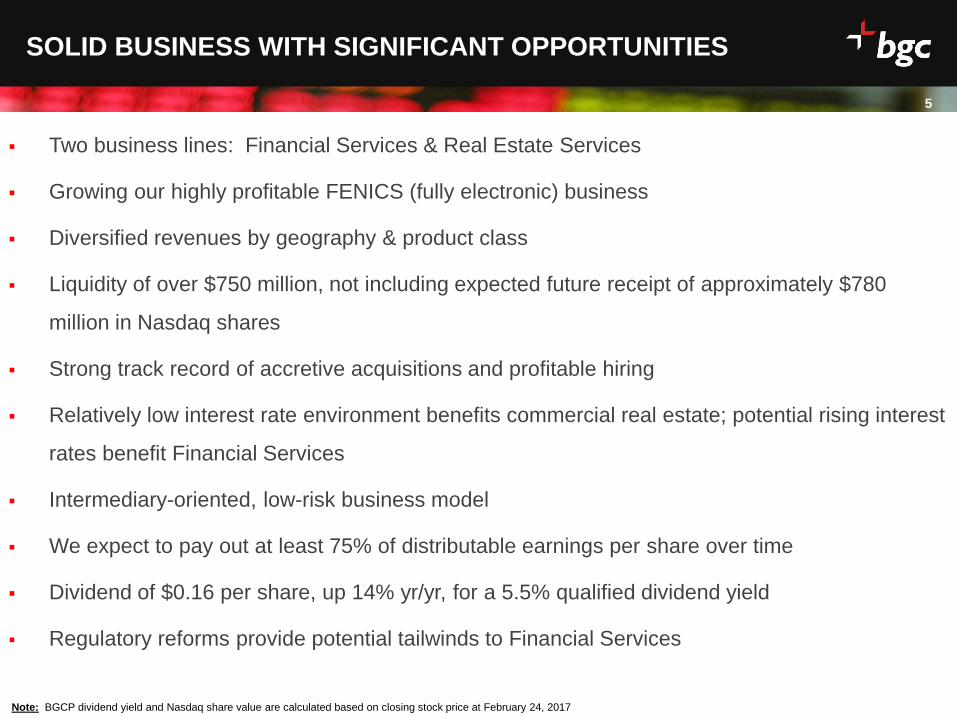
SOLID BUSINESS WITH SIGNIFICANT OPPORTUNITIES
Two business lines: Financial Services & Real Estate Services
Growing our highly profitable FENICS (fully electronic) business
Diversified revenues by geography & product class
Liquidity of over $750 million, not including expected future receipt of approximately $780
million in Nasdaq shares
Strong track record of accretive acquisitions and profitable hiring
Relatively low interest rate environment benefits commercial real estate; potential rising interest
rates benefit Financial Services
Intermediary-oriented, low-risk business model
We expect to pay out at least 75% of distributable earnings per share over time
Dividend of $0.16 per share, up 14% yr/yr, for a 5.5% qualified dividend yield
Regulatory reforms provide potential tailwinds to Financial Services
Note: BGCP dividend yield and Nasdaq share value are calculated based on closing stock price at February 24, 2017
5
Date
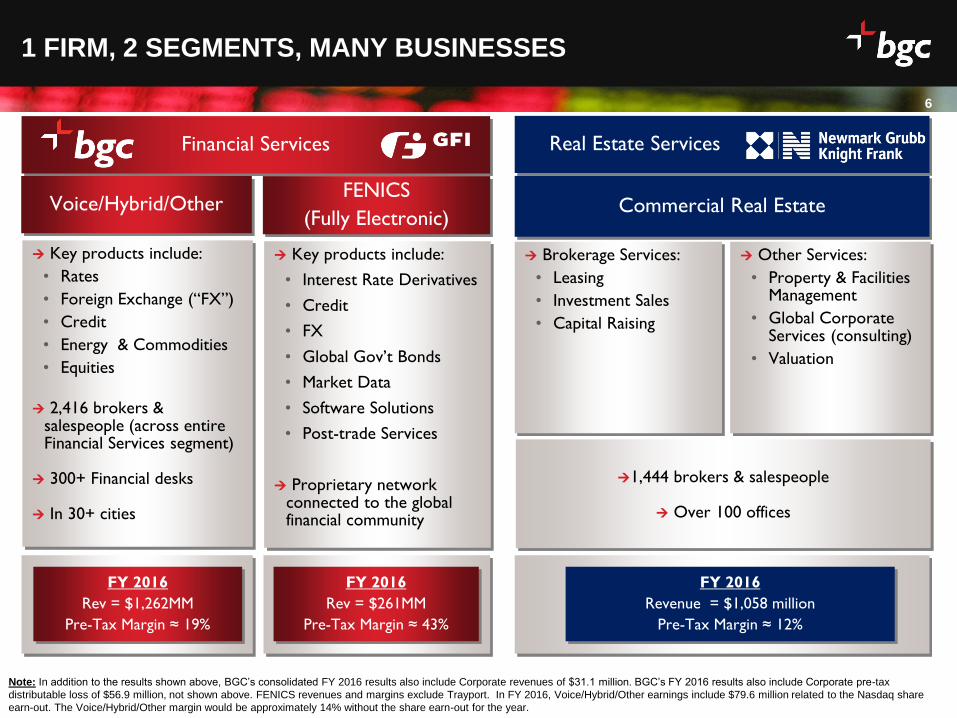
1 FIRM, 2 SEGMENTS, MANY BUSINESSES
Note: In addition to the results shown above, BGC’s consolidated FY 2016 results also include Corporate revenues of $31.1 million. BGC’s FY 2016 results also include Corporate pre-tax
distributable loss of $56.9 million, not shown above. FENICS revenues and margins exclude Trayport. In FY 2016, Voice/Hybrid/Other earnings include $79.6 million related to the Nasdaq share
earn-out. The Voice/Hybrid/Other margin would be approximately 14% without the share earn-out for the year.
6
Financial Services
Voice/Hybrid/OtherFENICS
(Fully Electronic)
Key products include:
• Rates
• Foreign Exchange (“FX”)
• Credit
• Energy & Commodities
• Equities
2,416 brokers & salespeople (across entire Financial Services segment)
300+ Financial desks
In 30+ cities
Key products include:
• Interest Rate Derivatives
• Credit
• FX
• Global Gov’t Bonds
• Market Data
• Software Solutions
• Post-trade Services
Proprietary network connected to the global financial community
FY 2016
Rev = $1,262MM
Pre-Tax Margin ≈ 19%
FY 2016
Rev = $261MM
Pre-Tax Margin ≈ 43%
Real Estate Services
Commercial Real Estate
Brokerage Services:
• Leasing
• Investment Sales
• Capital Raising
Other Services:
• Property & Facilities Management
• Global Corporate Services (consulting)
• Valuation
1,444 brokers & salespeople
Over 100 offices
FY 2016
Revenue = $1,058 million
Pre-Tax Margin ≈ 12%
Date
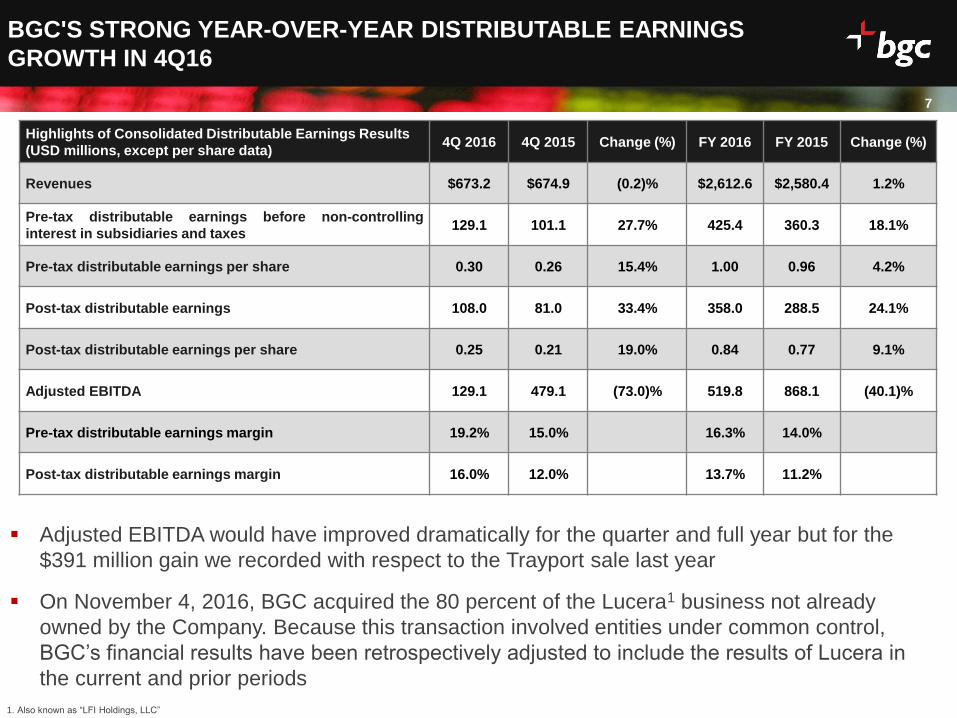
BGC'S STRONG YEAR-OVER-YEAR DISTRIBUTABLE EARNINGS
GROWTH IN 4Q16
7
Highlights of Consolidated Distributable Earnings Results
(USD millions, except per share data)4Q 2016 4Q 2015 Change (%) FY 2016 FY 2015 Change (%)
Revenues $673.2 $674.9 (0.2)% $2,612.6 $2,580.4 1.2%
Pre-tax distributable earnings before non-controlling
interest in subsidiaries and taxes129.1 101.1 27.7% 425.4 360.3 18.1%
Pre-tax distributable earnings per share 0.30 0.26 15.4% 1.00 0.96 4.2%
Post-tax distributable earnings 108.0 81.0 33.4% 358.0 288.5 24.1%
Post-tax distributable earnings per share 0.25 0.21 19.0% 0.84 0.77 9.1%
Adjusted EBITDA 129.1 479.1 (73.0)% 519.8 868.1 (40.1)%
Pre-tax distributable earnings margin 19.2% 15.0% 16.3% 14.0%
Post-tax distributable earnings margin 16.0% 12.0% 13.7% 11.2%
Adjusted EBITDA would have improved dramatically for the quarter and full year but for the
$391 million gain we recorded with respect to the Trayport sale last year
On November 4, 2016, BGC acquired the 80 percent of the Lucera1 business not already
owned by the Company. Because this transaction involved entities under common control,
BGC’s financial results have been retrospectively adjusted to include the results of Lucera in
the current and prior periods
1. Also known as “LFI Holdings, LLC”
Date
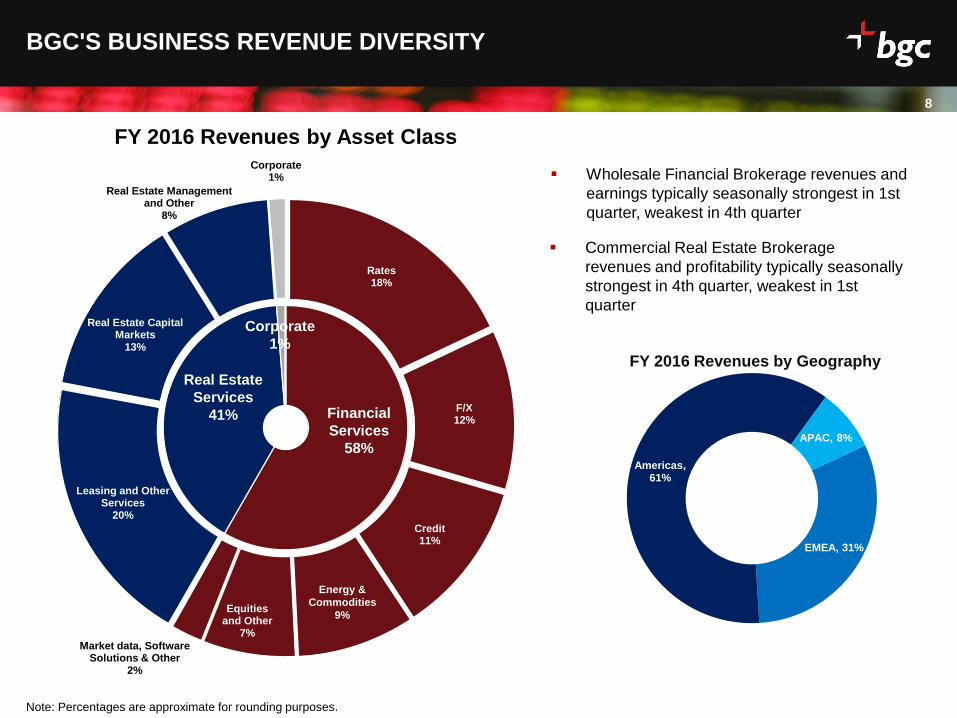
Rates18%
F/X12%
Credit11%
Equitiesand Other
7%
Market data, Software Solutions & Other
2%
Leasing and Other Services
20%
Real Estate Capital Markets
13%
Real Estate Management and Other
8%
Corporate1%
Financial
Services
58%
Real Estate
Services
41%
Corporate
1%
Energy &
Commodities
9%
8
BGC'S BUSINESS REVENUE DIVERSITY
8Note: Percentages are approximate for rounding purposes.
Wholesale Financial Brokerage revenues and
earnings typically seasonally strongest in 1st
quarter, weakest in 4th quarter
Commercial Real Estate Brokerage
revenues and profitability typically seasonally
strongest in 4th quarter, weakest in 1st
quarter
FY 2016 Revenues by Asset Class
EMEA, 31%
Americas, 61%
APAC, 8%
FY 2016 Revenues by Geography
Date
9
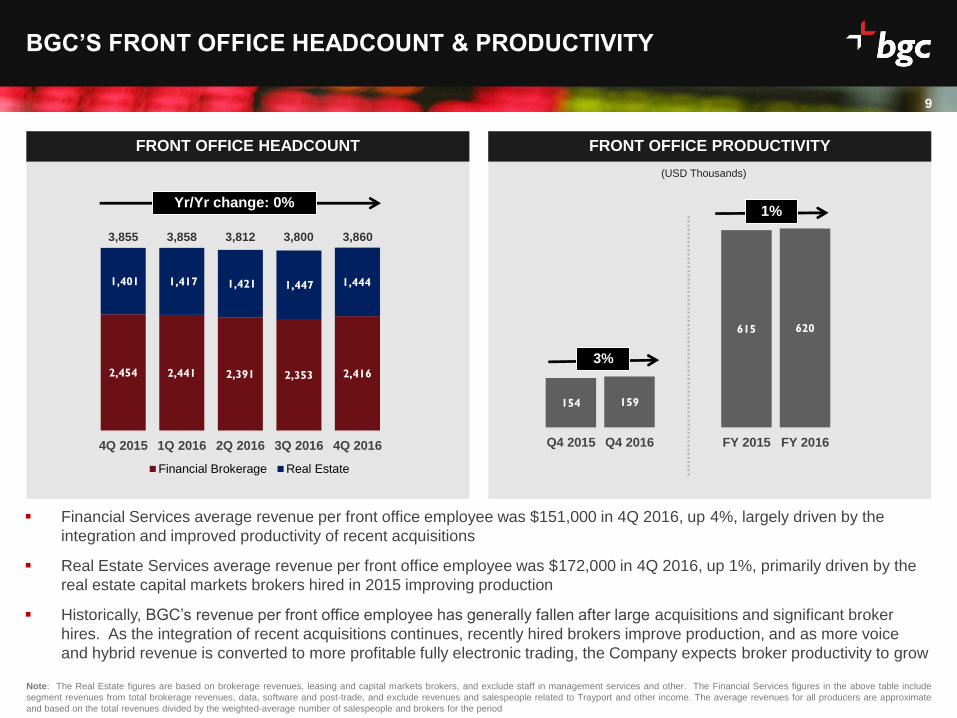
2,454 2,441 2,391 2,353 2,416
1,401 1,417 1,421 1,447 1,444
4Q 2015 1Q 2016 2Q 2016 3Q 2016 4Q 2016
Financial Brokerage Real Estate
Financial Services average revenue per front office employee was $151,000 in 4Q 2016, up 4%, largely driven by the
integration and improved productivity of recent acquisitions
Real Estate Services average revenue per front office employee was $172,000 in 4Q 2016, up 1%, primarily driven by the
real estate capital markets brokers hired in 2015 improving production
Historically, BGC’s revenue per front office employee has generally fallen after large acquisitions and significant broker
hires. As the integration of recent acquisitions continues, recently hired brokers improve production, and as more voice
and hybrid revenue is converted to more profitable fully electronic trading, the Company expects broker productivity to grow
BGC’S FRONT OFFICE HEADCOUNT & PRODUCTIVITY
FRONT OFFICE HEADCOUNT
Note: The Real Estate figures are based on brokerage revenues, leasing and capital markets brokers, and exclude staff in management services and other. The Financial Services figures in the above table include
segment revenues from total brokerage revenues, data, software and post-trade, and exclude revenues and salespeople related to Trayport and other income. The average revenues for all producers are approximate
and based on the total revenues divided by the weighted-average number of salespeople and brokers for the period
FRONT OFFICE PRODUCTIVITY
Yr/Yr change: 0%
154 159
615 620
Q4 2015 Q4 2016 FY 2015 FY 2016
3%
1%
(USD Thousands)
3,8003,855 3,858 3,812 3,860
Date
10
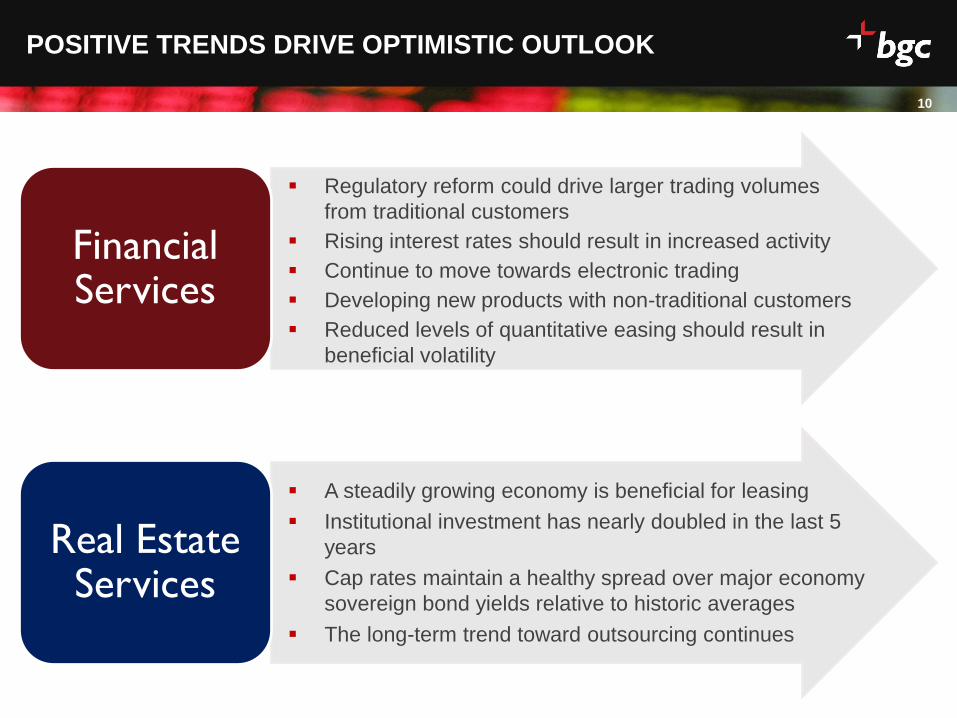
POSITIVE TRENDS DRIVE OPTIMISTIC OUTLOOK
Financial Services
Real Estate Services
Regulatory reform could drive larger trading volumes
from traditional customers
Rising interest rates should result in increased activity
Continue to move towards electronic trading
Developing new products with non-traditional customers
Reduced levels of quantitative easing should result in
beneficial volatility
A steadily growing economy is beneficial for leasing
Institutional investment has nearly doubled in the last 5
years
Cap rates maintain a healthy spread over major economy
sovereign bond yields relative to historic averages
The long-term trend toward outsourcing continues

Date
11
Overview
FINANCIAL SERVICES
Date
12
4Q 2016 FINANCIAL SERVICES SUMMARY
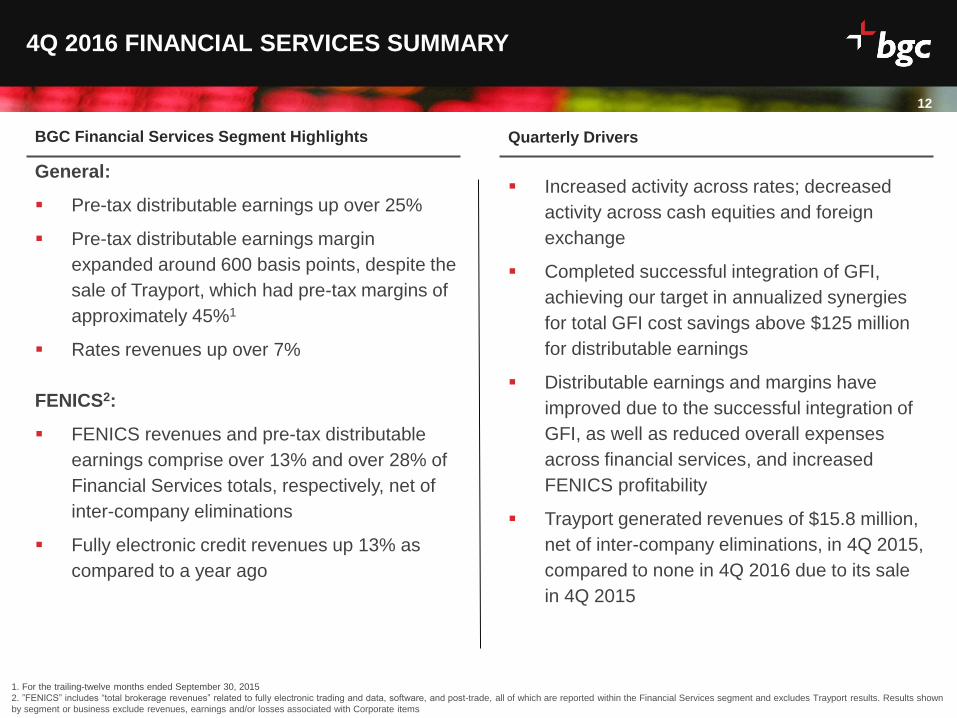
BGC Financial Services Segment Highlights
General:
Pre-tax distributable earnings up over 25%
Pre-tax distributable earnings margin
expanded around 600 basis points, despite the
sale of Trayport, which had pre-tax margins of
approximately 45%1
Rates revenues up over 7%
FENICS2:
FENICS revenues and pre-tax distributable
earnings comprise over 13% and over 28% of
Financial Services totals, respectively, net of
inter-company eliminations
Fully electronic credit revenues up 13% as
compared to a year ago
Quarterly Drivers
Increased activity across rates; decreased
activity across cash equities and foreign
exchange
Completed successful integration of GFI,
achieving our target in annualized synergies
for total GFI cost savings above $125 million
for distributable earnings
Distributable earnings and margins have
improved due to the successful integration of
GFI, as well as reduced overall expenses
across financial services, and increased
FENICS profitability
Trayport generated revenues of $15.8 million,
net of inter-company eliminations, in 4Q 2015,
compared to none in 4Q 2016 due to its sale
in 4Q 2015
1. For the trailing-twelve months ended September 30, 2015
2. ”FENICS” includes “total brokerage revenues” related to fully electronic trading and data, software, and post-trade, all of which are reported within the Financial Services segment and excludes Trayport results. Results shown
by segment or business exclude revenues, earnings and/or losses associated with Corporate items
Date
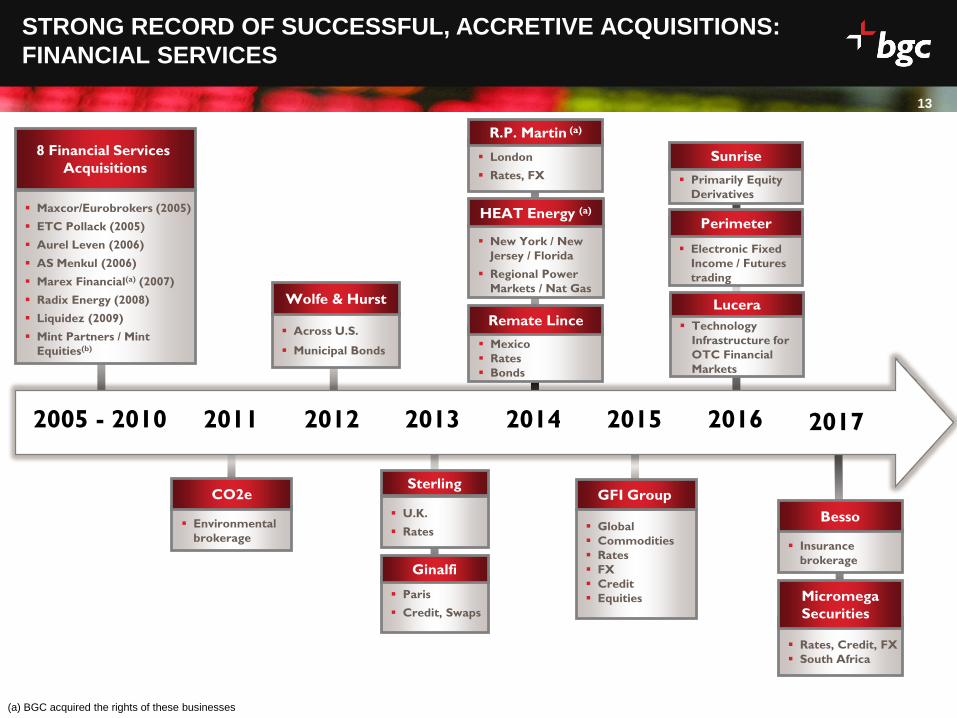
STRONG RECORD OF SUCCESSFUL, ACCRETIVE ACQUISITIONS:
FINANCIAL SERVICES
Across U.S.
Municipal Bonds
Wolfe & Hurst
Paris
Credit, Swaps
Ginalfi
U.K.
Rates
Sterling
Environmental
brokerage
CO2e
Global
Commodities
Rates
FX
Credit
Equities
GFI Group
(a) BGC acquired the rights of these businesses
13
New York / New
Jersey / Florida
Regional Power
Markets / Nat Gas
Mexico
Rates
Bonds
Remate Lince
London
Rates, FX
R.P. Martin (a)
HEAT Energy (a)
20132011 2012 2014 2015 2016
Electronic Fixed
Income / Futures
trading
Perimeter
Technology
Infrastructure for
OTC Financial
Markets
Lucera
Primarily Equity
Derivatives
Sunrise
Maxcor/Eurobrokers (2005)
ETC Pollack (2005)
Aurel Leven (2006)
AS Menkul (2006)
Marex Financial(a) (2007)
Radix Energy (2008)
Liquidez (2009)
Mint Partners / Mint
Equities(b)
8 Financial Services
Acquisitions
20172005 - 2010
Insurance
brokerage
Besso
Rates, Credit, FX
South Africa
Micromega
Securities
Date
14
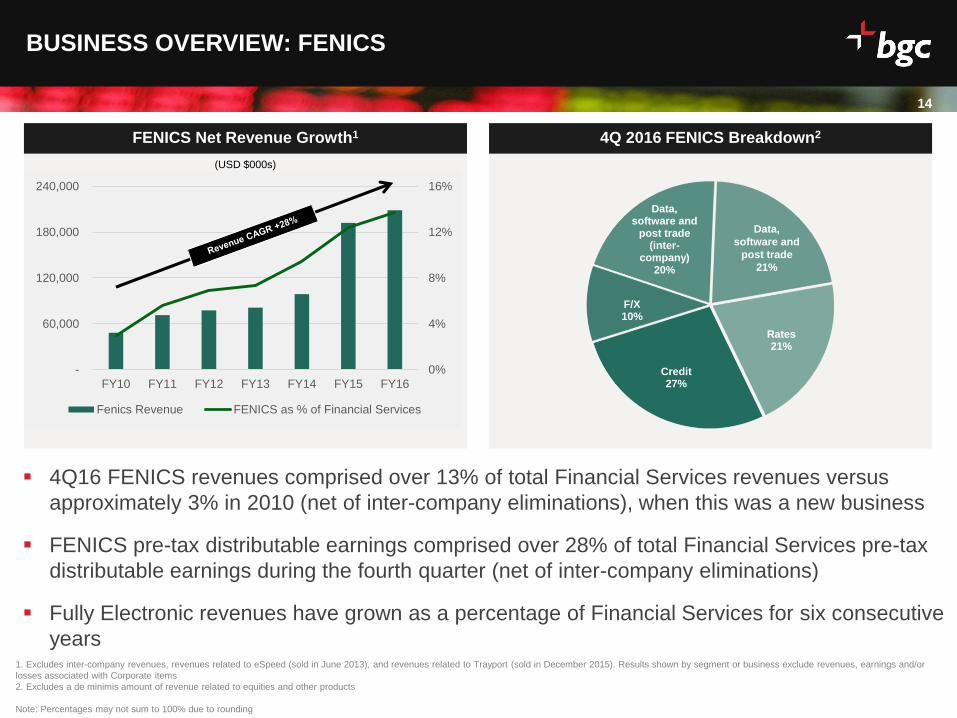
FENICS Net Revenue Growth1 4Q 2016 FENICS Breakdown2
BUSINESS OVERVIEW: FENICS
4Q16 FENICS revenues comprised over 13% of total Financial Services revenues versus
approximately 3% in 2010 (net of inter-company eliminations), when this was a new business
FENICS pre-tax distributable earnings comprised over 28% of total Financial Services pre-tax
distributable earnings during the fourth quarter (net of inter-company eliminations)
Fully Electronic revenues have grown as a percentage of Financial Services for six consecutive
years
Rates21%
Credit27%
F/X10%
Data, software and
post trade (inter-
company)20%
Data,
software and
post trade
21%
1. Excludes inter-company revenues, revenues related to eSpeed (sold in June 2013), and revenues related to Trayport (sold in December 2015). Results shown by segment or business exclude revenues, earnings and/or
losses associated with Corporate items
2. Excludes a de minimis amount of revenue related to equities and other products
Note: Percentages may not sum to 100% due to rounding
(USD $000s)
0%
4%
8%
12%
16%
-
60,000
120,000
180,000
240,000
FY10 FY11 FY12 FY13 FY14 FY15 FY16
Fenics Revenue FENICS as % of Financial Services
Date
0
50
100
2008 2011 2015 2020
Global AUM$US Trillions
Pro
jecte
d
15
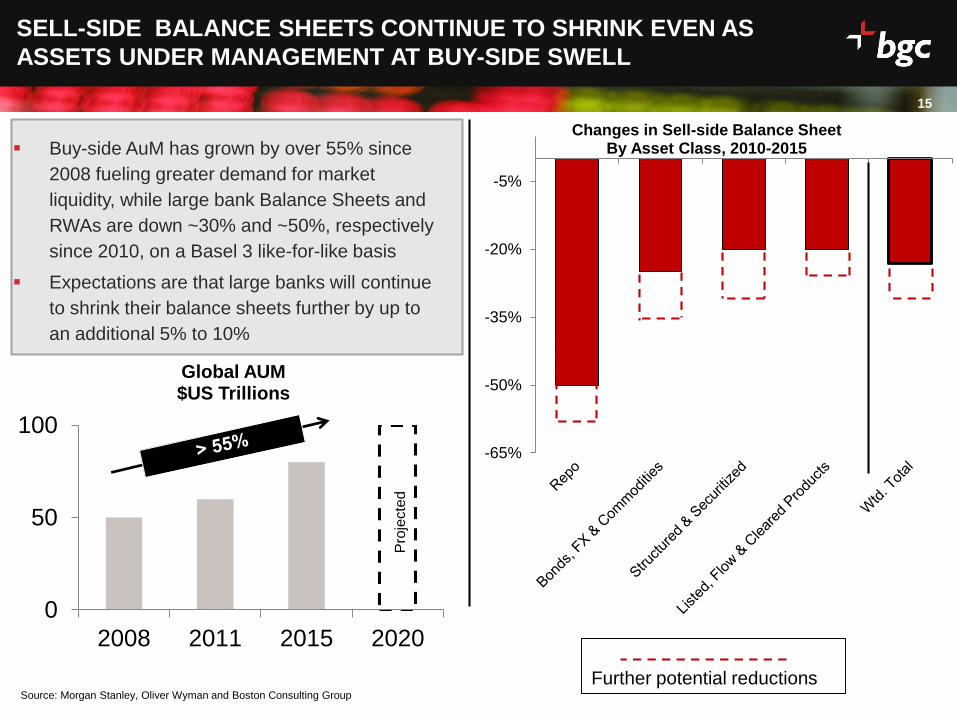
SELL-SIDE BALANCE SHEETS CONTINUE TO SHRINK EVEN AS
ASSETS UNDER MANAGEMENT AT BUY-SIDE SWELL
Buy-side AuM has grown by over 55% since
2008 fueling greater demand for market
liquidity, while large bank Balance Sheets and
RWAs are down ~30% and ~50%, respectively
since 2010, on a Basel 3 like-for-like basis
Expectations are that large banks will continue
to shrink their balance sheets further by up to
an additional 5% to 10%
Source: Morgan Stanley, Oliver Wyman and Boston Consulting Group
-65%
-50%
-35%
-20%
-5%
Changes in Sell-side Balance Sheet By Asset Class, 2010-2015
Further potential reductions
Date
BGC FS$2
BGC RE$1
All Other Wholesale & Execution Peers
$8
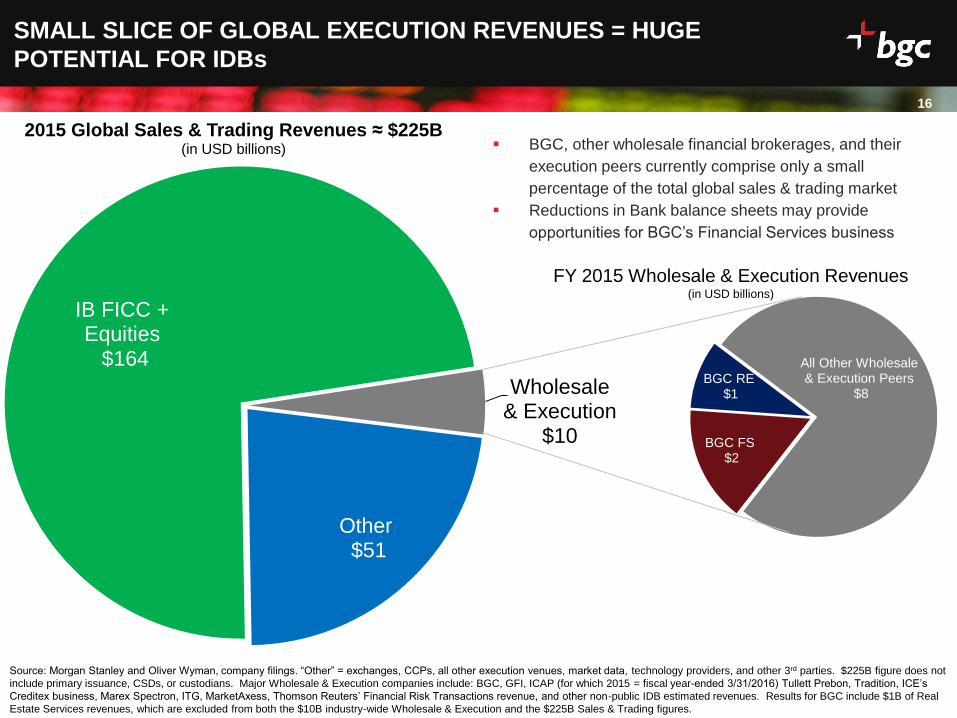
BGC, other wholesale financial brokerages, and their
execution peers currently comprise only a small
percentage of the total global sales & trading market
Reductions in Bank balance sheets may provide
opportunities for BGC’s Financial Services business
IB FICC + Equities
$164
Wholesale & Execution
$10
Other$51
2015 Global Sales & Trading Revenues ≈ $225B(in USD billions)
16
SMALL SLICE OF GLOBAL EXECUTION REVENUES = HUGE
POTENTIAL FOR IDBs
Source: Morgan Stanley and Oliver Wyman, company filings. “Other” = exchanges, CCPs, all other execution venues, market data, technology providers, and other 3rd parties. $225B figure does not
include primary issuance, CSDs, or custodians. Major Wholesale & Execution companies include: BGC, GFI, ICAP (for which 2015 = fiscal year-ended 3/31/2016) Tullett Prebon, Tradition, ICE’s
Creditex business, Marex Spectron, ITG, MarketAxess, Thomson Reuters’ Financial Risk Transactions revenue, and other non-public IDB estimated revenues. Results for BGC include $1B of Real
Estate Services revenues, which are excluded from both the $10B industry-wide Wholesale & Execution and the $225B Sales & Trading figures.
FY 2015 Wholesale & Execution Revenues(in USD billions)

Date
17
Overview
REAL ESTATE
Date
162,263 144,521
73,143 104,740
51,978 56,837
Q4 2015 Q4 2016
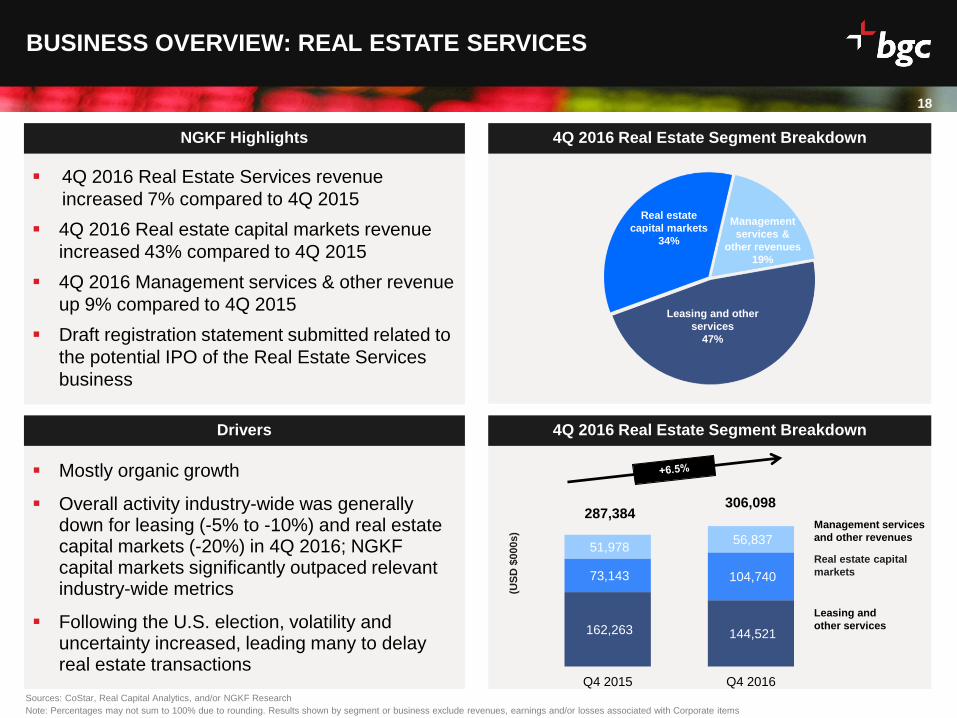
18
4Q 2016 Real Estate Segment BreakdownDrivers
NGKF Highlights 4Q 2016 Real Estate Segment Breakdown
BUSINESS OVERVIEW: REAL ESTATE SERVICES
4Q 2016 Real Estate Services revenue
increased 7% compared to 4Q 2015
4Q 2016 Real estate capital markets revenue
increased 43% compared to 4Q 2015
4Q 2016 Management services & other revenue
up 9% compared to 4Q 2015
Draft registration statement submitted related to
the potential IPO of the Real Estate Services
business
Mostly organic growth
Overall activity industry-wide was generally down for leasing (-5% to -10%) and real estate capital markets (-20%) in 4Q 2016; NGKF capital markets significantly outpaced relevant industry-wide metrics
Following the U.S. election, volatility and uncertainty increased, leading many to delay real estate transactions
Leasing and other
services
47%
Real estate
capital markets
34%
Management
services &
other revenues
19%
Management services
and other revenues
Real estate capital
markets
Leasing and
other services
Note: Percentages may not sum to 100% due to rounding. Results shown by segment or business exclude revenues, earnings and/or losses associated with Corporate items
287,384306,098
(US
D $
000s)
Sources: CoStar, Real Capital Analytics, and/or NGKF Research
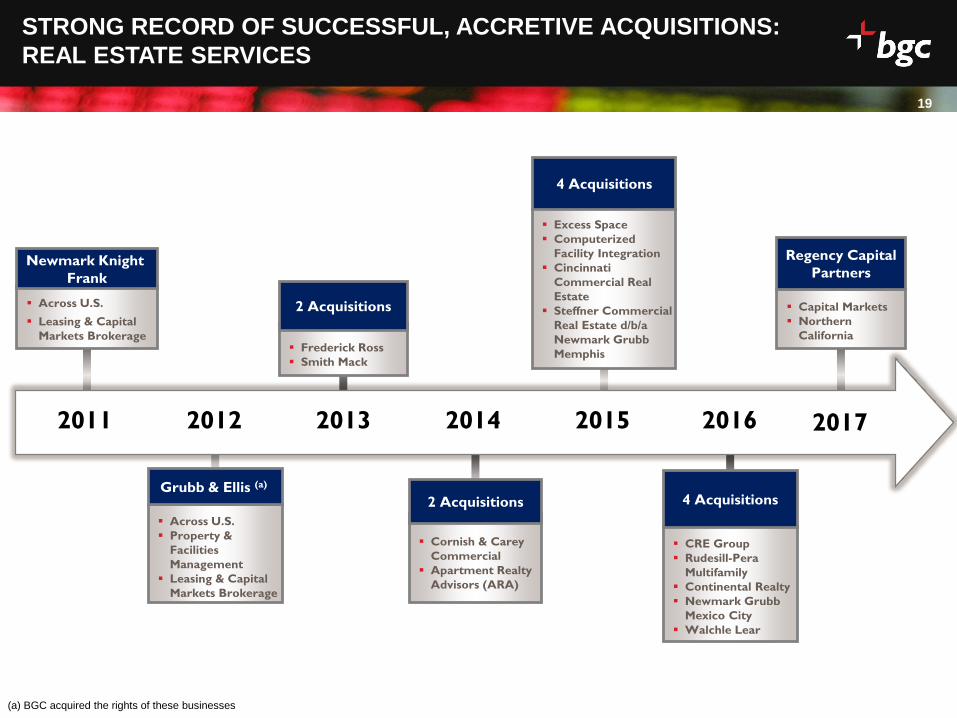
Date
Capital Markets
Northern
California
Regency Capital
Partners
Excess Space
Computerized
Facility Integration
Cincinnati
Commercial Real
Estate
Steffner Commercial
Real Estate d/b/a
Newmark Grubb
Memphis
4 Acquisitions
Across U.S.
Leasing & Capital
Markets Brokerage
Newmark Knight
Frank
Across U.S.
Property &
Facilities
Management
Leasing & Capital
Markets Brokerage
Grubb & Ellis (a)
Cornish & Carey
Commercial
Apartment Realty
Advisors (ARA)
2 Acquisitions
Frederick Ross
Smith Mack
2 Acquisitions
(a) BGC acquired the rights of these businesses
19
20132011 2012 2014 2015 2016
CRE Group
Rudesill-Pera
Multifamily
Continental Realty
Newmark Grubb
Mexico City
Walchle Lear
4 Acquisitions
STRONG RECORD OF SUCCESSFUL, ACCRETIVE ACQUISITIONS:
REAL ESTATE SERVICES
2017
Date
20
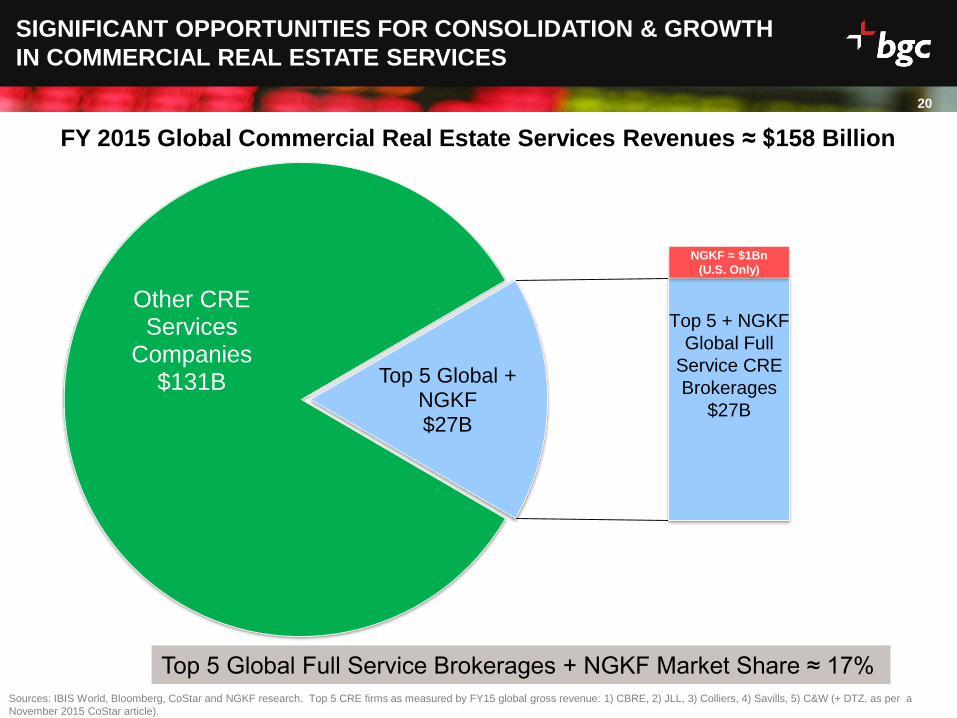
SIGNIFICANT OPPORTUNITIES FOR CONSOLIDATION & GROWTH
IN COMMERCIAL REAL ESTATE SERVICES
Other CRE Services
Companies $131B Top 5 Global +
NGKF$27B
Top 5 + NGKF
Global Full
Service CRE
Brokerages
$27B
Top 5 Global Full Service Brokerages + NGKF Market Share ≈ 17%
Sources: IBIS World, Bloomberg, CoStar and NGKF research. Top 5 CRE firms as measured by FY15 global gross revenue: 1) CBRE, 2) JLL, 3) Colliers, 4) Savills, 5) C&W (+ DTZ, as per a
November 2015 CoStar article).
FY 2015 Global Commercial Real Estate Services Revenues ≈ $158 Billion
NGKF = $1Bn
(U.S. Only)
Date -
200,000
400,000
600,000
800,000
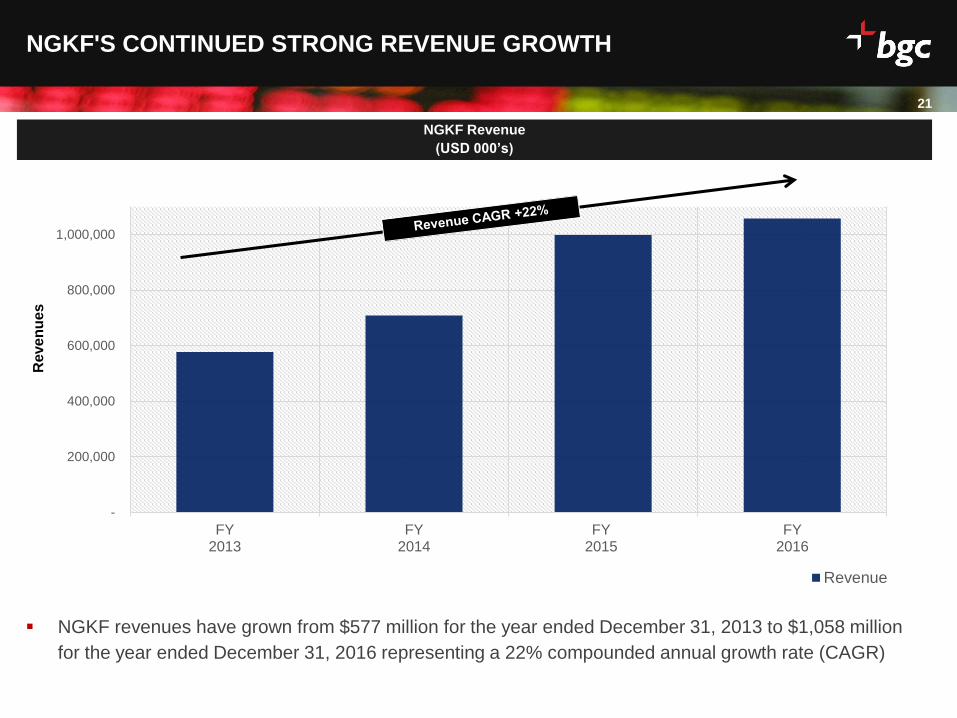
1,000,000
FY2013
FY2014
FY2015
FY2016
Revenue
21
NGKF Revenue
(USD 000’s)
NGKF'S CONTINUED STRONG REVENUE GROWTH
NGKF revenues have grown from $577 million for the year ended December 31, 2013 to $1,058 million
for the year ended December 31, 2016 representing a 22% compounded annual growth rate (CAGR)
Reve
nu
es
Date
22
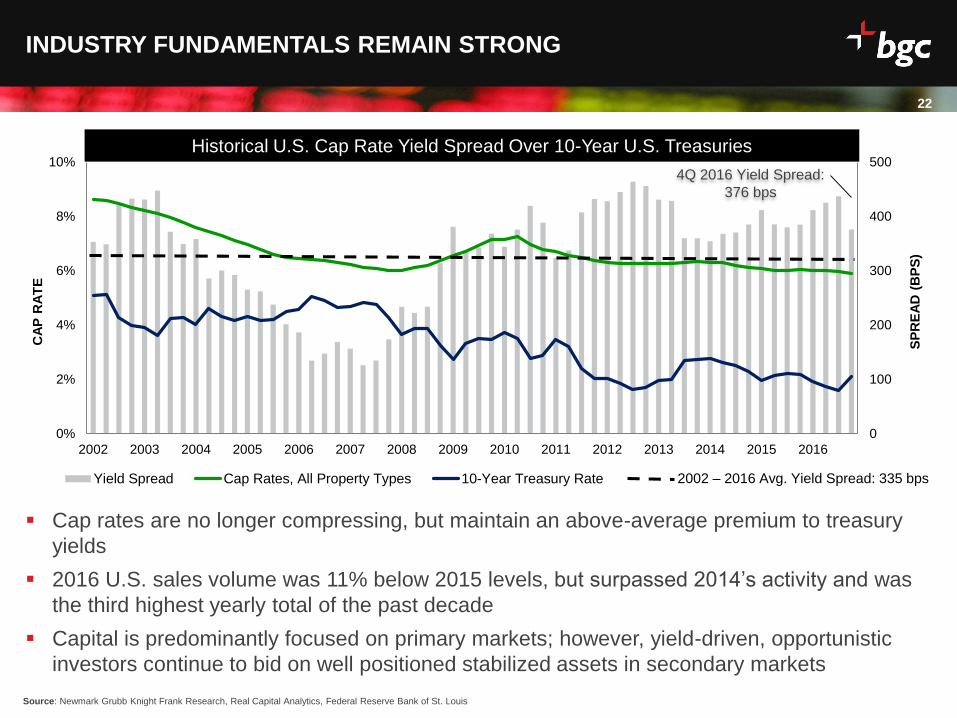
INDUSTRY FUNDAMENTALS REMAIN STRONG
Cap rates are no longer compressing, but maintain an above-average premium to treasury
yields
2016 U.S. sales volume was 11% below 2015 levels, but surpassed 2014’s activity and was
the third highest yearly total of the past decade
Capital is predominantly focused on primary markets; however, yield-driven, opportunistic
investors continue to bid on well positioned stabilized assets in secondary markets
0
100
200
300
400
500
0%
2%
4%
6%
8%
10%
2002 2003 2004 2005 2006 2007 2008 2009 2010 2011 2012 2013 2014 2015 2016
SP
RE
AD
(B
PS
)
CA
P R
AT
E
Yield Spread Cap Rates, All Property Types 10-Year Treasury Rate
4Q 2016 Yield Spread:
376 bps
Source: Newmark Grubb Knight Frank Research, Real Capital Analytics, Federal Reserve Bank of St. Louis
Historical U.S. Cap Rate Yield Spread Over 10-Year U.S. Treasuries
2002 – 2016 Avg. Yield Spread: 335 bps
Date
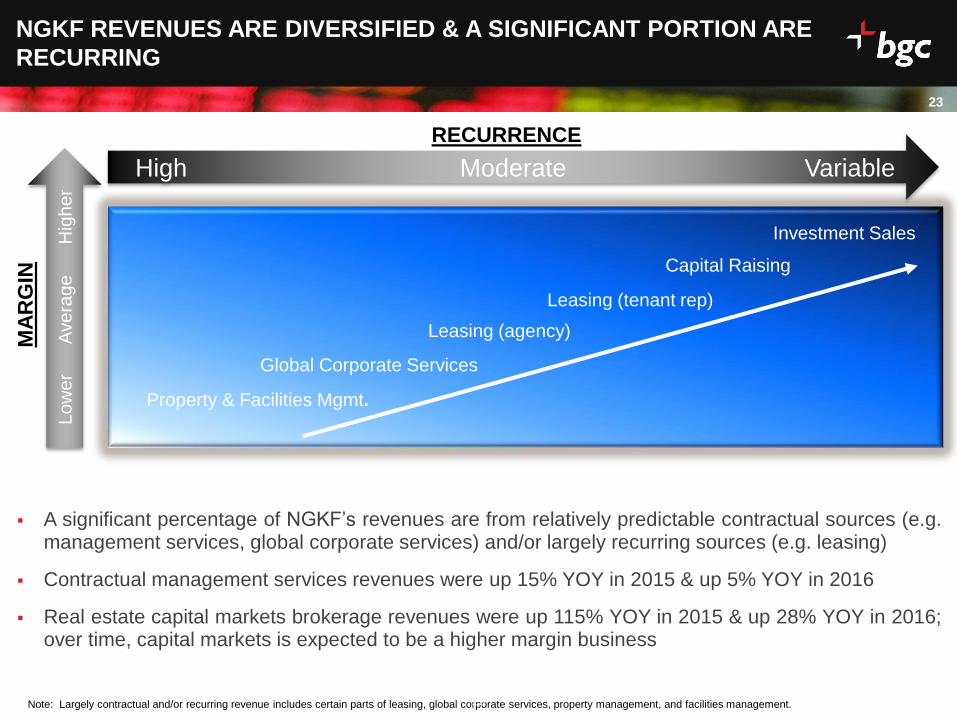
NGKF REVENUES ARE DIVERSIFIED & A SIGNIFICANT PORTION ARE
RECURRING
Note: Largely contractual and/or recurring revenue includes certain parts of leasing, global corporate services, property management, and facilities management. 23
A significant percentage of NGKF’s revenues are from relatively predictable contractual sources (e.g.management services, global corporate services) and/or largely recurring sources (e.g. leasing)
Contractual management services revenues were up 15% YOY in 2015 & up 5% YOY in 2016
Real estate capital markets brokerage revenues were up 115% YOY in 2015 & up 28% YOY in 2016;over time, capital markets is expected to be a higher margin business
23
High Moderate Variable
Property & Facilities Mgmt.
Leasing (tenant rep)
Investment Sales
MA
RG
IN
Global Corporate Services
Leasing (agency)
Capital Raising
Lo
we
r A
ve
rag
e H
igh
er
RECURRENCE

Date
24
BGC PARTNERS
Conclusion
Date
CONCLUSION
Two business lines: Financial Services & Real Estate Services
Growing our highly profitable FENICS (fully electronic) business
Diversified revenues by geography & product class
Liquidity of over $750 million, not including expected future receipt of approximately $780
million in Nasdaq shares
Strong track record of accretive acquisitions and profitable hiring
Relatively low interest rate environment benefits commercial real estate; potential rising interest
rates benefit Financial Services
Intermediary-oriented, low-risk business model
We expect to pay out at least 75% of distributable earnings per share over time
Dividend of $0.16 per share, up 14% yr/yr, for a 5.5% qualified dividend yield
Regulatory reforms provide potential tailwinds to Financial Services
Note: BGCP dividend yield and Nasdaq share value are calculated based on closing stock price at February 24, 2017
25

Q&A

Date
GAAP FinancialsGAAP FINANCIAL RESULTS
Date
28
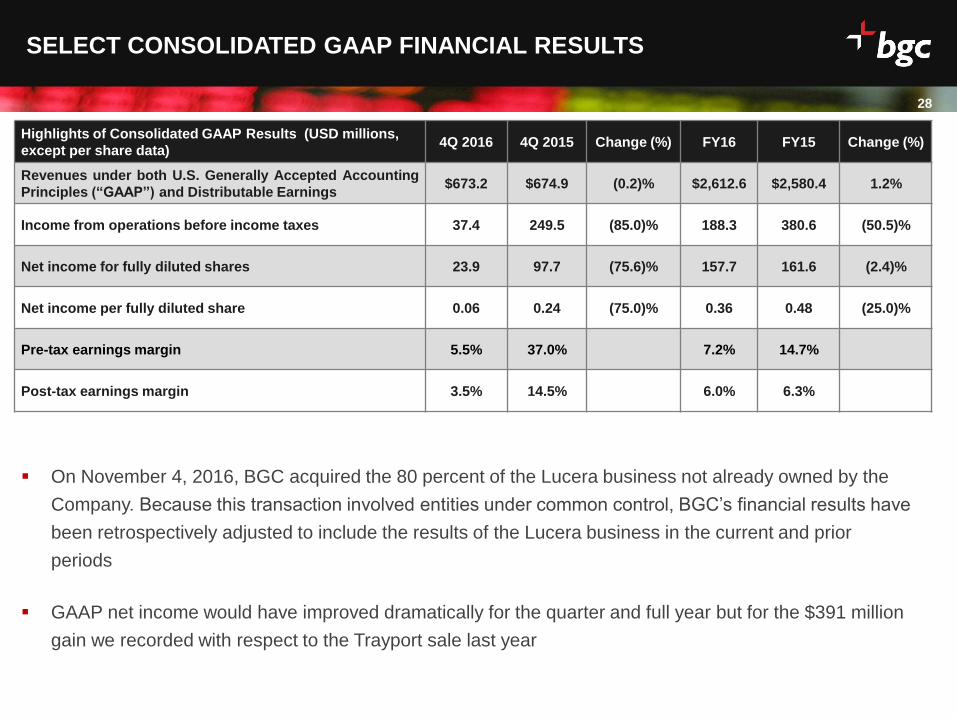
SELECT CONSOLIDATED GAAP FINANCIAL RESULTS
Highlights of Consolidated GAAP Results (USD millions,
except per share data)4Q 2016 4Q 2015 Change (%) FY16 FY15 Change (%)
Revenues under both U.S. Generally Accepted Accounting
Principles (“GAAP”) and Distributable Earnings$673.2 $674.9 (0.2)% $2,612.6 $2,580.4 1.2%
Income from operations before income taxes 37.4 249.5 (85.0)% 188.3 380.6 (50.5)%
Net income for fully diluted shares 23.9 97.7 (75.6)% 157.7 161.6 (2.4)%
Net income per fully diluted share 0.06 0.24 (75.0)% 0.36 0.48 (25.0)%
Pre-tax earnings margin 5.5% 37.0% 7.2% 14.7%
Post-tax earnings margin 3.5% 14.5% 6.0% 6.3%
On November 4, 2016, BGC acquired the 80 percent of the Lucera business not already owned by the
Company. Because this transaction involved entities under common control, BGC’s financial results have
been retrospectively adjusted to include the results of the Lucera business in the current and prior
periods
GAAP net income would have improved dramatically for the quarter and full year but for the $391 million
gain we recorded with respect to the Trayport sale last year
Date
29
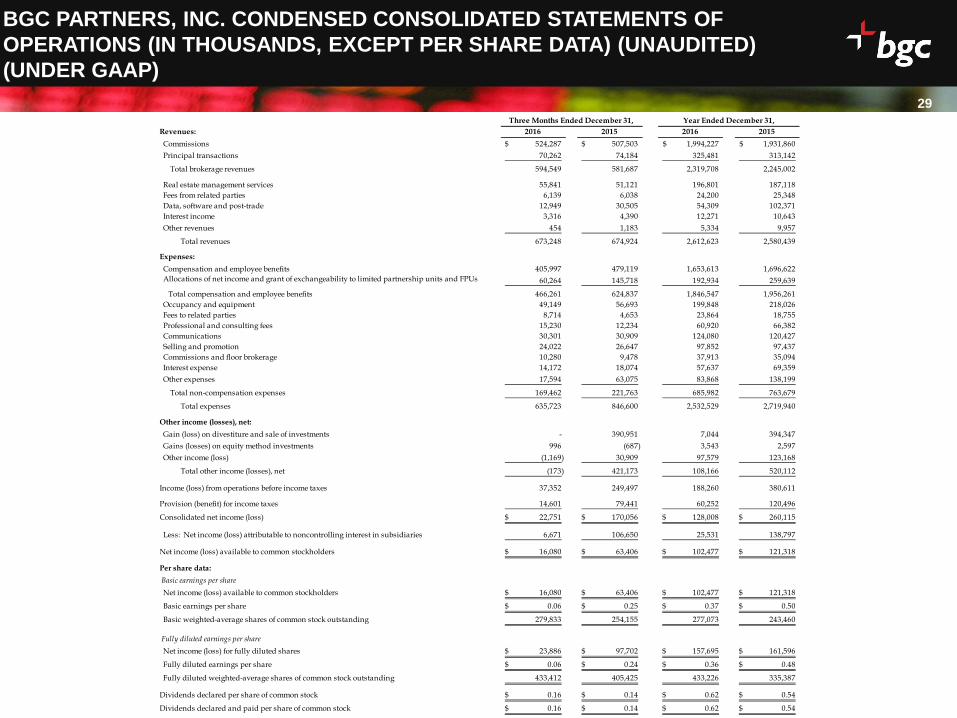
BGC PARTNERS, INC. CONDENSED CONSOLIDATED STATEMENTS OF
OPERATIONS (IN THOUSANDS, EXCEPT PER SHARE DATA) (UNAUDITED)
(UNDER GAAP)
Revenues: 2016 2015 2016 2015
Commissions 524,287$ 507,503$ 1,994,227$ 1,931,860$
Principal transactions 70,262 74,184 325,481 313,142
Total brokerage revenues 594,549 581,687 2,319,708 2,245,002
Real estate management services 55,841 51,121 196,801 187,118
Fees from related parties 6,139 6,038 24,200 25,348
Data, software and post-trade 12,949 30,505 54,309 102,371
Interest income 3,316 4,390 12,271 10,643
Other revenues 454 1,183 5,334 9,957
Total revenues 673,248 674,924 2,612,623 2,580,439
Expenses:
Compensation and employee benefits 405,997 479,119 1,653,613 1,696,622
Allocations of net income and grant of exchangeability to limited partnership units and FPUs 60,264 145,718 192,934 259,639
Total compensation and employee benefits 466,261 624,837 1,846,547 1,956,261
Occupancy and equipment 49,149 56,693 199,848 218,026
Fees to related parties 8,714 4,653 23,864 18,755
Professional and consulting fees 15,230 12,234 60,920 66,382
Communications 30,301 30,909 124,080 120,427
Selling and promotion 24,022 26,647 97,852 97,437
Commissions and floor brokerage 10,280 9,478 37,913 35,094
Interest expense 14,172 18,074 57,637 69,359
Other expenses 17,594 63,075 83,868 138,199
Total non-compensation expenses 169,462 221,763 685,982 763,679
Total expenses 635,723 846,600 2,532,529 2,719,940
Other income (losses), net:
Gain (loss) on divestiture and sale of investments - 390,951 7,044 394,347
Gains (losses) on equity method investments 996 (687) 3,543 2,597
Other income (loss) (1,169) 30,909 97,579 123,168
Total other income (losses), net (173) 421,173 108,166 520,112
Income (loss) from operations before income taxes 37,352 249,497 188,260 380,611
Provision (benefit) for income taxes 14,601 79,441 60,252 120,496
Consolidated net income (loss) 22,751$ 170,056$ 128,008$ 260,115$
Less: Net income (loss) attributable to noncontrolling interest in subsidiaries 6,671 106,650 25,531 138,797
Net income (loss) available to common stockholders 16,080$ 63,406$ 102,477$ 121,318$
Per share data:
Basic earnings per share
Net income (loss) available to common stockholders 16,080$ 63,406$ 102,477$ 121,318$
Basic earnings per share 0.06$ 0.25$ 0.37$ 0.50$
Basic weighted-average shares of common stock outstanding 279,833 254,155 277,073 243,460
Fully diluted earnings per share
Net income (loss) for fully diluted shares 23,886$ 97,702$ 157,695$ 161,596$
Fully diluted earnings per share 0.06$ 0.24$ 0.36$ 0.48$
Fully diluted weighted-average shares of common stock outstanding 433,412 405,425 433,226 335,387
Dividends declared per share of common stock 0.16$ 0.14$ 0.62$ 0.54$
Dividends declared and paid per share of common stock 0.16$ 0.14$ 0.62$ 0.54$
Three Months Ended December 31, Year Ended December 31,
Date
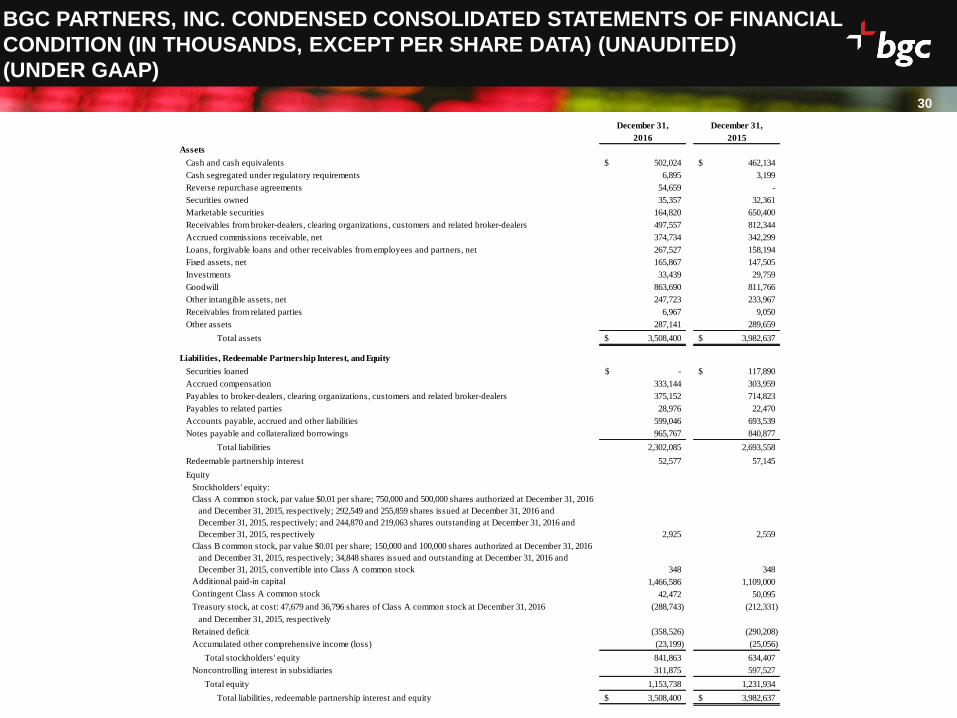
30
BGC PARTNERS, INC. CONDENSED CONSOLIDATED STATEMENTS OF FINANCIAL
CONDITION (IN THOUSANDS, EXCEPT PER SHARE DATA) (UNAUDITED)
(UNDER GAAP)
December 31, December 31,
2016 2015
Assets
Cash and cash equivalents 502,024$ 462,134$
Cash segregated under regulatory requirements 6,895 3,199
Reverse repurchase agreements 54,659 -
Securities owned 35,357 32,361
Marketable securities 164,820 650,400
Receivables from broker-dealers, clearing organizations, customers and related broker-dealers 497,557 812,344
Accrued commissions receivable, net 374,734 342,299
Loans, forgivable loans and other receivables from employees and partners, net 267,527 158,194
Fixed assets, net 165,867 147,505
Investments 33,439 29,759
Goodwill 863,690 811,766
Other intangible assets, net 247,723 233,967
Receivables from related parties 6,967 9,050
Other assets 287,141 289,659
Total assets 3,508,400$ 3,982,637$
Liabilities, Redeemable Partnership Interest, and Equity
Securities loaned -$ 117,890$
Accrued compensation 333,144 303,959
Payables to broker-dealers, clearing organizations, customers and related broker-dealers 375,152 714,823
Payables to related parties 28,976 22,470
Accounts payable, accrued and other liabilities 599,046 693,539
Notes payable and collateralized borrowings 965,767 840,877
Total liabilities 2,302,085 2,693,558
Redeemable partnership interest 52,577 57,145
Equity
Stockholders' equity:
Class A common stock, par value $0.01 per share; 750,000 and 500,000 shares authorized at December 31, 2016
and December 31, 2015, respectively; 292,549 and 255,859 shares issued at December 31, 2016 and
December 31, 2015, respectively; and 244,870 and 219,063 shares outstanding at December 31, 2016 and
December 31, 2015, respectively 2,925 2,559
Class B common stock, par value $0.01 per share; 150,000 and 100,000 shares authorized at December 31, 2016
and December 31, 2015, respectively; 34,848 shares issued and outstanding at December 31, 2016 and
December 31, 2015, convertible into Class A common stock 348 348
Additional paid-in capital 1,466,586 1,109,000
Contingent Class A common stock 42,472 50,095
Treasury stock, at cost: 47,679 and 36,796 shares of Class A common stock at December 31, 2016 (288,743) (212,331)
and December 31, 2015, respectively
Retained deficit (358,526) (290,208)
Accumulated other comprehensive income (loss) (23,199) (25,056)
Total stockholders' equity 841,863 634,407
Noncontrolling interest in subsidiaries 311,875 597,527
Total equity 1,153,738 1,231,934
Total liabilities, redeemable partnership interest and equity 3,508,400$ 3,982,637$

Date
APPENDIX
Date
32
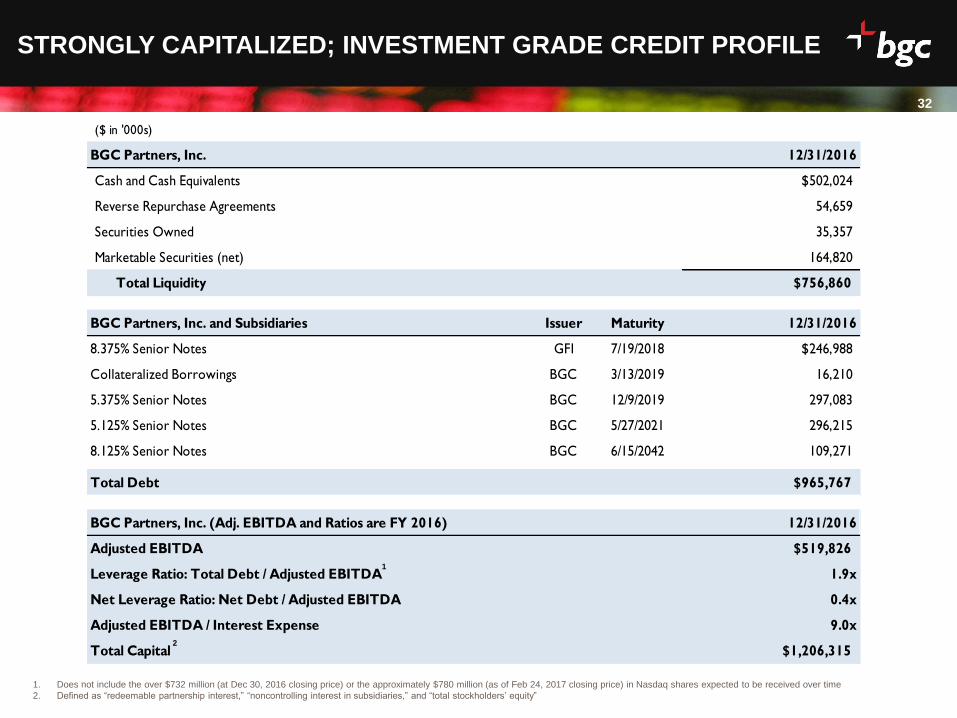
STRONGLY CAPITALIZED; INVESTMENT GRADE CREDIT PROFILE
($ in '000s)
BGC Partners, Inc. 12/31/2016
Cash and Cash Equivalents $502,024
Reverse Repurchase Agreements 54,659
Securities Owned 35,357
Marketable Securities (net) 164,820
Total Liquidity $756,860
BGC Partners, Inc. and Subsidiaries Issuer Maturity 12/31/2016
8.375% Senior Notes GFI 7/19/2018 $246,988
Collateralized Borrowings BGC 3/13/2019 16,210
5.375% Senior Notes BGC 12/9/2019 297,083
5.125% Senior Notes BGC 5/27/2021 296,215
8.125% Senior Notes BGC 6/15/2042 109,271
Total Debt $965,767
BGC Partners, Inc. (Adj. EBITDA and Ratios are FY 2016) 12/31/2016
Adjusted EBITDA $519,826
Leverage Ratio: Total Debt / Adjusted EBITDA 1.9x
Net Leverage Ratio: Net Debt / Adjusted EBITDA 0.4x
Adjusted EBITDA / Interest Expense 9.0x
Total Capital $1,206,315
1
1. Does not include the over $732 million (at Dec 30, 2016 closing price) or the approximately $780 million (as of Feb 24, 2017 closing price) in Nasdaq shares expected to be received over time
2. Defined as “redeemable partnership interest,” “noncontrolling interest in subsidiaries,” and “total stockholders’ equity”
2
Date
33
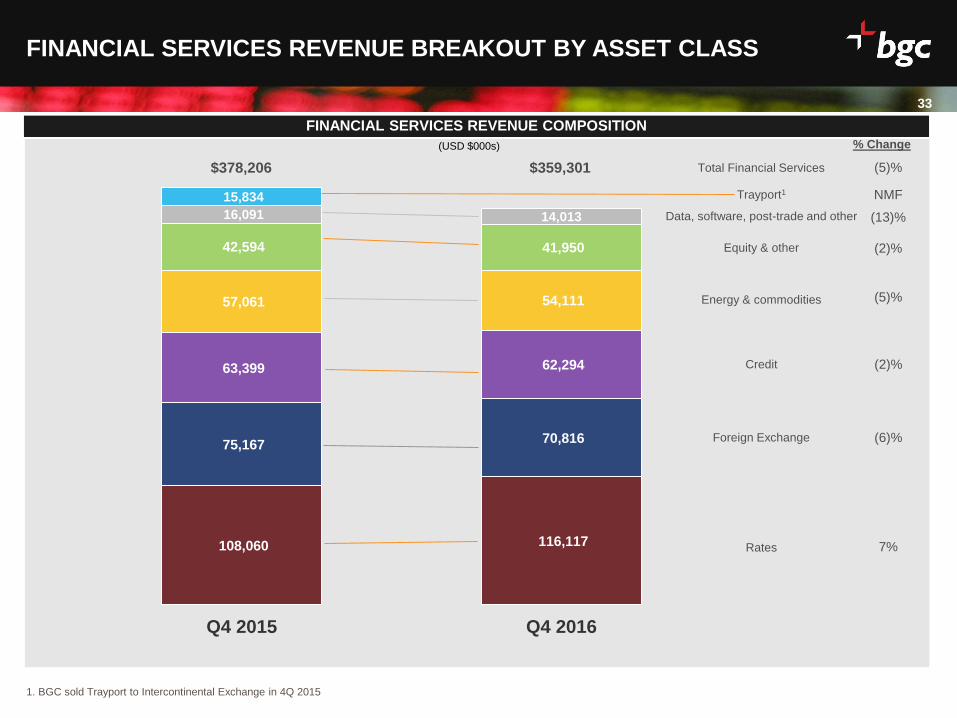
FINANCIAL SERVICES REVENUE COMPOSITION
FINANCIAL SERVICES REVENUE BREAKOUT BY ASSET CLASS
108,060 116,117
75,167 70,816
63,399 62,294
57,061 54,111
42,594 41,950
16,091 14,013
15,834
Q4 2015 Q4 2016
$378,206 $359,301
Data, software, post-trade and other
Energy & commodities
Equity & other
Credit
Foreign Exchange
Rates
(5)%
(2)%
(6)%
7%
1. BGC sold Trayport to Intercontinental Exchange in 4Q 2015
(5)%
% Change
(2)%
NMFTrayport1
Total Financial Services
(USD $000s)
(13)%
Date
34
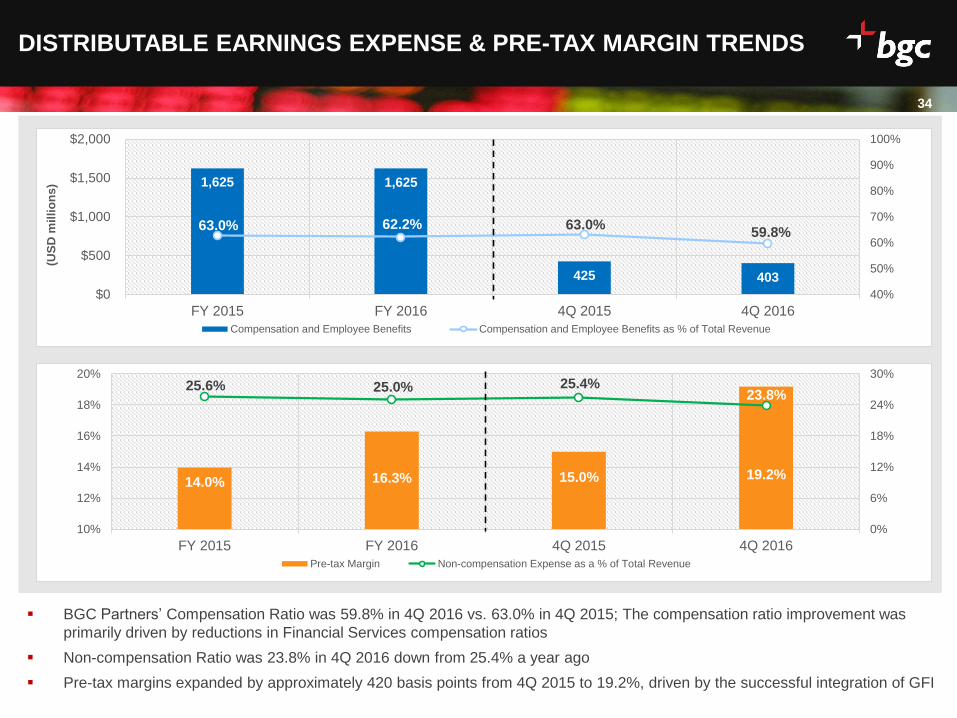
DISTRIBUTABLE EARNINGS EXPENSE & PRE-TAX MARGIN TRENDS
BGC Partners’ Compensation Ratio was 59.8% in 4Q 2016 vs. 63.0% in 4Q 2015; The compensation ratio improvement was
primarily driven by reductions in Financial Services compensation ratios
Non-compensation Ratio was 23.8% in 4Q 2016 down from 25.4% a year ago
Pre-tax margins expanded by approximately 420 basis points from 4Q 2015 to 19.2%, driven by the successful integration of GFI
1,625 1,625
425 403
63.0% 62.2% 63.0%59.8%
40%
50%
60%
70%
80%
90%
100%
$0
$500
$1,000
$1,500
$2,000
FY 2015 FY 2016 4Q 2015 4Q 2016
(US
D m
illi
on
s)
Compensation and Employee Benefits Compensation and Employee Benefits as % of Total Revenue
14.0% 16.3% 15.0% 19.2%
25.6% 25.0% 25.4%23.8%
0%
6%
12%
18%
24%
30%
10%
12%
14%
16%
18%
20%
FY 2015 FY 2016 4Q 2015 4Q 2016
Pre-tax Margin Non-compensation Expense as a % of Total Revenue
Date
35
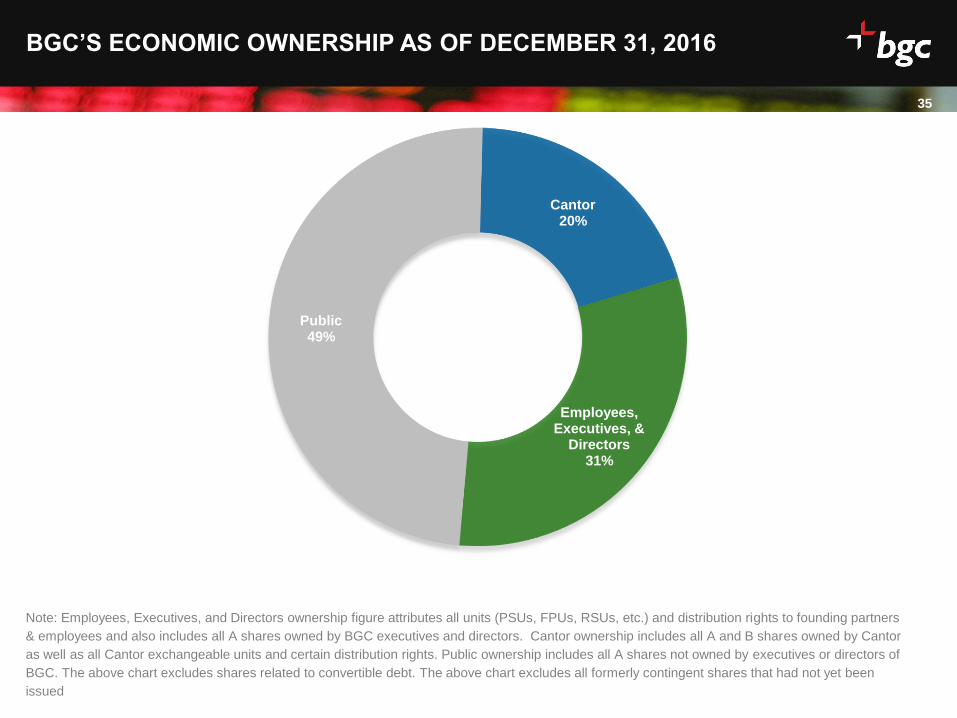
BGC’S ECONOMIC OWNERSHIP AS OF DECEMBER 31, 2016
Public49%
Cantor20%
Employees, Executives, &
Directors31%
Note: Employees, Executives, and Directors ownership figure attributes all units (PSUs, FPUs, RSUs, etc.) and distribution rights to founding partners
& employees and also includes all A shares owned by BGC executives and directors. Cantor ownership includes all A and B shares owned by Cantor
as well as all Cantor exchangeable units and certain distribution rights. Public ownership includes all A shares not owned by executives or directors of
BGC. The above chart excludes shares related to convertible debt. The above chart excludes all formerly contingent shares that had not yet been
issued
Date
36
DIFFERENCES BETWEEN CONSOLIDATED RESULTS FOR
DISTRIBUTABLE EARNINGS AND GAAP
36
Differences between Consolidated Results for Distributable Earnings and GAAP
The following sections describe the main differences between results as calculated for distributable earnings and GAAP for the periods discussed herein.
Differences between Other income (losses), net, for Distributable Earnings and GAAP
Distributable earnings calculations for the full year 2016 excluded gains on divestitures and sale of investments of $7.0 million, which primarily related to the
$7.1 million gain on the sale of a non-core Financial Services asset. There was no such item for the fourth quarter of 2016. For the fourth quarter and full
year 2015, distributable earnings excluded the corresponding gains totaling $391.0 million and $394.3 million, respectively, which primarily related to the
$391.0 million gain on the sale of Trayport.
In the fourth quarters of 2016 and 2015, a gain of $1.0 million and a loss of $(0.7) million, respectively, related to BGC’s investments accounted for under the
equity method, were included as part of “Other income (losses), net” under GAAP but were excluded for distributable earnings. For the full years 2016 and
2015, these amounts were gains of $3.5 million and $2.6 million, respectively.
Under GAAP, gains (losses) of $(0.8) million and $9.8 million related to the mark-to-market movements and/or hedging on the Nasdaq shares were
recognized as part of “Other income (losses), net”, in the fourth quarters of 2016 and 2015, respectively. For the full years 2016 and 2015, these GAAP
amounts were $78.7 million and $68.0 million, respectively. In the fourth quarters of 2016 and 2015, BGC recorded other income for distributable earnings
related to the Nasdaq earn-out and associated mark-to-market movements and/or hedging of $17.2 million and $17.6 million, respectively. For the full years
2016 and 2015, these amounts for distributable earnings were $79.6 million and $60.7 million, respectively. Items related to the Nasdaq earn-out are pro-
rated over four quarters as “Other income” for distributable earnings, but recognized as incurred under GAAP.
In the fourth quarter and full year 2016, a gain of $2.0 million and $6.8 million, respectively related to the net realized and unrealized gain on the ICE shares
received as part of the Trayport transaction was included in GAAP “Other income (losses), net”. For both the fourth quarter and full year 2015, the
corresponding GAAP item was $16.3 million, as the Trayport sale occurred in December of 2015. Items related to the ICE shares’ realized and unrealized
gains are pro-rated over four quarters as “Other income” for distributable earnings, but recognized as incurred under GAAP. For distributable earnings, gains
of $1.6 million and $14.3 million related to the ICE shares were recorded the fourth quarter and full year 2016, respectively as “Other income”. For the fourth
quarter and full year 2015, the corresponding distributable earnings items were both $5.4 million.
For the full year 2016, a gain of $18.3 million related to an adjustment of future earn-out payments that will no longer be required was included as part of
“Other income (losses), net” under GAAP but was excluded for distributable earnings. For the full year 2015, a $29.0 million gain with respect to the shares of
GFI owned by the Company prior to the successful completion of BGC’s tender offer for GFI was included as part of “Other income (losses), net” under GAAP
but was excluded for distributable earnings.
For the fourth quarter and full year 2016, additional losses of $2.3 million and $3.6 million, respectively, were included in GAAP “Other income (losses), net”,
but were excluded from distributable earnings as part of “(Gains) and charges with respect to acquisitions, dispositions and / or resolutions of litigation,
charitable contributions, and other non-cash, non-dilutive items, net”. In the year earlier periods, gains of $4.8 million and $10.1 million, were included in
GAAP “Other income (losses), net”, but were excluded for distributable earnings.
Date
DIFFERENCES BETWEEN CONSOLIDATED RESULTS FOR
DISTRIBUTABLE EARNINGS AND GAAP (CONTINUED)
Differences between Compensation Expenses for Distributable Earnings and GAAPIn the fourth quarter of 2016, the difference between compensation expenses as calculated for GAAP and distributable earnings included non-cash, non-dilutive net charges
related to the $48.7 million in grants of exchangeability and $11.6 million in allocation of net income to limited partnership units and FPUs, as well as charges related to
additional reserves on employee loans of $0.8 million. For the full year 2016, the corresponding amounts were $141.4 million, $51.5 million, and $16.2 million, respectively.
In the fourth quarter of 2015, the difference between compensation expenses as calculated for GAAP and distributable earnings included non-cash, and/or non-dilutive
charges related to the $134.8 million in grants of exchangeability, $10.9 million allocation of net income to limited partnership units and FPUs, and $47.2 million related to
additional reserves on employee loans. For the full year 2015, the corresponding amounts were $231.4 million, $28.3 million, and $47.2 million, respectively.
For the fourth quarter and full year 2016, $2.6 million, and $12.5 million, respectively, in GAAP non-cash charges related to the amortization of GFI employee forgivable loans
granted prior to the closing of the January 11, 2016 back-end merger with GFI were also excluded from the calculation of pre-tax distributable earnings as part of “(Gains)
and charges with respect to acquisitions, dispositions and / or resolutions of litigation, charitable contributions, and other non-cash, non-dilutive items, net”. A year earlier, the
corresponding charges excluded from distributable earnings were $4.7 million and $16.2 million, respectively. In addition, for the full year 2015, $6.6 million in GAAP charges
related to GFI compensation restructuring was excluded from distributable earnings as part of “(Gains) and charges with respect to acquisitions, dispositions and / or
resolutions of litigation, charitable contributions, and other non-cash, non-dilutive items, net”.
Differences between Certain Non-compensation Expenses for Distributable Earnings and GAAPThe difference between non-compensation expenses in the fourth quarter and full year 2016 as calculated for GAAP and distributab le earnings included additional “(Gains)
and charges with respect to acquisitions, dispositions and / or resolutions of litigation, charitable contributions, and other non-cash, non-dilutive items, net”. These included
$5.1 million and $20.1 million, respectively, of non-cash GAAP charges related to amortization of intangibles; $2.2 million and $7.5 million, respectively, of acquisition related
costs; $0.6 million and $4.4 million, respectively, of non-cash GAAP impairment charges; and various other GAAP items that together came to net charges of $1.2 million and
$0.5 million, respectively.
The difference between non-compensation expenses in the fourth quarter and full year 2015 as calculated for GAAP and distributab le earnings included additional “(Gains)
and charges with respect to acquisitions, dispositions and / or resolutions of litigation, charitable contributions, and other non-cash, non-dilutive items, net”. These included
$6.0 million and $27.2 million, respectively, of non-cash GAAP charges related to amortization of intangibles; $0.6 million and $13.7 million, respectively, of acquisition
related costs; $0.3 million and $19.1 million, respectively, of non-cash GAAP impairment charges; a $40.0 million reserve related to a commitment to make charitable
contributions with respect to BGC’s annual Charity day; and various other GAAP items that together came to charges of $3.5 mi llion and $2.6 million, respectively.
Differences between Taxes for Distributable Earnings and GAAPBGC’s GAAP provision for income taxes from 2016 forward is calculated based on an annualized methodology. The Company’s GAAP provision for income taxes was $14.6
million and $79.4 million for the fourth quarter of 2016 and 2015, respectively. The Company includes additional tax-deductible items when calculating the provision for taxes
with respect to distributable earnings using an annualized methodology. These include tax-deductions related to equity-based compensation with respect to limited
partnership unit exchange, employee loan amortization, charitable contributions, and certain net-operating loss carryforwards. The provision for income taxes with respect to
distributable earnings was adjusted by $5.3 million and $(63.9) million for the fourth quarter of 2016 and 2015, respectively.
As a result, the provision for income taxes with respect to distributable earnings was $19.9 million and $15.5 million for the fourth quarter of 2016 and 2015, respectively.
The Company’s GAAP provision for income taxes was $60.3 million and $120.5 million for the full years 2016 and 2015, respectively. The provision for income taxes with
respect to distributable earnings was adjusted by $5.5 million and $(65.1) million for the full years of 2016 and 2015, respectively, for the reasons discussed above. As a
result, the provision for income taxes with respect to distributable earnings was $65.8 million and $55.4 million for the ful l years 2016 and 2015, respectively.
37
Date
38
DISTRIBUTABLE EARNINGS DEFINED
38
Distributable Earnings Defined
BGC Partners uses non-GAAP financial measures including, but not limited to, "pre-tax distributable earnings” and "post-tax distributable earnings", which are supplemental
measures of operating results that are used by management to evaluate the financial performance of the Company and its consolidated subsidiaries. BGC believes that
distributable earnings best reflect the operating earnings generated by the Company on a consolidated basis and are the earnings which management considers available for,
among other things, distribution to BGC Partners, Inc. and its common stockholders, as well as to holders of BGC Holdings partnership units during any period.
As compared with "income (loss) from operations before income taxes”, and "net income (loss) per fully diluted share”, all prepared in accordance with GAAP, distributable
earnings calculations primarily exclude certain non-cash compensation and other expenses that generally do not involve the receipt or outlay of cash by the Company and/or
which do not dilute existing stockholders, as described below. In addition, distributable earnings calculations exclude certain gains and charges that management believes do
not best reflect the ordinary operating results of BGC.
Adjustments Made to Calculate Pre-Tax Distributable Earnings
Pre-tax distributable earnings are defined as GAAP income (loss) from operations before income taxes and noncontrolling interest in subsidiaries excluding items, such as:
• Non-cash equity-based compensation charges related to limited partnership unit exchange or conversion.
• Non-cash asset impairment charges, if any.
• Non-cash compensation charges for items granted or issued pre-merger with respect to certain mergers or acquisitions by BGC Partners, Inc. To date, these mergers
have only included those with and into eSpeed, Inc. and the back-end merger with GFI Group Inc.
Distributable earnings calculations also exclude certain unusual, one-time or non-recurring items, if any. These charges are excluded from distributable earnings because the
Company views excluding such charges as a better reflection of the ongoing, ordinary operations of BGC.
In addition to the above items, allocations of net income to founding/working partner and other limited partnership units are excluded from calculations of pre-tax distributable
earnings. Such allocations represent the pro-rata portion of pre-tax earnings available to such unit holders. These units are in the fully diluted share count, and are
exchangeable on a one-to-one basis into common stock. As these units are exchanged into common shares, unit holders become entitled to cash dividends rather than cash
distributions. The Company views such allocations as intellectually similar to dividends on common shares. Because dividends paid to common shares are not an expense
under GAAP, management believes similar allocations of income to unit holders should also be excluded when calculating distributable earnings performance measures.
BGC’s definition of distributable earnings also excludes certain gains and charges with respect to acquisitions, dispositions, or resolutions of litigation. This includes the one-
time gains related to the Nasdaq and Trayport transactions. Management believes that excluding such gains and charges also best reflects the ongoing operating
performance of BGC.
However, the payments associated with BGC’s expected annual receipt of Nasdaq stock and related mark-to-market gains or losses are anticipated to be included in the
Company’s calculation of distributable earnings for the following reasons:
• Nasdaq is expected to pay BGC in an equal amount of stock on a regular basis for a 15 year period beginning in 2013 as part of that transaction;
• The Nasdaq earn-out largely replaced the generally recurring quarterly earnings BGC generated from eSpeed; and
• The Company intends to pay dividends and distributions to common stockholders and/or unit holders based on all other income related to the receipt of the earn-out.
Date
DISTRIBUTABLE EARNINGS DEFINED (CONTINUED)
To make period-to-period comparisons more meaningful, one-quarter of each annual Nasdaq contingent earn-out amount, as well as gains or losses with respect to associated
mark-to-market movements and/or hedging, will be included in the Company’s calculation of distributable earnings each quarter as “other income”.
The Company also treats gains or losses related to mark-to-market movements and/or hedging with respect to any remaining shares of Intercontinental Exchange, Inc. (“ICE”)
in a consistent manner with the treatment of Nasdaq shares when calculating distributable earnings.
Investors and analysts should note that, due to the large gain recorded with respect to the Trayport sale in December, 2015, and the closing of the back-end merger with GFI in
January, 2016, non-cash charges related to the amortization of intangibles with respect to acquisitions are also excluded from the calculation of pre-tax distributable earnings.
Adjustments Made to Calculate Post-Tax Distributable Earnings
Since distributable earnings are calculated on a pre-tax basis, management intends to also report post-tax distributable earnings to fully diluted shareholders. Post-tax
distributable earnings to fully diluted shareholders are defined as pre-tax distributable earnings, less noncontrolling interest in subsidiaries, and reduced by the provision for
taxes as described below.
The Company’s calculation of the provision for taxes on an annualized basis starts with GAAP income tax provision, adjusted to reflect tax-deductible items. Management uses
this non-GAAP provision for taxes in part to help it to evaluate, among other things, the overall performance of the business, make decisions with respect to the Company’s
operations, and to determine the amount of dividends paid to common shareholders.
The provision for taxes with respect to distributable earnings includes additional tax-deductible items including limited partnership unit exchange or conversion, employee loan
amortization, charitable contributions, and certain net-operating loss carryforwards.
BGC incurs income tax expenses based on the location, legal structure and jurisdictional taxing authorities of each of its subsidiaries. Certain of the Company’s entities are
taxed as U.S. partnerships and are subject to the Unincorporated Business Tax (“UBT”) in New York City. Any U.S. federal and state income tax liability or benefit related to
the partnership income or loss, with the exception of UBT, rests with the unit holders rather than with the partnership entity. The Company’s consolidated financial statements
include U.S. federal, state and local income taxes on the Company’s allocable share of the U.S. results of operations. Outside of the U.S., BGC operates principally through
subsidiary corporations subject to local income taxes. For these reasons, taxes for distributable earnings are presented to show the tax provision the consolidated Company
would expect to pay if 100 percent of earnings were taxed at global corporate rates.
Calculations of Pre-tax and Post-Tax Distributable Earnings per Share
BGC’s distributable earnings per share calculations assume either that:
• The fully diluted share count includes the shares related to any dilutive instruments, such as the Convertible Senior Notes, but excludes the associated interest expense, net
of tax, when the impact would be dilutive; or
• The fully diluted share count excludes the shares related to these instruments, but includes the associated interest expense, net of tax.
The share count for distributable earnings excludes shares expected to be issued in future periods but not yet eligible to receive dividends and/or distributions.
39
Date
40
Each quarter, the dividend to BGC’s common stockholders is expected to be determined by the Company’s Board of Directors with reference to a number of factors,
including post-tax distributable earnings per fully diluted share. In addition to the Company’s quarterly dividend to common stockholders, BGC Partners expects to
pay a pro-rata distribution of net income to BGC Holdings founding/working partner and other limited partnership units, as well as to Cantor for its non-controlling
interest. The amount of this net income, and therefore of these payments, is expected to be determined using the above definition of pre-tax distributable earnings
per share.
Other Matters with Respect to Distributable Earnings
The term “distributable earnings” should not be considered in isolation or as an alternative to GAAP net income (loss). The Company views distributable earnings as
a metric that is not indicative of liquidity or the cash available to fund its operations, but rather as a performance measure.
Pre- and post-tax distributable earnings are not intended to replace the Company’s presentation of GAAP financial results. However, management believes that they
help provide investors with a clearer understanding of BGC Partners’ financial performance and offer useful information to bo th management and investors regarding
certain financial and business trends related to the Company’s financial condition and results of operations. Management bel ieves that distributable earnings and the
GAAP measures of financial performance should be considered together.
BGC anticipates providing forward-looking quarterly guidance for GAAP revenues and for certain distributable earnings measures from time to time. However, the
Company does not anticipate providing a quarterly outlook for other GAAP results. This is because certain GAAP items, which are excluded from distributable
earnings, are difficult to forecast with precision before the end of each quarter. The Company therefore believes that it is not possible to forecast quarterly GAAP
results or to quantitatively reconcile GAAP results to non-GAAP results with sufficient precision unless BGC makes unreasonable efforts.
The items that are difficult to predict on a quarterly basis with precision and which can have a material impact on the Company’s GAAP results include, but are not
limited, to the following:
• Allocations of net income and grants of exchangeability to limited partnership units and founding partner units, which are determined at the discretion of
management throughout and up to the period-end.
• The impact of certain marketable securities, as well as any gains or losses related to associated mark-to-market movements and/or hedging. These items are
calculated using period-end closing prices.
• Non-cash asset impairment charges, which are calculated and analyzed based on the period-end values of the underlying assets. These amounts may not be
known until after period-end.
• Acquisitions, dispositions and/or resolutions of litigation which are fluid and unpredictable in nature.
For more information on this topic, please see certain tables in the most recent BGC financial results press release including “Reconciliation of GAAP Income (Loss)
to Distributable Earnings”. These tables provide summary reconciliations between pre- and post-tax distributable earnings and the corresponding GAAP measures
for the Company.
DISTRIBUTABLE EARNINGS DEFINED (CONTINUED)
Date
41
ADJUSTED EBITDA DEFINED
Adjusted EBITDA Defined
BGC also provides an additional non-GAAP financial performance measure, “adjusted EBITDA”, which it defines as GAAP “Net income
(loss) available to common stockholders”, adjusted to add back the following items:
• Interest expense;
• Fixed asset depreciation and intangible asset amortization;
• Impairment charges;
• Employee loan amortization and reserves on employee loans;
• Provision (benefit) for income taxes;
• Net income (loss) attributable to noncontrolling interest in subsidiaries;
• Non-cash charges relating to grants of exchangeability to limited partnership interests;
• Non-cash charges related to issuance of restricted shares; and
• Non-cash earnings or losses related to BGC’s equity investments.
The Company’s management believes that adjusted EBITDA is useful in evaluating BGC’s operating performance, because the calculation
of this measure generally eliminates the effects of financing and income taxes and the accounting effects of capital spending and
acquisitions, which would include impairment charges of goodwill and intangibles created from acquisitions. Such items may vary for
different companies for reasons unrelated to overall operating performance. As a result, the Company’s management uses these
measures to evaluate operating performance and for other discretionary purposes. BGC believes that adjusted EBITDA is useful to
investors to assist them in getting a more complete picture of the Company’s financial results and operations.
Since adjusted EBITDA is not a recognized measurement under GAAP, investors should use adjusted EBITDA in addition to GAAP
measures of net income when analyzing BGC’s operating performance. Because not all companies use identical EBITDA calculations, the
Company’s presentation of adjusted EBITDA may not be comparable to similarly titled measures of other companies. Furthermore,
adjusted EBITDA is not intended to be a measure of free cash flow or GAAP cash flow from operations, because adjusted EBITDA does
not consider certain cash requirements, such as tax and debt service payments.
For a reconciliation of adjusted EBITDA to GAAP “Net income (loss) available to common stockholders”, the most comparable financial
measure calculated and presented in accordance with GAAP, see the section of this document titled "Reconciliation of GAAP Income
(Loss) to Adjusted EBITDA”.
41
Date
42
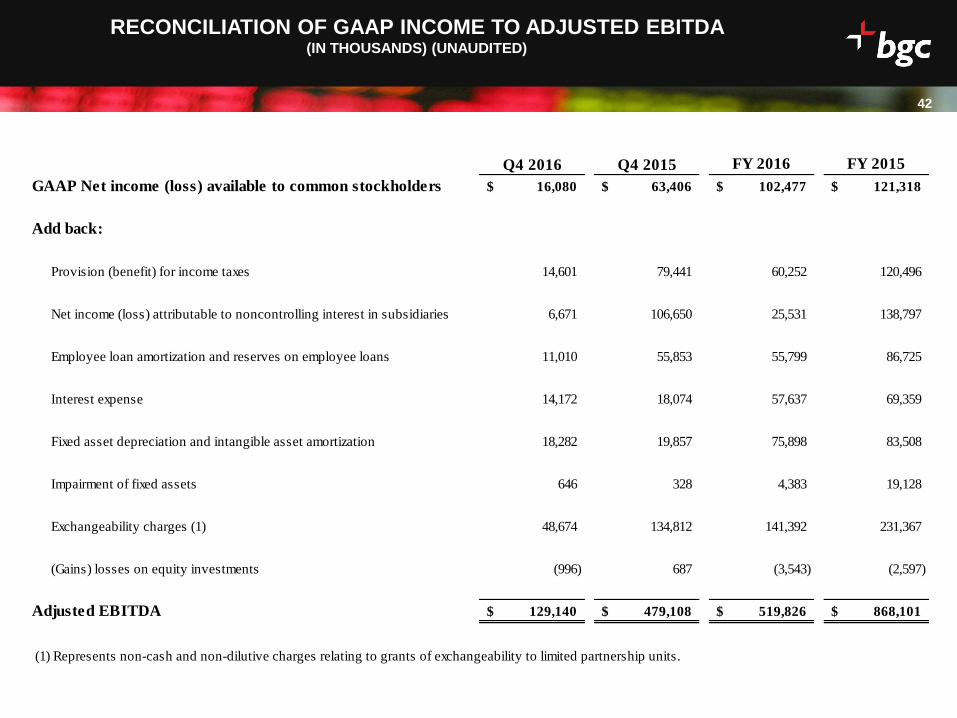
RECONCILIATION OF GAAP INCOME TO ADJUSTED EBITDA (IN THOUSANDS) (UNAUDITED)
Q4 2016 Q4 2015 FY 2016 FY 2015
GAAP Net income (loss) available to common stockholders 16,080$ 63,406$ 102,477$ 121,318$
Add back:
Provision (benefit) for income taxes 14,601 79,441 60,252 120,496
Net income (loss) attributable to noncontrolling interest in subsidiaries 6,671 106,650 25,531 138,797
Employee loan amortization and reserves on employee loans 11,010 55,853 55,799 86,725
Interest expense 14,172 18,074 57,637 69,359
Fixed asset depreciation and intangible asset amortization 18,282 19,857 75,898 83,508
Impairment of fixed assets 646 328 4,383 19,128
Exchangeability charges (1) 48,674 134,812 141,392 231,367
(Gains) losses on equity investments (996) 687 (3,543) (2,597)
Adjusted EBITDA 129,140$ 479,108$ 519,826$ 868,101$
(1) Represents non-cash and non-dilutive charges relating to grants of exchangeability to limited partnership units.
Date
43
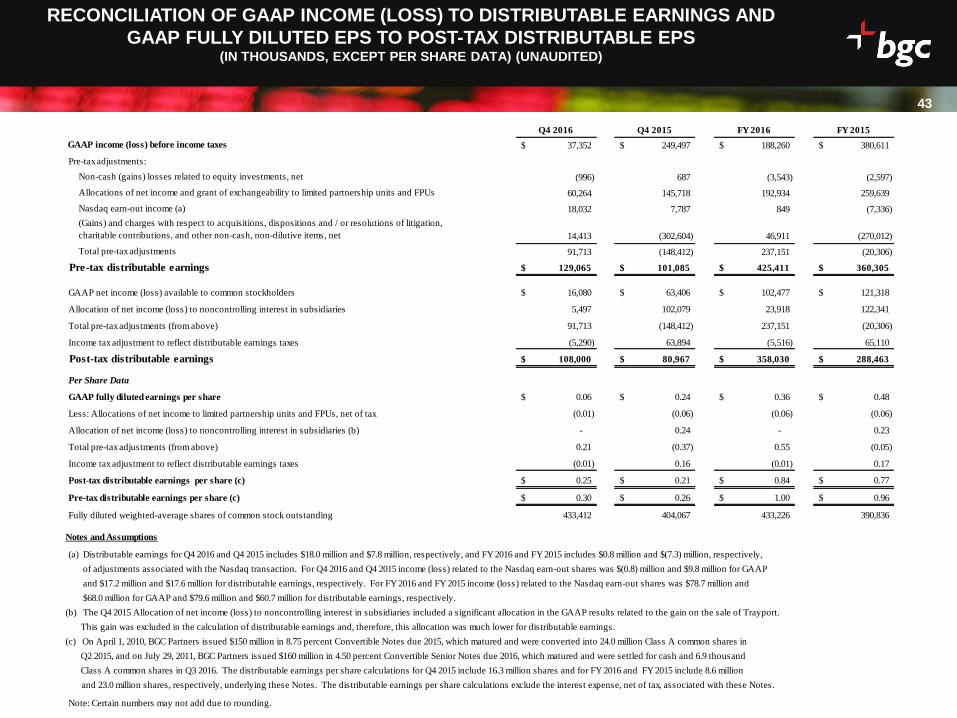
RECONCILIATION OF GAAP INCOME (LOSS) TO DISTRIBUTABLE EARNINGS AND
GAAP FULLY DILUTED EPS TO POST-TAX DISTRIBUTABLE EPS (IN THOUSANDS, EXCEPT PER SHARE DATA) (UNAUDITED)
Q4 2016 Q4 2015 FY 2016 FY 2015
GAAP income (loss) before income taxes 37,352$ 249,497$ 188,260$ 380,611$
Pre-tax adjustments:
Non-cash (gains) losses related to equity investments, net (996) 687 (3,543) (2,597)
Allocations of net income and grant of exchangeability to limited partnership units and FPUs 60,264 145,718 192,934 259,639
Nasdaq earn-out income (a) 18,032 7,787 849 (7,336)
(Gains) and charges with respect to acquisitions, dispositions and / or resolutions of litigation,
charitable contributions, and other non-cash, non-dilutive items, net 14,413 (302,604) 46,911 (270,012)
Total pre-tax adjustments 91,713 (148,412) 237,151 (20,306)
Pre-tax distributable earnings 129,065$ 101,085$ 425,411$ 360,305$
GAAP net income (loss) available to common stockholders 16,080$ 63,406$ 102,477$ 121,318$
Allocation of net income (loss) to noncontrolling interest in subsidiaries 5,497 102,079 23,918 122,341
Total pre-tax adjustments (from above) 91,713 (148,412) 237,151 (20,306)
Income tax adjustment to reflect distributable earnings taxes (5,290) 63,894 (5,516) 65,110
Post-tax distributable earnings 108,000$ 80,967$ 358,030$ 288,463$
Per Share Data
GAAP fully diluted earnings per share 0.06$ 0.24$ 0.36$ 0.48$
Less: Allocations of net income to limited partnership units and FPUs, net of tax (0.01) (0.06) (0.06) (0.06)
Allocation of net income (loss) to noncontrolling interest in subsidiaries (b) - 0.24 - 0.23
Total pre-tax adjustments (from above) 0.21 (0.37) 0.55 (0.05)
Income tax adjustment to reflect distributable earnings taxes (0.01) 0.16 (0.01) 0.17
Post-tax distributable earnings per share (c) 0.25$ 0.21$ 0.84$ 0.77$
Pre-tax distributable earnings per share (c) 0.30$ 0.26$ 1.00$ 0.96$
Fully diluted weighted-average shares of common stock outstanding 433,412 404,067 433,226 390,836
Notes and Assumptions
(a) Distributable earnings for Q4 2016 and Q4 2015 includes $18.0 million and $7.8 million, respectively, and FY 2016 and FY 2015 includes $0.8 million and $(7.3) million, respectively,
of adjustments associated with the Nasdaq transaction. For Q4 2016 and Q4 2015 income (loss) related to the Nasdaq earn-out shares was $(0.8) million and $9.8 million for GAAP
and $17.2 million and $17.6 million for distributable earnings, respectively. For FY 2016 and FY 2015 income (loss) related to the Nasdaq earn-out shares was $78.7 million and
$68.0 million for GAAP and $79.6 million and $60.7 million for distributable earnings, respectively.
(b) The Q4 2015 Allocation of net income (loss) to noncontrolling interest in subsidiaries included a significant allocation in the GAAP results related to the gain on the sale of Trayport.
This gain was excluded in the calculation of distributable earnings and, therefore, this allocation was much lower for distributable earnings.
(c) On April 1, 2010, BGC Partners issued $150 million in 8.75 percent Convertible Notes due 2015, which matured and were converted into 24.0 million Class A common shares in
Q2 2015, and on July 29, 2011, BGC Partners issued $160 million in 4.50 percent Convertible Senior Notes due 2016, which matured and were settled for cash and 6.9 thousand
Class A common shares in Q3 2016. The distributable earnings per share calculations for Q4 2015 include 16.3 million shares and for FY 2016 and FY 2015 include 8.6 million
and 23.0 million shares, respectively, underlying these Notes. The distributable earnings per share calculations exclude the interest expense, net of tax, associated with these Notes.
Note: Certain numbers may not add due to rounding.
Date
44
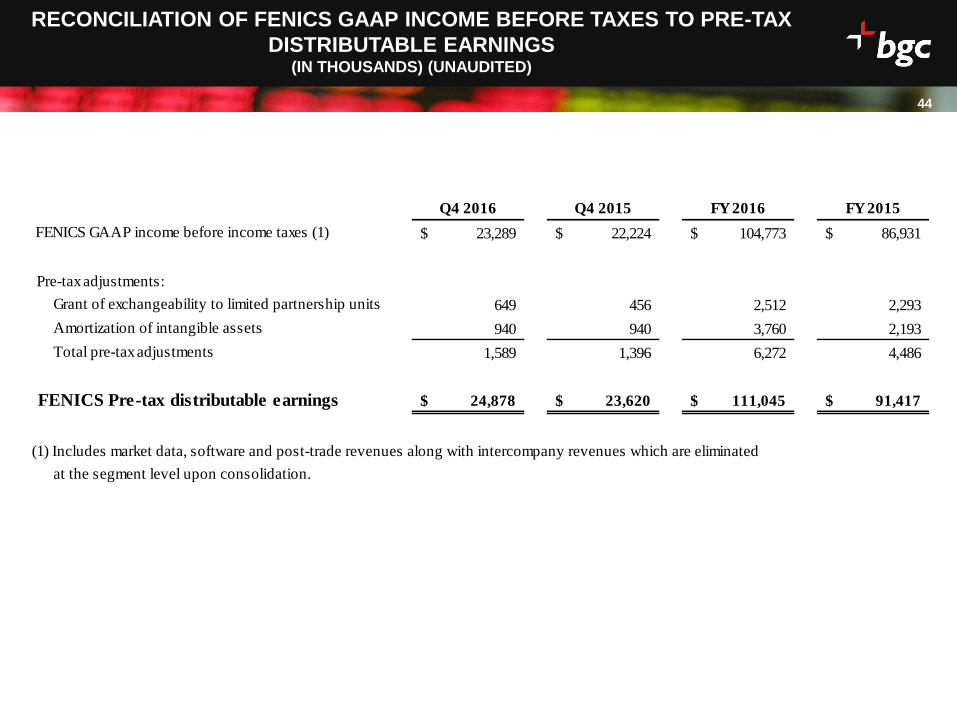
RECONCILIATION OF FENICS GAAP INCOME BEFORE TAXES TO PRE-TAX
DISTRIBUTABLE EARNINGS (IN THOUSANDS) (UNAUDITED)
Q4 2016 Q4 2015 FY 2016 FY 2015
FENICS GAAP income before income taxes (1) 23,289$ 22,224$ 104,773$ 86,931$
Pre-tax adjustments:
Grant of exchangeability to limited partnership units 649 456 2,512 2,293
Amortization of intangible assets 940 940 3,760 2,193
Total pre-tax adjustments 1,589 1,396 6,272 4,486
FENICS Pre-tax distributable earnings 24,878$ 23,620$ 111,045$ 91,417$
(1) Includes market data, software and post-trade revenues along with intercompany revenues which are eliminated
at the segment level upon consolidation.
Date
45
45
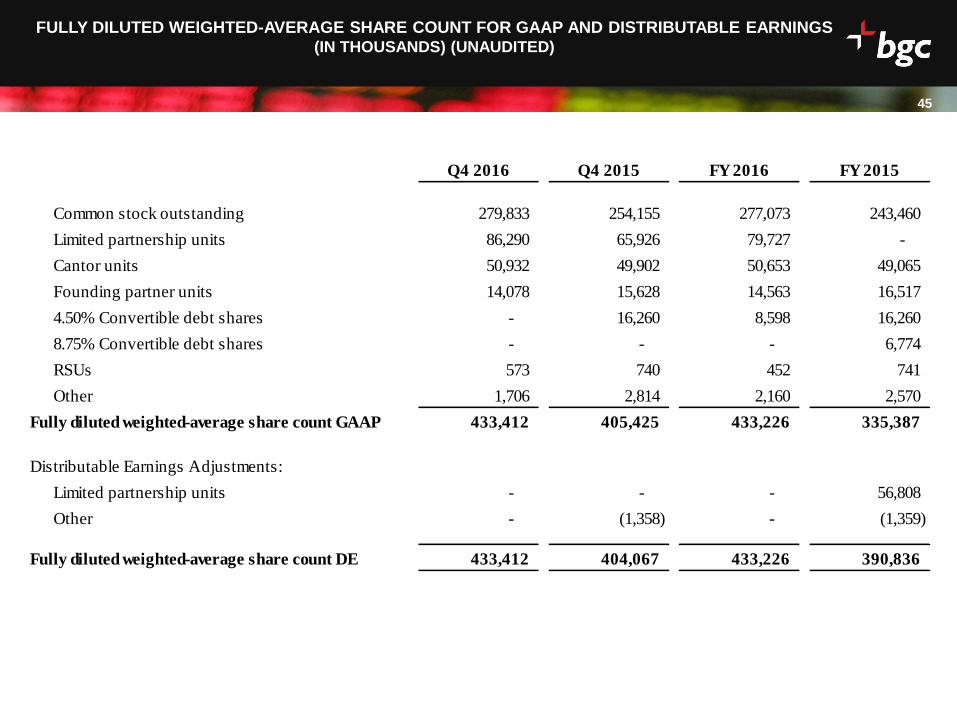
FULLY DILUTED WEIGHTED-AVERAGE SHARE COUNT FOR GAAP AND DISTRIBUTABLE EARNINGS (IN THOUSANDS) (UNAUDITED)
Q4 2016 Q4 2015 FY 2016 FY 2015
Common stock outstanding 279,833 254,155 277,073 243,460
Limited partnership units 86,290 65,926 79,727 -
Cantor units 50,932 49,902 50,653 49,065
Founding partner units 14,078 15,628 14,563 16,517
4.50% Convertible debt shares - 16,260 8,598 16,260
8.75% Convertible debt shares - - - 6,774
RSUs 573 740 452 741
Other 1,706 2,814 2,160 2,570
Fully diluted weighted-average share count GAAP 433,412 405,425 433,226 335,387
Distributable Earnings Adjustments:
Limited partnership units - - - 56,808
Other - (1,358) - (1,359)
Fully diluted weighted-average share count DE 433,412 404,067 433,226 390,836
Date
46
SEGMENT DISCLOSURE – Q4 2016 VS Q4 2015(IN THOUSANDS) (UNAUDITED)
Financial
Services
Real
Estate Services
Corporate
Items Total
Financial
Services
Real
Estate Services
Corporate
Items Total
Total revenues 359,301$ 306,098$ 7,849$ 673,248$ 378,206$ 287,384$ 9,334$ 674,924$
Total expenses 294,762 257,967 82,994 635,723 332,453 241,647 272,500 846,600
Total other income (losses), net (838) - 665 (173) 9,831 - 411,342 421,173
Income (loss) from operations before income taxes 63,701$ 48,131$ (74,480)$ 37,352$ 55,584$ 45,737$ 148,176$ 249,497$
Pre-tax adjustments:
Non-cash (gains) losses related to equity
investments, net - - (996) (996) - - 687 687
Allocations of net income and grant of
exchangeability to limited partnership units and
FPUs - - 60,264 60,264 - - 145,718 145,718
Nasdaq earn-out income 18,032 - - 18,032 7,787 - - 7,787
(Gains) and charges with respect to acquisitions,
dispositions and / or resolutions of litigation,
charitable contributions, and other non-cash,
non-dilutive items, net 5,980 1,375 7,058 14,413 6,383 1,492 (310,479) (302,604)
Total pre-tax adjustments 24,012 1,375 66,326 91,713 14,170 1,492 (164,074) (148,412)
Pre-tax distributable earnings 87,713$ 49,506$ (8,154)$ 129,065$ 69,754$ 47,229$ (15,898)$ 101,085$
Q4 2016 Q4 2015
Date
47
SEGMENT DISCLOSURE – FY 2016 VS FY 2015(IN THOUSANDS) (UNAUDITED)
Financial
Services
Real
Estate Services
Corporate
Items Total
Financial
Services
Real
Estate Services
Corporate
Items Total
Total revenues 1,523,235$ 1,058,322$ 31,066$ 2,612,623$ 1,548,159$ 998,450$ 33,830$ 2,580,439$
Total expenses 1,275,397 931,939 325,193 2,532,529 1,331,309 868,664 519,967 2,719,940
Total other income (losses), net 78,701 - 29,465 108,166 68,033 - 452,079 520,112
Income (loss) from operations before income taxes 326,539$ 126,383$ (264,662)$ 188,260$ 284,883$ 129,786$ (34,058)$ 380,611$
Pre-tax adjustments:
Non-cash (gains) losses related to equity
investments, net - - (3,543) (3,543) - - (2,597) (2,597)
Allocations of net income and grant of
exchangeability to limited partnership units and
FPUs - - 192,934 192,934 - - 259,639 259,639
Nasdaq earn-out income 849 - - 849 (7,336) - - (7,336)
(Gains) and charges with respect to acquisitions,
dispositions and / or resolutions of litigation,
charitable contributions, and other non-cash,
non-dilutive items, net 24,384 4,152 18,374 46,910 28,770 9,548 (308,330) (270,012)
Total pre-tax adjustments 25,233 4,152 207,765 237,150 21,434 9,548 (51,288) (20,306)
Pre-tax distributable earnings 351,772$ 130,535$ (56,897)$ 425,410$ 306,317$ 139,334$ (85,346)$ 360,305$
FY 2016 FY 2015
Date
48
48
LIQUIDITY ANALYSIS (IN THOUSANDS) (UNAUDITED)
December 31, 2016 December 31, 2015
Cash and cash equivalents 502,024$ 462,134$
Reverse repurchase agreements 54,659 -
Securities owned 35,357 32,361
Marketable securities (1) (2) 164,820 532,510
Total 756,860$ 1,027,005$
(1) As of December 31, 2015, $117.9 million of Marketable securities on our balance sheet
had been lent out in a Securities Loaned transaction and therefore are not included in
this Liquidity Analysis.
(2) The significant decrease in Marketable securities during the year ended
December 31, 2016 was primarily due to selling a significant portion of our position in ICE.

Date
4949
bgcpartners.com
twitter.com/bgcpartners
linkedin.com/company/bgc-partners
Investor Contact:
Jason McGruder
+1 212-829-4988