Embed Size (px)
Citation preview

IsVentureOver‐valued?
Numberstoponder…
SandHillEconometricsOctober20,2015

TheSandHillIndex
Anindexofvalueforventure‐fundedcompaniesLikeastockmarketindex,eg,Wilshire5000or
^DJTSM– Value‐weighted Continuouslyinvested Compiledonacurrent‐valuebasis
Showschangesovertimeforaportfolioinvestedinallventure‐fundedcompanies


Data–VentureSource(DowJones) 82,000valuationevents(roundsandexits) 25,000companies 9,000companiesstillprivatenow 16,400totalexits 1,900IPOs 7,500acquisitions 7,000failures

IndexComputationStrategy
AvalueforeverycompanyeverymonthCompaniesenterindexuponfirstroundoffundingCompaniesexitatIPO,Acquisition,orShutdown
Ifcompanyraisesaround,sharesvalue,weuseitIfcompanyraisesaround,novalue,weestimateitForIPOs,usepre‐moneyvalueIfshutdown,value=0Ifacquisition,valueshared,weuseitIfacquisition,novalueshared,weestimateitInterpolatebetweenrounds,andextrapolateafterlastround
Essential:Adjustestimatedvaluesforselectionbias.

Datachallenges:
1) Gravefinderbottofindquietfailures.
2) Rounds:Upwardbiasinreportedvalues.Correctbiasusinguncensored,secret,data.
3) Abouthalfofacquiredcompaniesdonotshareavalue.Many
areactuallyfailures.Toestimatemissingvalues,weuseeverythingweknowaboutthecompany(moneyraised,industry,location,levelofthestockmarket,yearsfromfirstround,businessstatus,bridgebeforeexit,whetheracquirerwaspublicorprivate,andmore),plusdatawehavegatheredoneffortrequiredtofindfindablevalues.
Biggerefforttofindavalue⇒lowervalue.

TheIndex
0
1,000
2,000
3,000
4,000
5,000
6,000
1992 1993 1994 1995 1996 1997 1998 1999 2000 2001 2002 2003 2004 2005 2006 2007 2008 2009 2010 2011 2012 2013 2014
The Sand Hill Index: All Industries
© 2014 Sand Hill Econometrics, Inc. ALL RIGHTS RESERVED
The Sand Hill Index: All Industries

Industries
0
2,000
4,000
6,000
8,000
10,000
12,000
14,000
16,000
18,000
1992 1993 1994 1995 1996 1997 1998 1999 2000 2001 2002 2003 2004 2005 2006 2007 2008 2009 2010 2011 2012 2013 2014
The Sand Hill Index: All Industries Compared
Other
Info Tech - Hardware
HealthRetail
© 2014 Sand Hill Econometrics, Inc. ALL RIGHTS RESERVED
TotalInfo Tech - Software
Cleantech

Somesummarystatistics Total$$investedinexitedcompanies $410bn Total$$valueofexitingcompanies $1,215bn $$Valuetoinvestorsfromexits $700bn $$Valuetofounders&ees $515bn
Grossnominalreturntoinvestors:18%/yr
Allfiguresarebeforefeesandcarry %offounderswith$>0atexit:30% MarketCapofcompaniesstillprivatenow$870bn $$investedincompaniesstillprivatenow$250bn
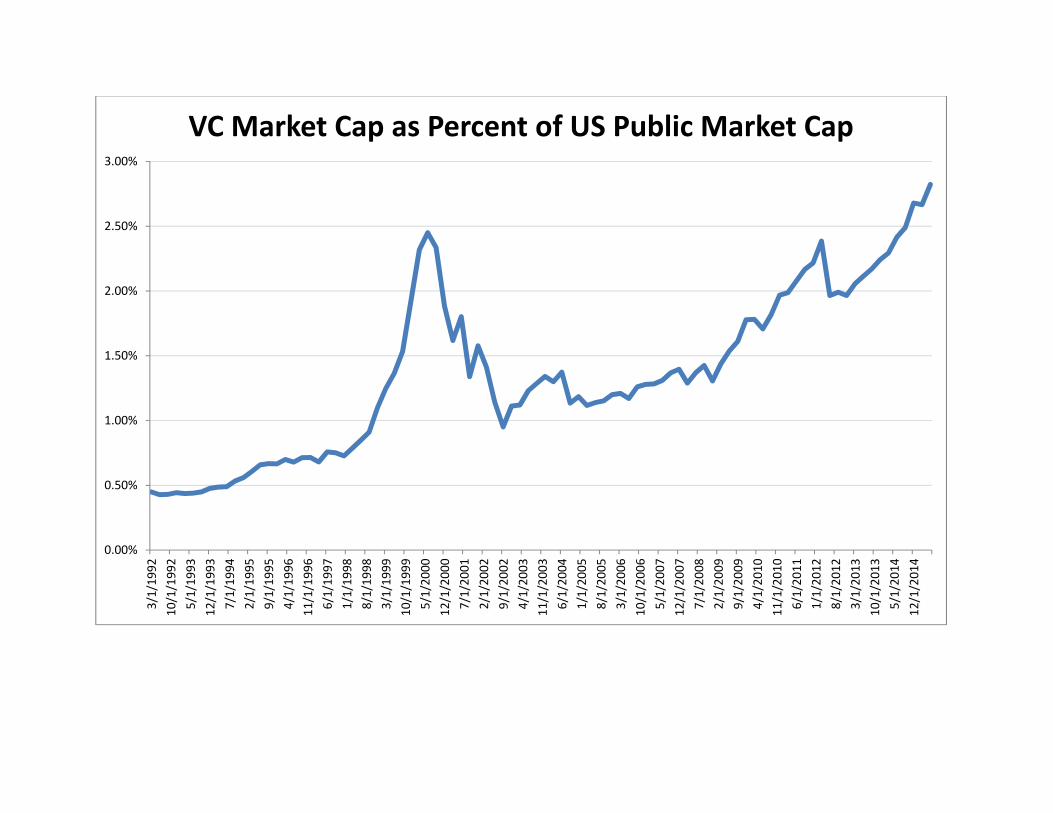
0.00%
0.50%
1.00%
1.50%
2.00%
2.50%
3.00%3/1/1992
10/1/1992
5/1/1993
12/1/1993
7/1/1994
2/1/1995
9/1/1995
4/1/1996
11/1/1996
6/1/1997
1/1/1998
8/1/1998
3/1/1999
10/1/1999
5/1/2000
12/1/2000
7/1/2001
2/1/2002
9/1/2002
4/1/2003
11/1/2003
6/1/2004
1/1/2005
8/1/2005
3/1/2006
10/1/2006
5/1/2007
12/1/2007
7/1/2008
2/1/2009
9/1/2009
4/1/2010
11/1/2010
6/1/2011
1/1/2012
8/1/2012
3/1/2013
10/1/2013
5/1/2014
12/1/2014
VC Market Cap as Percent of US Public Market Cap
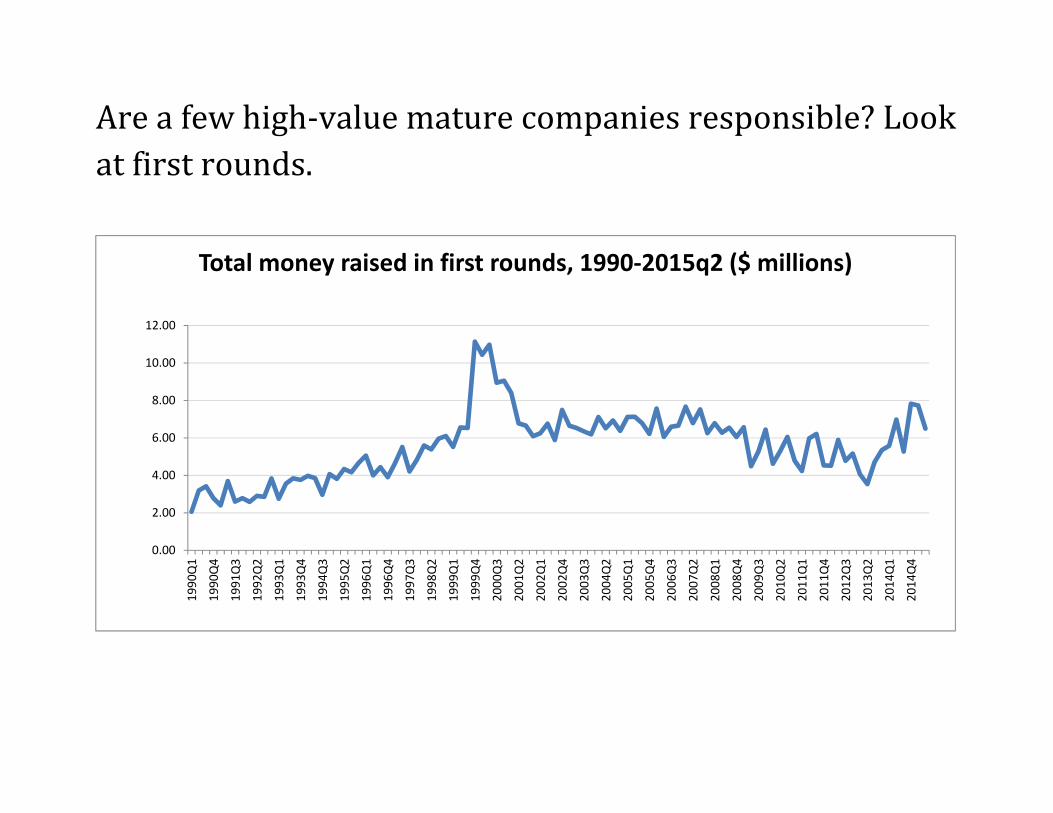
Areafewhigh‐valuematurecompaniesresponsible?Lookatfirstrounds.
0.00
2.00
4.00
6.00
8.00
10.00
12.00
1990Q1
1990Q4
1991Q3
1992Q2
1993Q1
1993Q4
1994Q3
1995Q2
1996Q1
1996Q4
1997Q3
1998Q2
1999Q1
1999Q4
2000Q3
2001Q2
2002Q1
2002Q4
2003Q3
2004Q2
2005Q1
2005Q4
2006Q3
2007Q2
2008Q1
2008Q4
2009Q3
2010Q2
2011Q1
2011Q4
2012Q3
2013Q2
2014Q1
2014Q4
Total money raised in first rounds, 1990‐2015q2 ($ millions)

Whataboutvalueperdollarraisedinfirstrounds?
0.00
1.00
2.00
3.00
4.00
5.00
6.00
1990Q1
1990Q4
1991Q3
1992Q2
1993Q1
1993Q4
1994Q3
1995Q2
1996Q1
1996Q4
1997Q3
1998Q2
1999Q1
1999Q4
2000Q3
2001Q2
2002Q1
2002Q4
2003Q3
2004Q2
2005Q1
2005Q4
2006Q3
2007Q2
2008Q1
2008Q4
2009Q3
2010Q2
2011Q1
2011Q4
2012Q3
2013Q2
2014Q1
2014Q4
Pre‐money value per $ raised, first rounds, 1990‐2015q2

Andthenumberofcompaniesdoingafirstround?
0
100
200
300
400
500
600
700
800
900
1990Q1
1990Q4
1991Q3
1992Q2
1993Q1
1993Q4
1994Q3
1995Q2
1996Q1
1996Q4
1997Q3
1998Q2
1999Q1
1999Q4
2000Q3
2001Q2
2002Q1
2002Q4
2003Q3
2004Q2
2005Q1
2005Q4
2006Q3
2007Q2
2008Q1
2008Q4
2009Q3
2010Q2
2011Q1
2011Q4
2012Q3
2013Q2
2014Q1
2014Q4
New companies per quarter, 1990‐2015

Whogetstheexitvalue?
0
20
40
60
80
100
120
140
160
180
200
Venture Capital Exit Value by year, bns of $$
founders investors

AndtheroleofNorthernCalifornia?(notetwocliffsinmarketcap–Googleexitin2004,Facebookexitin2012)
0
0.1
0.2
0.3
0.4
0.5
0.6
Mar‐92
Dec‐92
Sep‐93
Jun‐94
Mar‐95
Dec‐95
Sep‐96
Jun‐97
Mar‐98
Dec‐98
Sep‐99
Jun‐00
Mar‐01
Dec‐01
Sep‐02
Jun‐03
Mar‐04
Dec‐04
Sep‐05
Jun‐06
Mar‐07
Dec‐07
Sep‐08
Jun‐09
Mar‐10
Dec‐10
Sep‐11
Jun‐12
Mar‐13
Dec‐13
Sep‐14
Jun‐15
Northern California, % of mkt cap and money raised
NoCal % of Mkt Cap
No Cal % of $$ raised


![VENTURE CAPITAL FOR SUSTAINABILITY 2007 REPORT [2007] Venture Capital... · growing sector as Venture Capital for Sustainability ... Venture Capitalists’ stake in ... Venture Capital](https://img.dokumen.tips/doc/110x75/5a7926b77f8b9a00168dc540/venture-capital-for-sustainability-2007-2007-venture-capitalgrowing-sector.jpg)